

GIS For Dummies
.pdfChapter 8: Gathering and Digitizing Geographic Data 121
time a sensor senses an area, it records a single radiation value in a particular radiation band for each pixel. The more sensors available on a single satellite, the more sensor bands you pick up because each sensor looks for a unique part of the electromagnetic spectrum (see Figure 8-3). So, rather than a single set of digital values representing only one radiation band, you get multiple sets of values, each based on its own part of the spectrum.
Electromagnetic Spectrum
1 km |
1 cm |
1– 2 cm 10– 4 cm |
10– 6 cm |
10– 9 cm |
10– 13 cm |
Figure 8-3: |
|
|
|
|
A whole |
|
|
|
|
spectrum |
|
|
|
|
of input is |
Microwave |
Visible |
Ultraviolet |
|
available |
|
|||
to remote |
Infrared |
|
X-rays |
Gamma rays |
sensors. |
|
|||
Radio |
|
|
|
|
|
|
|
|
Enhancing images
With layered digital images, you can work with the separate spectral (wavelengths of radiation) layers and decide how to put them together to get the exact picture you want. For example, when you take photographs with a digital camera, you can change the appearance of those pictures by using your computer (or sometimes even the camera’s software). You can change Grandpa’s red eyes to their original brown or get rid of that line on the image that resulted from a hair that fell across the lens. You adjust the picture in this way, called image enhancement, to make the image clearer or simply more understandable to image analysts.
You can use images gathered from aerial photographs as base maps (a starting point for more complex maps) when you’re heads-up digitizing (digitizing off the screen) because these photographs give a nice, relatively current picture of the Earth. Also, enhanced images make heads-up digitizing even easier than the raw images do because enhanced images allow the human eye to see things not visible under normal circumstances. For example, you can make lines (such as fences) and boundaries (between fields and pastures) stand out so they can be easily seen for digitizing. This sounds a bit like cheating, but it really isn’t. It’s
a bit like what studio photographers do to create those special-effects pictures for weddings, graduations, and other special events.
122 Part II: Geography Goes Digital
Classifying images
Scientists classify satellite images, often with the notion of putting those images into a GIS package. Rather than relying on the human eye to do the work, the computer classifies the images in two basic ways:
Supervised classification: With supervised classification, you first identify an object you know, such as a lake. You then tell the computer to look at the pixels that you selected and find other pixels that have the same kind of spectral values (brightness values in each spectral range). That’s the non-technical explanation. The actual computer program is all about statistics, but it really just tells the computer to “find other stuff that looks like this selection and call that stuff a lake.”
Unsupervised classification: If you want to be a bit more rigorous or you’re unfamiliar with an area, you can use unsupervised classification, in which the image processing software randomly picks different pixels as start-
ing points. You can include a class estimate (such as the upper and lower limits) of the types of features you see in an image. The software groups the pixels into those classes and then searches to find others like them.
For example, if you want the computer to pick ten classes, you get a random set of pixels grouped into ten classes. Then, the computer finds pixels that “look” like (have the same range of pixel values) each group and classifies them. After you review the results, you can tweak the upper and lower limits of your class values as needed to capture all the class information you want.
This approach may not pick up all your pixels the first time, or it may get classes confused. In general, if you put it through a few trials, it can find a pretty good set of classes. But it doesn’t give those classes names — that’s your job. Nice to know you’re needed, huh?
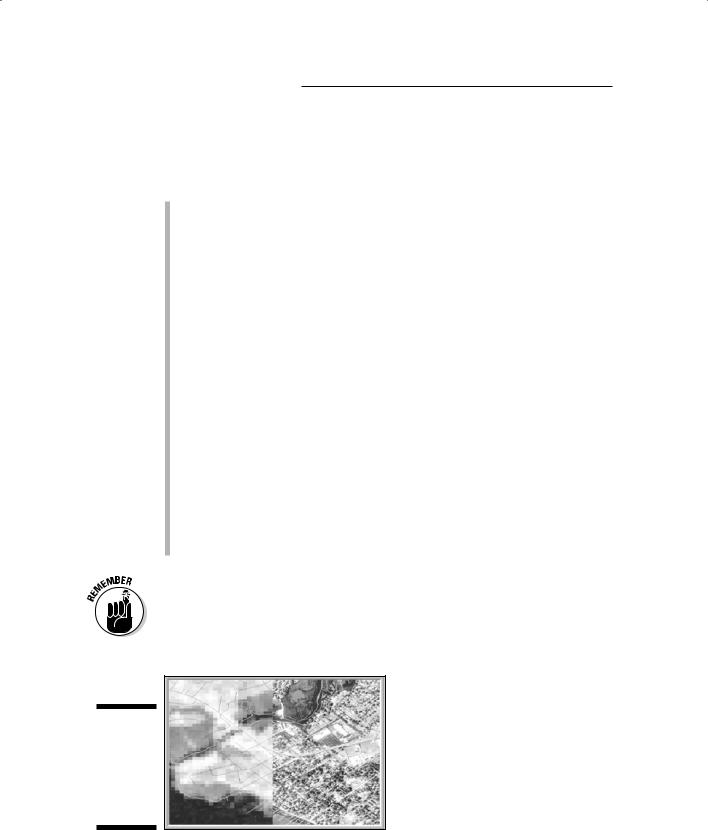
Whichever classification method you choose (supervised or unsupervised), you get what remote sensing scientists call an image map. And you can put that image map into your GIS. In fact, one of the advantages of the raster GIS is that its data structure is nearly identical to the data structure of these satellite images. Figure 8-4 shows a typical image map.
Figure 8-4:
A typical digital satellite image is a set of pixels.

Chapter 8: Gathering and Digitizing Geographic Data 123
When you use remotely sensed images, you have access to a large number and different types of land-sensing satellites, so you can obtain new images frequently. As a way of updating GIS data, especially information such as land cover and land use, this type of GIS input is invaluable because it covers so much territory, so frequently, and at a relatively minor cost per unit area.
Collecting field data
People collected data in the field long before satellites, GPS, or even GIS were around. Assembling field data can involve conducting house-to-house surveys; collecting traffic data along roads; recording the air temperature and other atmospheric data; or gathering soils, vegetation, insects, or any number of other environmental samples. For hundreds of years, naturalists, anthropologists, and many others collected data about people, plants, animals, landforms, and the like, but collecting such data with the idea of subsequently producing maps came a bit later.
No matter what types of data you intend to collect, you generally can’t find and record every single instance of the features you’re examining. Imagine, for example, that you want to study grass in your backyard. You’re going to be there a very long time if you intend to collect data on every blade of grass. Or perhaps you want to measure the temperature everywhere in your city. Because temperature is continuous (it occurs in virtually every possible place all the time), it’s physically impossible to collect temperature everywhere. In each case, you’re forced to collect data from a sample of the total. For GIS, you need to sample geographic space (which is, by definition, continuous).
Maps represent space, so the samples that you take (spatial sampling) must represent that space accurately. That’s a fancy way of saying if you’re sampling trees on an island, you can’t sample on just one side of the island. You need to sample everywhere that might possibly feature trees to get meaningful results for mapping. Lack of spatial sampling is a common problem with many GIS databases.
When you take samples of data, be sure that you take samples from all sorts of different places — places that have different sizes, shapes, elevations, and climates.
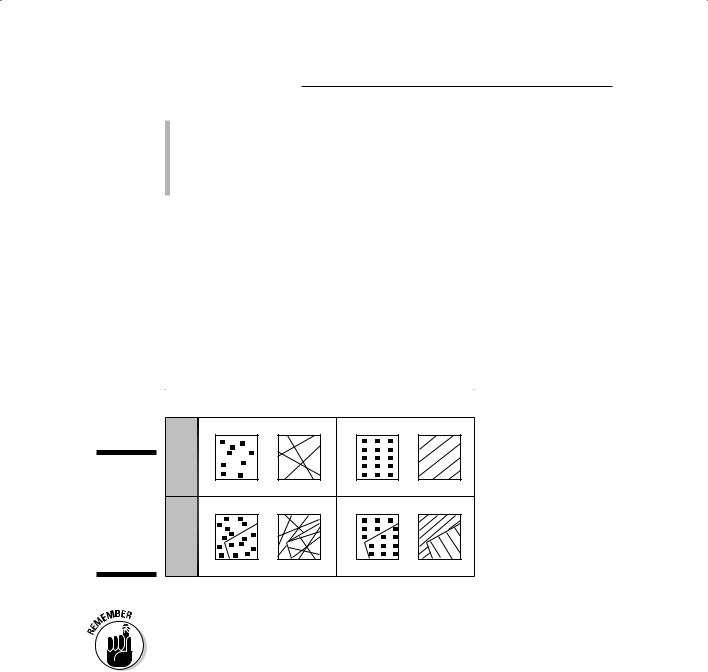
By using the sampling process, you’re trying to determine the numbers, distributions, and locations of geographic features in different parts of your study area. You can sample spatial data in several ways, depending on whether you’re trying to collect point, line, or area data. These data can be grouped into the following classes, as shown in Figure 8-5:
Clustered: Sampling focuses on areas that have a lot of features from which you can sample.
124 Part II: Geography Goes Digital
Systematic: You use a specific, often regular, pattern to sample. For example, you sample at every meter along a line.
Random: The sampling has no pattern at all. This approach often uses a computer to generate random numbers so the randomness of the samples has no human bias.
You can also stratify these samples (divide them into groups, or strata) so that you can do a specific portion of your sampling in each of a number of sub-portions of your sample area. To stratify your sample of who watches certain television programs in your city, you could divide the city into subportions, or neighborhoods. Then, you pick a certain number (for example, 25 people) in each neighborhood to sample randomly, systematically (for example, every fifth house), or clustered (such as where housing density is highest).
Figure 8-5:
Spatial sampling schemes for point, line, and area data.
|
Random |
Systematic |
|||
|
|
|
|
|
|
Points |
|
Transects |
Points |
Transects |
|
or Quadrats |
or Quadrats |
||||
|
|
||||
|
|
|
|
|
|
Stratified Homogeneous
Spatial sampling can give you a much better representation of the geography. Whatever method you use, the key is simply to recognize that your data has a spatial distribution and a sampling strategy that ignores that distribution usually results in less than useful data.
Working with census data
Almost by definition, a census is a complete counting, although that’s seldom possible because (for a census of human population) parts of the population may have no address, may be purposely hiding, or may simply be missed.
There are many types of census, including censuses of agriculture and bird populations, that don’t involve counting humans.

Chapter 8: Gathering and Digitizing Geographic Data 125
The most common type of census is the census of population. The United States performs a census every ten years on years ending in zero. This census results in the most common census products: The census DIME files and the subsequent TIGER files (see Chapter 5 for more on these file types), both of which are readily incorporated into nearly all modern GIS software. These files, however, are just the entities. Over the years, not only has the Census Bureau developed a substantial set of attributes, but it has also created an entire census geography used by human geographers, as well as business people, government bodies of all levels, and those who want to include socio-economic data into their own GIS activities. Many other nations have censuses, and you can often find their data available for input into a GIS database, as well.
The attributes that are linked to DIME and TIGER files are found in summary tape files (STF), which have been around since the old days when the data were stored on 9-inch magnetic tape reels. Generally, the STF contain population demographics, including schooling, ethnicity, number of children, employment, income, housing, and even number of vehicles. These data are in map-ready form, from the 1980 census DIME files to the TIGER files used today. The DIME file structure is still used because the data collected for the 1980 census are still useful and are stored in that structure. (See Chapter 5 for a refresher of the differences between DIME and TIGER files.) Additionally, with some work, you can convert earlier census figures to GIS-compatible forms. Details about the content of the STF are readily available from the Census Bureau at
www.census.gov/geo/www/index.html
Getting Existing Map Data into the Computer
Thousands upon thousands of hard-copy maps have yet to make it into computers. You can digitize hard-copy maps in three basic ways: manual or hand digitizing; scanning; and heads-up digitizing from a scanned image, using your computer monitor. After you choose a method, you need to follow a process to prepare your map, decide what features are important to capture, verify the accuracy of what you captured, and create metadata that describes the captured information.
Forms of digitizing
You can choose from three basic methods of converting from analog (hard copy) to digital GIS data. Manual or hand digitizing is perhaps the oldest and still a time-honored, albeit tedious, method. Scanning involves using advanced versions of the technology of the modern digital camera and personal flatbed
126 Part II: Geography Goes Digital
scanners. Finally, heads-up digitizing is an increasingly common form of input. The following sections give you a brief idea of how each method works, which can help you decide which you’re comfortable with.
Hand-digitizing data
Hand digitizing is a bit like hand washing. Some delicate things really do benefit from special attention. Although many operations today have abandoned large-volume hand digitizing, you may find yourself in a situation in which you have a special map or your scanner’s inoperable, making an old-style digitizing tablet really helpful. In some instances, hand digitizing has become a lost art, but you may like to remind yourself of the old days — plus, you do have a lot of control over what you enter into your computer when you use this technology.
A digitizer is much like a mouse with an attitude, but the mouse pad also has a role to play. The mouse, in this case, is called a cursor or a puck, and it normally has a small transparent Lucite portion that sticks out. The puck has a nicely defined crosshair target, so you can see exactly where it’s pointing. A board (the tablet or table portion of the digitizer) replaces the cushioned mouse pad, and this board includes a very fine mesh of electrified wires that crisscross up and down, and right and left, at very precise distances. These wires are sensors that know exactly where that target on your cursor is at any given time. And because the board and the cursor talk to each other, the digitizer software can record the position of the cursor in exact millimeters or small portions of an inch.
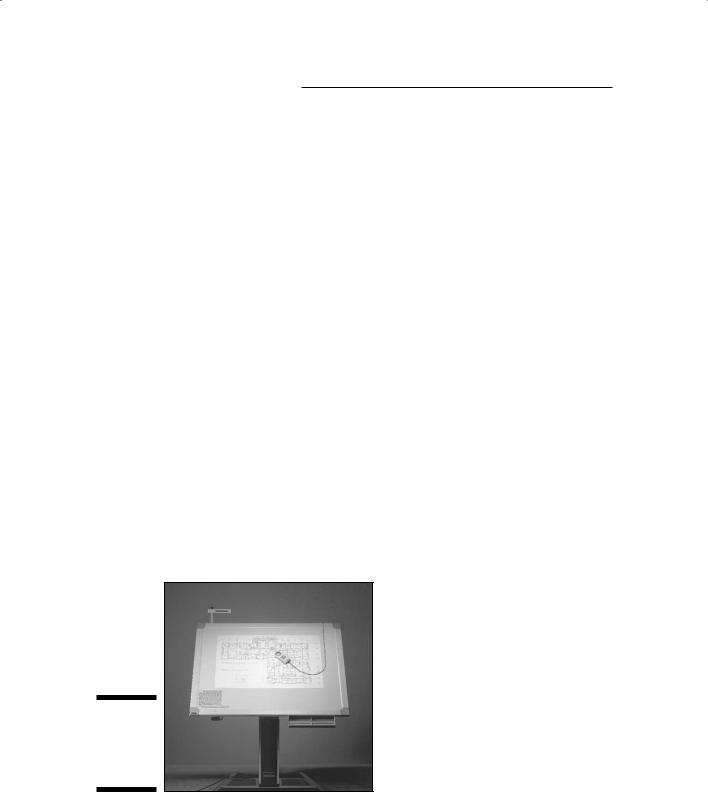
Really nice large-format digitizers (like the one in Figure 8-6) have a lot of space on which you can place large maps. You can raise and lower the digitizers, and tilt them to accommodate any user.
Figure 8-6:
A largeformat digitizing tablet.
Chapter 8: Gathering and Digitizing Geographic Data 127
A digitizer is much more than hardware, though. It also has software that allows your computer and its GIS software to communicate with the digitizer. The digitizer and the GIS need this software because the coordinate system on the digitizer is flat and measured only in inches and/or millimeters, so it doesn’t understand that the map you have is based on a scaled-down, projected version of the real world. (Check out Chapter 2 for more about coordinate systems.)
The digitizer usually has its own graphics language and hardware drivers that either come included with your GIS software or must be installed on your GIS. Not to worry — virtually all large-format digitizers are designed for all forms of graphics communication, including GIS. Most GIS software already contains the drivers for the digitizers on the market.
Scanning your map
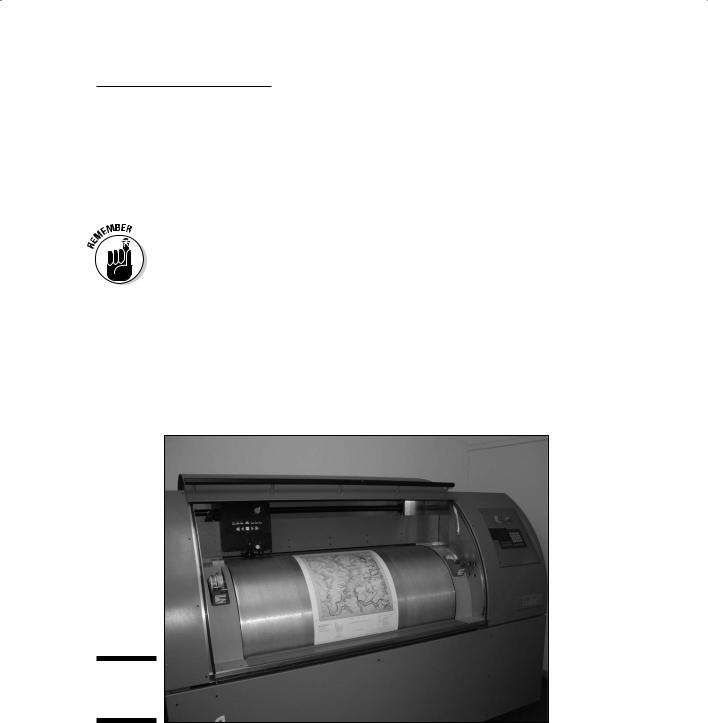
Both scanning technology and the software that interprets the results have improved enormously over the past three decades. You may already own or use a simple scanning device, such as a copy machine or small flatbed scanner. Although these types of scanners are a similar technology, for most maps, you want to use a large-format drum scanner (like the one in Figure 8-7).
Figure 8-7:
A drum scanner.
You place the map or image edge-first onto the drum inside, and the drum spins while a laser reads (scans) the document. Normally, the scanning software converts the document into a raster image that your GIS software can easily convert to vector format. Earlier drum scanners were very expensive and frequently produced enough errors that data input specialists often found it faster and more effective to digitize most maps by hand.
128 Part II: Geography Goes Digital
Using heads-up digitizing
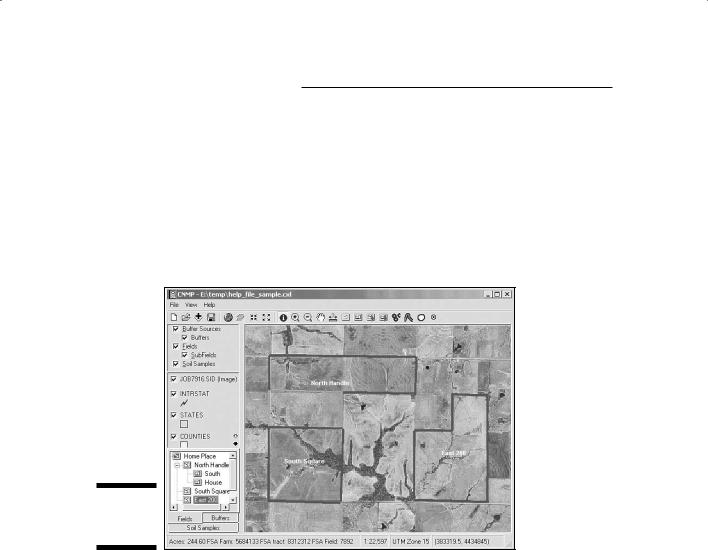
Because much aerial photography and even many maps have already been scanned as graphic images, more GIS data input specialists use those graphic images as a background template against which they do digitizing. You display the image on the computer monitor and then selectively isolate and record the locations of the image features inside the computer (as shown
in Figure 8-8). You can most effectively do this type of digitizing when the graphic includes many locations for which you’ve already well established the accurate latitude and longitude locations.
Figure 8-8:
Heads-up
digitizing.
As compared with the other forms of spatial data input, heads-up digitizing is more direct, requires less equipment, and doesn’t require you to constantly relocate tic marks (little x’s that identify the corners) on the maps or aerial photographs that you’re inputting. I’ve also found that I can sit and input considerably more comfortably than I can while standing over a digitizing tablet. Also, when you use heads-up digitizing, you can easily see whether you’ve included all the features you want because all the features you have digitized appear as graphic lines or points over the background image.
Heads-up digitizing does have some drawbacks. Most of those drawbacks result from the need to scan the raw imagery and maps to make them compatible as digital background for the heads-up digitizing process. With
Chapter 8: Gathering and Digitizing Geographic Data 129
today’s scanners, you don’t really have to worry about this issue, especially when compared with the variable distortion of the imagery or paper maps themselves, which may occur when digitizing over multiple sessions under uncontrolled temperature and humidity.
Preparing your map for digitizing
When you digitize or scan a map, you have to do several things to prepare the map and yourself for the process. Digitizing some maps takes a very long time, so you can get the most accurate results by digitizing those maps in a series of short sessions because you will be less fatigued while you work.
Follow these steps to get your maps ready for effective digitizing sessions:
1.Put your maps in the room where the digitizer does its work and leave them for a few days.
Doing this lets the maps get used to the temperature and humidity. Yes, the environment does make a difference — recall all those sagging posters that you’ve seen on walls that used to be stretched taught?
2.Remove any obstructions or marks from the map.
The scanner records everything — including Spot’s hair, if it’s on the map. You don’t need to worry about this concern as much if you’re hand digitizing with a tablet, rather than scanning.
3.Secure the map to the tablet, if you plan to use a digitizing tablet instead of scanning your map.
You need to tape the map to the tablet so it doesn’t move around. Use drafting tape, not masking tape. Masking tape will tear your map.
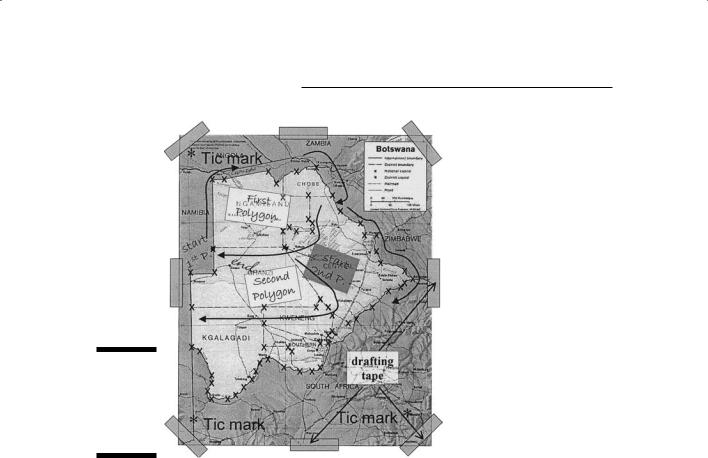
4.Mark the sequences of points, lines, and areas (polygons), that you plan to digitize during a given session.
You can save time by picking out and marking only those features that you want to scan. Figure 8-9 shows a taped map with sequences of digitizing locations in place on the map.
If you’re really serious about preserving your map, place a tight surface of clear acetate over it and mark the acetate so that the map itself remains pristine.
130 Part II: Geography Goes Digital
Figure 8-9:
Preparing the map before digitizing saves time.
Deciding what to digitize
Only you can figure out what you need to digitize on your map. First, decide what you want out of your GIS, formally called the spatial information product (SIP) — meaning what you need your final map to look like. If you know what the final map looks like in your head, you can figure out the ingredients you need to make that map a reality.
This map preparation isn’t simple, but it isn’t as daunting a task as you might think, either. You need to decompose your project — break it into individual bite-sized pieces rather than trying to digitize large complex maps all at one time. Nearly every SIP is a composite of all or pieces of various maps. For example, a map showing the best location to put a new school in your town would be an SIP.
If you ask yourself some questions, you can get a pretty good idea of how a map is created. Suppose that your general question is, “What makes for a good school location?” Here’s the list of features a school needs and the related information that a map needs to show: