

GIS For Dummies
.pdfChapter 10: Finding Features in Vector Systems 161
The process for finding information spatially in the ArcGIS is actually a bit simpler than using the search-by-attributes method. Because the graphical interface offers many selection options, you don’t need to select a layer.
Remember, your system may have a different user interface with different menus and buttons, but the concept is the same. Follow these steps to search your data using graphics:
1.Choose the Select by Location tool or menu.
In my example, I chose Selection Select by Location.
2.Select the relative location you want to search.
For example, select Adjacent to, Within a Distance of, and so on.
In my example, I’m going to look for all countries that have data for major cities. To do this graphically, I select the Contain option, so the search will find the country polygons that have data points in them associated with large cities.
3.Run the Select by Location tool.
4.View the result.
The software finds all the polygons that have major cities in them and highlights them on the map. And because the map is linked to the graphic, the data in the tables are also selected. Depending on your software, you may have to choose from a menu or click a button to toggle the map or the table on or off.
5.Repeat these steps to perform another search.
You can find more about search strategies in Chapter 9.
Counting, Tabulation, and
Summary Statistics
This chapter contains several examples of how to search vector systems to find the features and distributions you’re looking for. In each case, you have the choice to display the results as a map, a table, or both. The nice
thing about retrieving table data is that you can manipulate this data like you can in any database. You can sort, group, and perform calculations on the table data by selecting the available options built right into your software, much like your favorite spreadsheet. Usually, the default settings are quite adequate for the first look, but when you begin to ask more questions, more manipulations allow you to get a better idea of the scope and meaning of your selected data. The following list gives you some examples:

162 Part III: Retrieving, Counting, and Characterizing Geography
Counting: The tables allow you to count the number of items in each column so that you know the total number of items included in the table. For example, I can count the number of countries in my Africa database.
Tabulation: Like you can in spreadsheet programs, you can sort the entire table contents by any column. And you can sort each column in either ascending or descending fashion. Suppose that you want to list African cities from highest to lowest population. You can sort the entire table or just the content that your search selected. By simply rearranging the content — without any numerical manipulation — you can examine your data in any order you want and compare one column against another. In many cases, this comparison leads to even more ideas for future comparisons and analysis.
Summary statistics: A natural extension of counting and tabulating data is the calculation of summary statistics. Most GIS software allows you to easily create summaries. With a button click or two, the ArcGIS options provide the basic summary statistics — minimum, maximum, sum, mean, and standard deviation. These numbers cover all the basic stats you need to decide whether you may find the numbers useful for further analysis. You can
•Look at the relationships between highestand lowest-populated countries.
•Determine whether the mean is a good summary statistic for national population in Africa.
•Compare each nation’s population to the total for the entire continent.
And here’s the best part: You hardly have to do anything to get these numbers.
Validating the Results
When you search for something in a GIS, you most often have some idea of what you want to do with it. The results from a simple search are rarely the same as they would be for a detailed analysis. Still, you can do a few things when you finish a search to interpret whether you did your job correctly. Ask yourself these questions:
Did I get the correct data? This doesn’t mean did you get roads when you wanted rivers. If you search for rivers, but only navigable ones, make sure the rivers that show up are coded as Navigable. Choosing the wrong attribute can happen, and that causes mistakes, so check that your results returned what you think you asked for.

Chapter 10: Finding Features in Vector Systems 163
Getting the correct data also assumes that the data source contains the right level of measurement and a classification system that works for your application. Getting a soil map of Kansas only to find that the map is based on a Russian soil classification system doesn’t do you much good if you are looking for a soil in the US classification system.
Are your data on the right scale? If you’re interested in road networks for a city but search on a database for an entire country, you face a good chance that the smaller roads don’t appear in the database. Usually, this situation occurs when you don’t have access to the level of detail you want. Be prepared to throw stuff out if your results are inaccurate.
Are the data timely? If your data source has information from different time periods, double check that you’re asking for results from the right one. Looking at the population of African countries by using the 1998 data doesn’t return results from the census conducted in 2000.
Are the data complete? Having complete data means that nothing is missing (duh), but it also means that your data offer more than just the database objects. You need to know exactly what the categories mean, where the data came from, and where you can go to get updated data. This data-about-data is called metadata, and it functions to provide additional information about a database component’s origin, format, synopsis, and so on. Most GIS include a way to add metadata (as I describe in Chapter 8), but sometimes GIS databases don’t include the metadata. This omission limits the utility of the data.

164 Part III: Retrieving, Counting, and Characterizing Geography

Chapter 11
Searching for Geographic Objects, Distributions, and Groups
In This Chapter
Knowing why you search for polygons
Searching the right polygons for your needs
Understanding the six methods for locating polygons
Turning found objects into groups
After you put geographic data into the computer, you use GIS frequently to get information derived from the data back out. To retrieve data that
best suits your needs, you must know why, where, and how you search for geographic objects (such as roads, rivers, lakes, power plants, and thousands of others) and distributions represented by polygons (such as the range of an animal species or ethnic groups within a nation).
The vast majority of geographic objects that you encounter every day occur in groups. Some of these groups even have specific names. Birds occur in flocks, cattle in herds, trees in forests or orchards, quail in coveys, geese in gaggles, and the list goes on. Beyond the biological groups, glacial features (called drumlins) form in swarms, streets form networks, streams form watersheds, homes form neighborhoods, and many more. People assign special names to groups to provide a handy way to refer to features that look alike, act alike, occur in similar places, are near certain features, or occur in similar patterns or densities.
In this chapter, I show you how to specify search criteria that can yield the results you’re looking for. And after a brief look at common GIS interfaces, I explain the six methods for searching for polygons and why you might need to use each one. You can search for groups of objects by using the same GIS functions that you use to search for individual objects. Then, you can classify the whole group to suit your needs. This chapter shows you how to conduct a search for groups of objects, too.

166 Part III: Retrieving, Counting, and Characterizing Geography
Searching Polygons in a GIS
When GIS first came on the scene, resource specialists mainly used it to examine large portions of natural resources that were distributed over large areas of land. Similar data that spreads over large areas, represented by polygons (in vector GIS), are called a distribution. Distributions are still among the most important features in GIS. GIS can represent distributions of people, animals, disease, crime, land use, pollution, and more. To get the most from GIS, get familiar with distributions and use that information to make decisions. (See Chapter 3 for more about distributions.)
Whether polygons represent distributions of individual objects (such as people or animals) or area features (such as land parcels or forests), you can use many of their properties for later analysis. The data inside polygons can exist at any of the measurement scales, including nominal, ordinal, interval, ratio, or scalar. (I talk about measurement in Chapters 1 and 3.) You can look for objects based on thematic content, such as types of animals, houses, or trees. You can describe distributions based on size, orientation, perimeter, area, change over time, and many other factors.
Polygons are connected to each other, surround other things, and are surrounded by other things. They have a long list of spatial relationships that other objects don’t have. To get the most from GIS, you use those properties and relationships to make decisions regarding the data you retrieve when you search your GIS.
Searching for the Right Objects
When you search for an object, you must know what you need to accomplish with it before you can determine which object can do the trick. You look for your car keys because you want to drive your car, you look for your receipts because you need to do your taxes, and you look up a telephone number because you need to make a phone call. You have the same basic reasons for searching for two-dimensional objects (such as land parcels, landforms, or soil polygons and their distributions) in GIS.
You can decide to conduct a search for a bunch of reasons. You may want to search for objects within a polygon out of simple curiosity. You may want to open a map just to see the map itself and identify any patterns that appear.
Even a quick perusal of map content shows you
What categories are available: For example, what land-use categories are present in a land-use map.

Chapter 11: Searching for Geographic Objects, Distributions, and Groups 167
The general size and shape of the polygons: For example, where pine bark beetle infestation is occurring in a forest stand.
The general configuration and locations of polygons: For example, where populations at risk from potential hazardous materials spills are distributed.
Think of searching a polygon as taking a journey through its data to discover what’s where. Think of yourself as a world explorer and think about your maps as questions, rather than answers. When you get in this mindset, such questions (or hypotheses) lead to additional exploration: searches, measurements, and subsequent analyses.
Extracting specific information
Simple curiosity is fine, but a more common reason you conduct a search of polygonal objects and distributions is to extract specific information from the maps. You may conduct a search to simply explore the data, but most often, you use more complex analysis after data exploration or as a result of previous knowledge of the map content.
You gain knowledge about map content by viewing similar maps or by drawing on your familiarity with the real world represented by the map. For example, you might examine the locations of different land-use types relative to different elevation zones. You can examine the relationship of your maps’ features by looking at the maps, their legends, and any associated tabular data (for example, a road map might have a table showing the mileage between major cities).
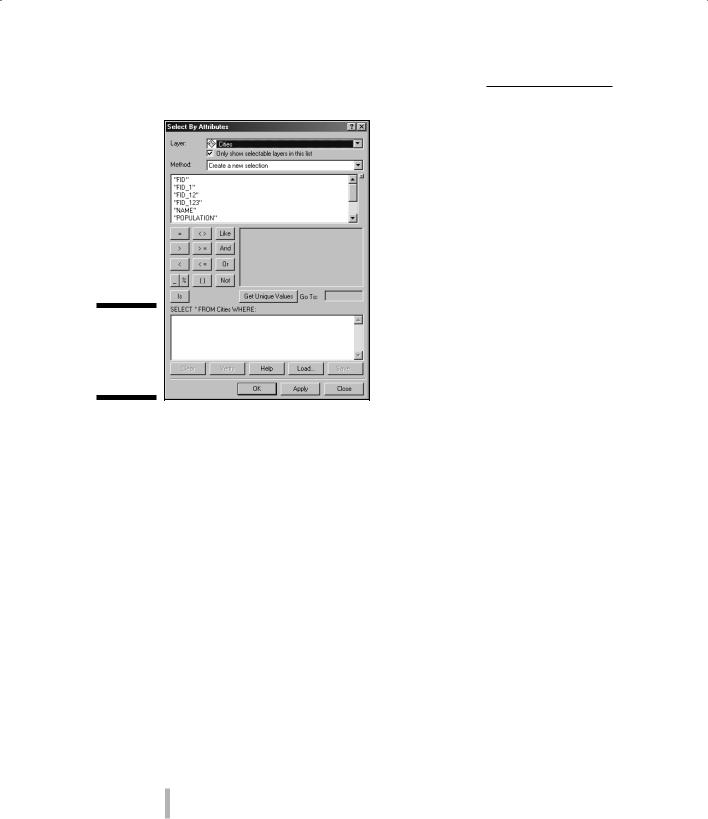
Searching for objects in modern GIS requires a logic-based search strategy, which a graphical user interface (GUI) provides (as shown in Figure 11-1). The GUI uses Structured Query Language (SQL), which includes basic AND, OR, and NOT operators, as well as mathematical comparative operators such as =, >=, <, and many others.
Misplaced parentheses or other punctuation marks can wreak havoc with searches that use SQL search methods such as the one shown in Figure 11-1. Until you get really comfortable with the syntax, do searches in small bites, creating interim maps that you analyze, combine, modify, and otherwise work with later. This approach forces you to think clearly about what data you’re looking for and formulate your queries succinctly.
168 Part III: Retrieving, Counting, and Characterizing Geography
Figure 11-1:
The GUI used in the ESRI ArcGIS product.
Knowing the size of each polygon
When you enter polygon information in a GIS, the software often calculates each polygon’s area and perimeter, and then stores the calculations in associated database tables. Beyond those simple measures, you can find information about distances between polygons, orientation, roundness or other shape values, major and minor axis lengths, and so on.
Working with concentrations of point objects
With today’s GIS software, you can create polygons based on the concentrations of point objects. For example, suppose you map individual crime occurrences and notice concentrations in particular neighborhoods. You can group these concentrations into separate polygons (by neighborhood) and use those polygons to compare crime data to neighborhood economic conditions. Some GIS analysts call this hot spot analysis.
Maps can contain many related polygons. Think about these related distributions:
Zoning polygons coinciding with land values
Vegetation patterns coinciding with animal ranges
Chapter 11: Searching for Geographic Objects, Distributions, and Groups 169
Average income by census district compared to education level
Land-use patterns in 1997 compared to land-use patterns in 2007
High cancer areas compared to hazardous waste sites
Reorganizing data
You can modify polygonal categories, values, or boundaries so that you can control the content of the maps you use for analysis. When you do so, you don’t change the data; you just organize it differently. And you have various ways to reorganize map content, including
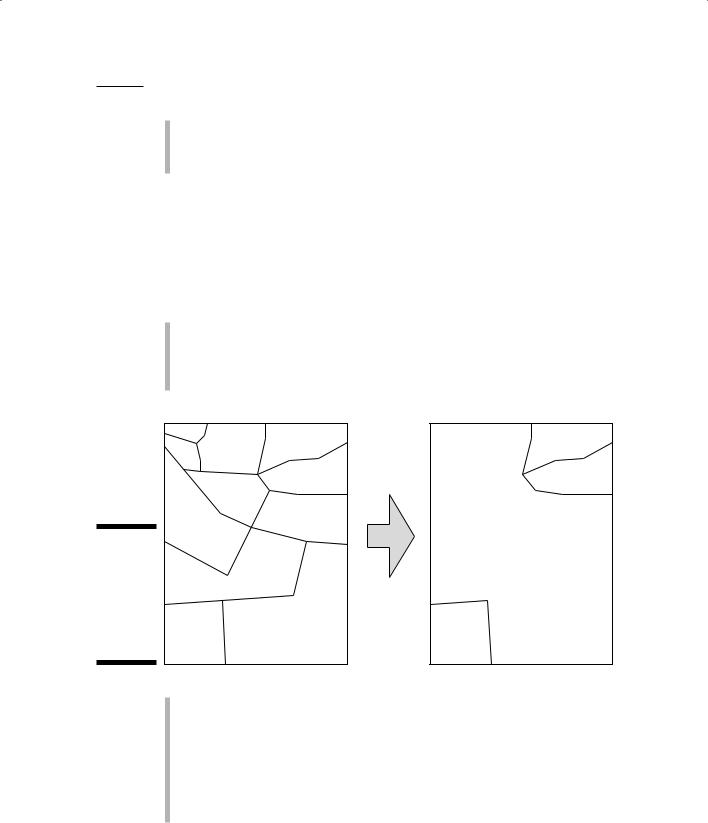
Clumping, or aggregating, categories: For example, you might change categories such as Pine, Oak, Birch, and other tree types into a single category called Forest (see Figure 11-2). You might want to use this larger category to compare the position of the resulting polygon to areas of land owned by the federal government.
|
pine |
|
barren |
barren |
|
oak |
birch |
||
|
|
|
||
|
|
|
|
|
|
|
|
grassland |
grassland |
|
|
oak |
|
|
|
fir |
|
pine |
|
|
|
|
|
|
Figure 11-2: |
|
|
|
FOREST |
You can |
|
|
birch |
|
aggregate |
|
|
|
|
|
|
|
|
|
tree species |
|
|
|
|
data into a |
|
|
|
|
category |
|
|
|
|
called |
barren |
|
tamarisk |
barren |
Forest. |
|
|
|
|
Changing data measurement scales: Suppose you have maps of land cover (a fancy name for what’s on the land), and you want to change these nominal data (farmland, bare soil, grassland, forest, abandoned, and so on) to ranked data based on the degree to which the land cover types allow soil erosion. To make this change, you assign each category a number. In this case, you want the numbers to show the susceptibility to erosion. Because bare soil is probably the most susceptible, you give it a value of 1. Abandoned land gets a value of 2; farmland gets a 3; forest gets a 4; and grassland gets a 5.
170 Part III: Retrieving, Counting, and Characterizing Geography
Locating 2-D Map Objects
You can search for polygons in six ways: by (1) category, (2) data level, (3) size, (4) arrangement, (5) orientation, or (6) position. Each method accomplishes a specific goal. For example, you might want to search for a certain type of forest (category), or for forests that are grouped together (arrangements), or forests that occur in linear strips oriented north and south (orientation). The following sections offer examples that use each of the six methods.
Searching based on category
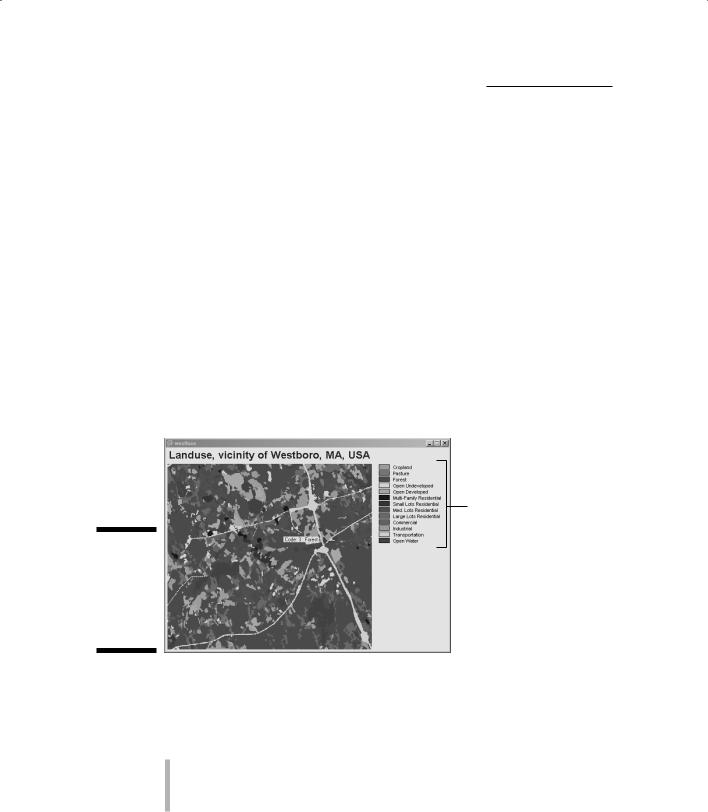
Most objects, whether stored at ordinal, scalar, interval, or ratio scales, typically have names associated with them. If you aren’t interested in how much or how many, then you want to search by category name. A common type of nominal map is the land-cover or land-use map. Such maps depict many types of land cover or land use and show these features as categories in the legend (see Figure 11-3).
Legend
Figure 11-3:
Selecting the categories of land use that you want to display.
Some systems enable you to access nominal categories directly from the map legend, and others give you a GUI based on SQL. (I talk a bit about search strategies in the section “Extracting specific information,” earlier in this chapter.) The results of searching from the legend or with a GUI differ:
When you search from a legend, you usually double-click the legend itself and pull up a list of options that you can pick from. Essentially, though, you’re simply reclassifying or hiding categories (to remove them from view, see Figure 11-4), not really creating a new map.