

GIS For Dummies
.pdfChapter 6: Keeping Track of Data Descriptions 101
When you establish a relational join, all the information in the first table is shared with all the information in the second table, which is much easier than trying to make a huge, complex, comprehensive table from scratch. It’s much easier to design small, individual, focused tables (that can be related to other small ones) than to create large, unwieldy ones. Using smaller tables also gives you flexibility if you need to add new types of data to your database. You simply add a new small table that contains a column common to other existing tables.
Relating tables with joins sounds easy, doesn’t it? Well, it is, and it also adds flexibility and robust search capabilities to your GIS database. But you do need to be sure that the tables have at least one column in common. The common column enables the join and allows the tables to share information.
Managing data in Vector GIS
ESRI ArcInfo is a classic model of how Vector GIS employed the power of the database management system to store and manage all attribute information. Figure 6-5 is a simple graphical description of how the system looks. One set of programs (the Arc side) contains the graphics portion of the database (the entities) and the other side (the Info side) contains the descriptions (the attributes).
Graphics
Attributes
|
|
LUCODE |
LANDUSE |
STATUS |
OWNER |
PRICE |
|
|
|
010002 |
row crop |
active |
Sylvia Porter |
$1,000 |
Software |
|
|
|
|
|
|
|
Link |
|
|
020001 |
orchard |
dormant |
Robert Orange |
$1,500 |
|
Figure 6-5: |
|
030001 |
rangeland |
active |
Joseph Barney |
$650 |
|
|
|
|
|
|
|
|
|
|
010002 |
row crop |
active |
Dabney Porter |
$1,200 |
|
|
The ArcInfo |
|
|
|||||
|
|
|
|
|
|
|
|
|
010004 |
garden farm |
active |
Alice Stalk |
$2,000 |
|
|
system |
|
|
|||||
|
|
|
|
|
|
|
|
model. |
|
010002 |
row crop |
dormant |
Jordan Waits |
$1,100 |
|
|
|
|
|
|
|
|
|
|
|
|
|
|
|
|
|
Database management systems may look like the tables of a spreadsheet, but they’re actually much more complex, and they operate quite differently. For a system such as ArcInfo (or other Vector GIS that uses database management systems), the points, lines, and polygons all have descriptive information
102 Part II: Geography Goes Digital
about them in the columns of the database management system, but they also have identification codes that link this information to the entities on the Arc side.
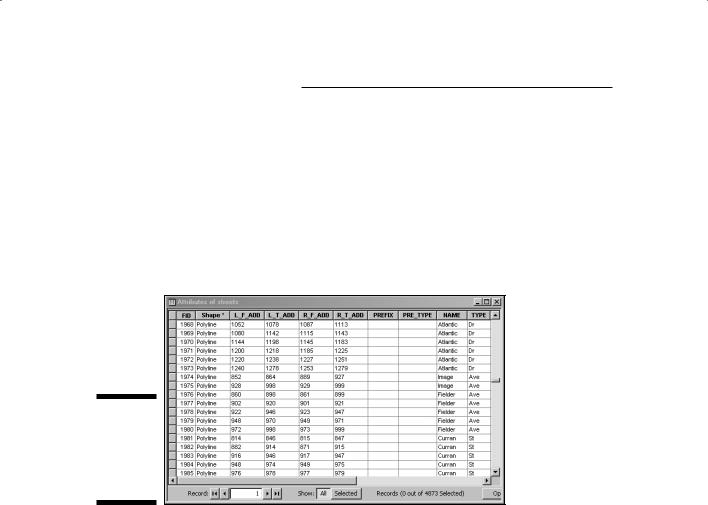
Figure 6-6 shows an example of a table from a recent version of ESRI ArcInfo, called ArcGIS version 9.X. This table includes polygon ID codes, as well as a lot of columns of spatial attribute data that you can use to search. The polygon codes allow the software to find all the graphics (in this case, polylines) that are associated with them. And each code is also linked to all the other elements in that row so the computer can find them as well.
Figure 6-6:
The database table for a spatial database in ArcGIS 9.X.
Storing data in Raster GIS
Raster GIS normally stores attribute data in the grid cells themselves. Each grid cell gets its own value for each layer, and you can easily locate and retrieve each cell using that value. But, like with Vector GIS, the need to hold more complex datasets and more descriptive information for each layer ultimately led to the incorporation of RDBMS inside Raster GIS. In a way, the data storage is not that much different than you find with Vector GIS, except that in raster, each grid cell category (rather than, for example, each polygon) has a set of descriptive information.
You query data in a Raster GIS with RDBMS in the same way that you do with a vector system. The tables look pretty much the same, and even the query tool is often identical, so you don’t have to figure out a new one. This capability in a Raster GIS makes the computations simple and extendable to remotely sensed raster data. It also adds the RDBMS’s power to store and manage large datasets.

Chapter 6: Keeping Track of Data Descriptions 103
Searching with SQL in any GIS
Modern GIS software relies heavily on the idea of storing descriptive information in a set of tables, but not just any tables — database management system tables. The database management system contains a powerful set of query tools because, like any RDBMS, it employs the Structured Query Language (SQL). The database contains data organized in tables (relations), and the SQL searches these data.
SQL is a fairly standard computer language designed specifically for accessing, querying, and manipulating databases. It allows you to search for very specific information, retrieve it, delete or add to it, update it, and combine queries.
SQL searches database tables by using commands such as Select, And, Or,
Insert, Delete, Order By, and many more.
The following steps show how to retrieve a subset of data by using the SQL Select command:
1.Determine the subset of information that you want to retrieve from your GIS data.
Suppose you have a table of land attributes like the following (Land_ Ownership), and you need only the information related to the land use and ownership categories.
Polygon ID |
Land-Use |
Land |
Public / |
|
Type |
Condition |
Private |
7255 |
Recreation |
Active |
Public |
7721 |
Agriculture |
Idle |
Private |
7246 |
Agriculture |
Active |
Private |
2.Structure a SQL SELECT command to specify the attributes that define the information you want to retrieve.
Because you are interested in only the land use and ownership categories, you specify those attributes and issue the following command
SELECT Land_Use_Type, Public_Private FROM Land_Ownership
where Land_Use Type and Public/Private are the attribute names and Land Ownership is the table name.
That command returns the following subset of the original table:

104 Part II: Geography Goes Digital
Land-Use Type |
Public / Private |
Recreation |
Public |
Agriculture |
Private |
Agriculture |
Private |
This example returns two columns from the database and leaves the rest behind. This simple operation demonstrates that you can execute literally hundreds and thousands of other, more complex queries.
Understanding Object-Oriented Systems
An object-oriented database management system (OODBMS) extends the traditional database management system so that it can model and create objects based on those data. Objects are collections of data and computer code that have two primary characteristics — inheritance (a common set of properties that move with them) and hierarchy (a place within larger classes of objects that have common properties).
By using software that has this capability, you don’t have to re-create the properties of some groups of data that act as objects; the object inherits those properties, which saves a great deal of time. This inheritance also prevents you from changing properties of data arbitrarily and making mistakes by combining incompatible data — like putting 2-inch pipe and 8-inch pipe together for a sewage line.
Storing attributes with object-oriented systems
If you inspect a geodatabase — the ESRI application of object-oriented database management systems for GIS — it looks, at first blush, pretty much like any other database. It has columns and rows, tuples and relations, primary keys, and (if necessary when primary keys are not common to two tables) foreign keys. In short, the user interface looks pretty much the same as any RDBMS-based GIS to the user. But the geodatabase’s ability to store collections of data as objects makes it different and more powerful than systems that lack the inheritance property of objects in object-oriented systems.

Chapter 6: Keeping Track of Data Descriptions 105
The OODBMS has the same descriptive items that you normally find in a GIS implementation of the RDBMS. What gives this system its power and makes it a major innovation in GIS isn’t in the way it stores traditional descriptive data, but in that it also has a set of tables that go beyond describing the qualities of geographic features — what they are, how big they are, and so on — by also describing how those qualities translate into real geography.
Using object orientation to enhance descriptive information
Every geographic feature, whether it’s manmade or natural, has properties that affect its functionality. Superhighways have the ability to move more cars than two-lane roads, so superhighways are the better choice for constructing an interstate highway system. And some types of vegetation grow faster than others, so the fast-growers are often chosen for shelterbelts and ornamental use. These and the millions of other functional properties make the simple descriptions of content, color, size, shape, and so on less useful for decision-making. Through experience, you know how a feature’s properties affect its use and implementation.
Now, imagine you have that practical experience stored explicitly in your GIS tables. Experience is translated into a set of rules and behaviors that exist for each object (for example, each road type). The biggest advantage of object-oriented systems such as the ESRI geodatabase is that they add these behaviors to the stored objects. So, if you try to put geographic features into a database that violate the known behaviors of the object class they belong to, the software rejects them. Also, the behaviors often translate into how you can and can’t link different objects in your GIS.
Knowing the packaging descriptions for different objects
An enormous number of industries, organizations, and settings use GIS, which makes it an enormously powerful tool. But it also has the potential to be a rather large, even ungainly, piece of software because it tries to meet too many different user needs. The geodatabase steps in and allows for the creation of large, comprehensive sets of rules and conditions that largely depend on the types of data, conditions of use, and methods of geographicfeature interaction specific to each set.

106 Part II: Geography Goes Digital
In RDBMS terminology, a general data model that’s modified to address the specific data and query needs for a given application is called a schema. So, for example, you might have a general schema for vegetation analysis that you can modify for desert vegetation. ESRI and its software users have created an ever-increasing array of industry-specific schemas that they refer to as geodatabase models. ESRI intended not only to share these schemas, but also to use them as examples for other industries when developing their own schemas.
Because ESRI wanted to share the geodatabase, the institute has developed best practices that act as a guideline for developing these geodatabase models, regardless of content. These best practices indicate that each model should include the following:
A case study that implements the model as an example for new users.
An import template into which users can import their own data.
A white paper that explains the model.
A data-model poster that provides a graphic idea of how all the data fit together.
A set of tips and tricks for new users based on the case study.
(Optional) Web-based collaboration with other users.
|
Table 6-1 lists well-established, industry-specific geodatabase data models cre- |
|
|
ated by ESRI and their customers. The table also indicates which of these data |
|
GIS |
models, at the time of this writing, have case studies, templates, and a variety |
|
of tools for incorporation into the models. |
||
|
Table 6-1 |
Industry-Specific Geospatial Data |
|
|
|
Case Studies |
Templates |
Tools |
|
|
|
|
Address |
X |
X |
X |
|
|
|
|
Agriculture |
X |
|
|
|
|
|
|
Archiving |
X |
|
|
|
|
|
|
Atmospheric |
X |
X |
X |
|
|
|
|
Basemap |
X |
X |
X |
|
|
|
|
Biodiversity |
X |
X |
|
|
|
|
|
Building Interior |
|
|
|
Space |
|
|
|
Census-Administrative |
X |
X |
|
Boundaries |
|
|
|
|
|
|
|
Defense-Intel |
X |
X |
|
|
|
|
|

Chapter 6: Keeping Track of Data Descriptions 107
|
Case Studies |
Templates |
Tools |
Energy Utilities |
|
X |
|
|
|
|
|
Energy Utilities — |
|
X |
|
MultiSpeak |
|
|
|
|
|
|
|
Environmental |
|
X |
|
Regulated Facilities |
|
|
|
|
|
|
|
Fire Service |
|
X |
|
|
|
|
|
Forestry |
|
X |
|
|
|
|
|
Geology |
X |
X |
X |
|
|
|
|
GIS for the Nation |
X |
X |
|
|
|
|
|
Groundwater |
X |
X |
|
|
|
|
|
Health |
X |
X |
|
|
|
|
|
Historical |
|
X |
|
Preservation and |
|
|
|
Archaeology |
|
|
|
|
|
|
|
Homeland Security |
X |
X |
|
|
|
|
|
Hydro |
X |
X |
X |
|
|
|
|
International |
X |
X |
|
Hydrographic |
|
|
|
Organization (IHO) |
|
|
|
S-57 for ENC |
|
|
|
Land Parcels |
X |
X |
|
|
|
|
|
Local Government |
|
X |
|
|
|
|
|
Marine |
X |
X |
X |
|
|
|
|
National Cadastre |
|
X |
|
|
|
|
|
Petroleum |
X |
X |
|
|
|
|
|
Pipeline |
X |
X |
|
|
|
|
|
Raster |
X |
X |
|
|
|
|
|
Telecommunications |
|
X |
|
|
|
|
|
Transportation |
X |
X |
|
|
|
|
|
Water Utilities |
X |
X |
X |
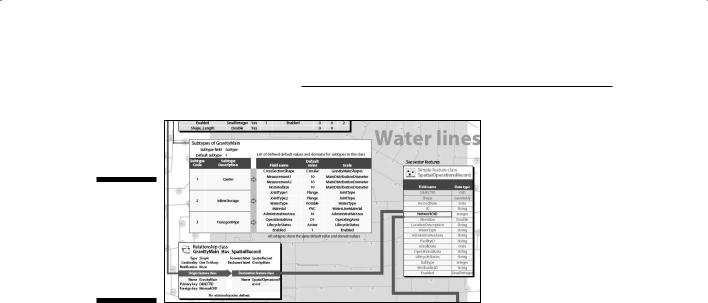
These geodatabase data models can get quite complex because of the number of geographic features that users must consider, the properties for each of those features, and the potential number of rules for interaction. The posters that accompany many of these existing models provide an excellent graphical view of their operation and organization. Figure 6-7 shows a small portion of a poster for the water utility model from Table 6-1.
108 Part II: Geography Goes Digital
Figure 6-7:
A portion of a water utilities geodatabase data model poster.
The geodatabase model and other object-oriented spatial data models are likely to grow in number and complexity. They add tremendous robustness and accuracy to an application, but using them means that you need to know more about your particular industry. In many applications, you can find far more missing relationship rules than rules that are completely understood. Advances in what people know about the geography that drives an industry can result in more complete sets of rules, as well as far better models built on these OO databases.

Chapter 7
Managing Multiple Maps
In This Chapter
Knowing the importance of managing multiple maps
Figuring out what map-handling capabilities you need
Choosing a system for your needs
If a picture is worth a thousand words, a map is worth a million. With GIS, you can work with more than one map at the same time. So, GIS gives
you many millions of words at your fingertips. Every portion of the Earth, whether it’s natural or man-made, is very complex. Even if you ignore for a minute that every portion of land has depth, you can map many possible features, including houses, people, insects, plants, diseases, pollen, sidewalks, gas lines, salaries, streets, temperature, and pressure. The list is endless.
When mapped, each of these features provides a portion of the geography of a piece of land, and each set of similar features represents a separate theme. Within each theme, the explicit locations of each object, combined with the thousands of possible implicit spatial relationships, tells volumes. But, like any story, your land needs many characters — many themes. To get a complete picture, you need to have many mapped layers.
ESRI provides software, lessons, and technical support for K–12 Education around the world as a means of encouraging spatial thinking. The K–12 educators at ESRI call the map-layering process “making an Earth sandwich.” And, like an Earth sandwich, a GIS works only when it has more than one layer. The individual layers become useful only when you can extract information from each and compare and contrast that different information. To make this comparison, the software must be capable of storing, retrieving, editing, analyzing, and producing new data from all layers. In this chapter, I show you how the various types of GIS systems do all these data management tasks.

110 Part II: Geography Goes Digital
Layering Data in GIS Models
Geographers have long recognized the many types of geographic features and that many of these features tend to occur in similar patterns. So, for example, if you look at where most of the people in the world are located, you also see a strongly similar pattern of water sources, such as coastlines, lakes, springs, and rivers.
These similar patterns may or may not be related, may or may not show cause and effect, and may or may not occur at the same time. But they all definitely do one thing — they demonstrate that the more of these patterns you map, the better you can understand the geography.
Each GIS layer must exist as a separate searchable item that you can access independent of the other layers. And, at the same time, the GIS must also have these characteristics:
Data segmentation: After you retrieve layers, the individual geographic features and the related data that make up each layer must also be readily accessible.
Data comparability: When you have access to the individual layers, features, and their descriptive content (categories and values), you must be able to compare these categories and values across any and all layers, and any and all content.
Accessibility and comparable data relationships are the heart of GIS — and they’re what give GIS much of its power.
In Chapter 16, I show you a set of powerful techniques that allow you to compare layers to one another. These techniques, collectively called overlay, come in many forms and require you to compare the data by using various methods, such as formal logic and mathematical manipulation. You use these techniques to create completely new layers that you can then analyze.
Comparing the Map-Handling
Capabilities of GIS System Models
There are three basic types of system models for GIS: hybrid, integrated, and object-oriented. Each model type is designed to manage multiple layers. But each takes a fundamentally different approach to storing and