

GIS For Dummies
.pdfChapter 16: Comparing Multiple Maps 241
Finding points in polygons
Point features occur in many different places at different times for different reasons. You might want to identify where and to what extent (for example, how many) selected point objects occur within the boundaries of area features. And guess what? You can do just that with ease by using either a raster or vector GIS model. Table 16-1 shows a selection of questions that you might ask to identify whether features you’re interested in occur in the same locations.
Table 16-1 |
Possible Point in Polygon Pairings |
||
Question |
|
Point Feature |
Polygon Feature |
|
|
|
|
Do the nests of the endangered burrowing |
Burrowing |
City parks |
|
owl occur within the boundaries of the city |
owl nests |
|
|
parks? |
|
|
|
Is there a difference in number of auto |
Reported |
City |
|
thefts in the Hillshire neighborhood than |
auto thefts |
neighborhoods |
|
other parts of town? |
|
|
|
Which parts of town have the highest con- |
Homes of |
City |
|
centrations of cancer patients? |
cancer |
neighborhoods |
|
|
|
patients |
|
Are cases of salmonella distributed evenly |
Cases of sal- |
U.S. counties |
|
among the counties of the United States? |
monella |
|
|
|
|
|
|
Do brown bears use habitat types differen- |
Brown bear |
Wildlife habitat |
|
tially (use one type more than another)? |
sightings |
areas |
|
Which counties have the greatest concen- |
Tornado |
U.S. counties |
|
trations of tornado sightings? |
sightings |
|
|
|
|
|
|
Do certain parts of town demonstrate low |
Homes of |
City |
|
numbers of newspaper subscribers that I |
newspaper |
neighborhoods |
|
can target for new subscriptions? |
subscribers |
|
|
You can probably think of a bunch more questions that deal specifically with your business or industry, but I think you get the idea. To answer your questions, you need a piece of software that can keep track of the data you use to make your comparisons.
The GIS (by design) keeps track of point features, their X and Y coordinates, and their attribute information. It also stores the coordinate and attribute information for all the polygons in the locations covered by your database. When you put data into your GIS database, you usually put point and polygon features on separate layers (although you don’t absolutely have to). So, to
242 Part IV: Analyzing Geographic Patterns
compare these different features, you retrieve the point features (by type or value; see Chapter 11) from one layer and compare the result to polygons — also selectively retrieved by type or value — from another layer.
This process is called point-in-polygon overlay, and you follow these general steps to accomplish it in your GIS:
1.Use your system’s built-in query capabilities to find point features by any attribute you decide.
The retrieved points are your first layer in this instance.
2.Use your system’s built-in query capabilities to find the polygon features that you want to compare with the point features.
The retrieved polygons are your second layer in this instance.
3.Place the point and polygon layers on top of each to create a new map.
Your GIS creates a new visual display that shows both the points and the polygons. It also creates a table that combines the attribute information from each layer.
Creating a new map from your separate layers is important when you want to actually use that map for analysis. Unlike a strictly visual overlay that you might see in a graphics program or many CAD systems, GIS software relates not only the locations you see (the X and Y coordinates), but also the attribute information for every feature you’re comparing.
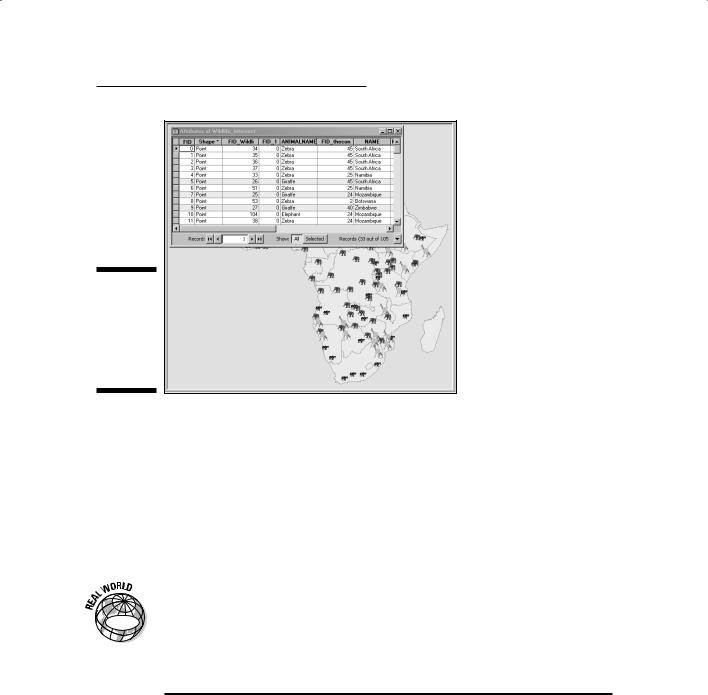
You use the tables that you get when you perform point-in-polygon overlays to analyze the results. These tables indicate which points occur in which polygons (as shown in Figure 16-1). Using this information, you can count the number of features for each polygon, calculate density by polygon, and perform a host of other analyses.
My discussion of point-in-polygons overlay is based on the vector data model, but you can easily do the same thing by using a raster GIS. When using a raster GIS, the software searches the attributes in the same way that it does in vector and compares the coordinates — but the exact X and Y coordinates are replaced by the grid cell’s position in the matrix.
The point-in-polygon operation is a powerful tool for comparing point objects to area objects, but you might not need to perform this operation if the points and polygons are already on the same map.
Chapter 16: Comparing Multiple Maps 243
Figure 16-1:
A table resulting from a point- in-polygon overlay operation.
Finding lines on polygons
The movie title A River Runs through It pretty accurately explains the idea of line-on-polygon overlay methods. I changed the word in (from the point- in-polygon method I describe in the preceding section) to on in this case because the vast majority of lines don’t fit completely inside any given poly-
gon. Instead, like a river, they cross polygon boundaries. (Perhaps using line- through-polygon would be more appropriate, but few people use that term in the GIS industry.)
|
Lines running through polygons may be just as meaningful for analysis as |
|
|
points in polygons. In many applications, such as transportation planning, the |
|
GIS |
line features are the primary focus of the analysis. Transportation planning, |
|
for example, includes many types of lines whose presence can have profound |
||
|
||
|
impacts on the surrounding polygon features. Table 16-2 shows some exam- |
|
|
ples of line-on-polygon comparisons. |
Table 16-2 |
When Lines and Polygons Collide |
|
Line Features |
Running through These |
Have This Effect |
|
Polygons |
|
Fault lines |
Residential areas |
Produce populations at risk |
|
|
|
Streams and irri- |
Agricultural lands |
Irrigate crops |
gation systems |
|
|
(continued)
244 Part IV: Analyzing Geographic Patterns
Table 16-2 (continued)
Line Features |
Running through These |
Have This Effect |
|
Polygons |
|
Hazardous cargo |
Hospital zones |
Create potential evacuation |
routes |
|
difficulties |
Paths and roads |
Portions of national parks |
Provide access for eco- |
|
and preserves |
tourism and conservation |
|
|
activities |
Water pipes, |
New subdivisions |
Determine the cost of infra- |
electrical lines, |
|
structure development |
and gas lines |
|
|
Tree lines and |
Farms and grazing lands |
Provide protection from |
fence rows |
|
the wind or livestock |
|
|
containment |
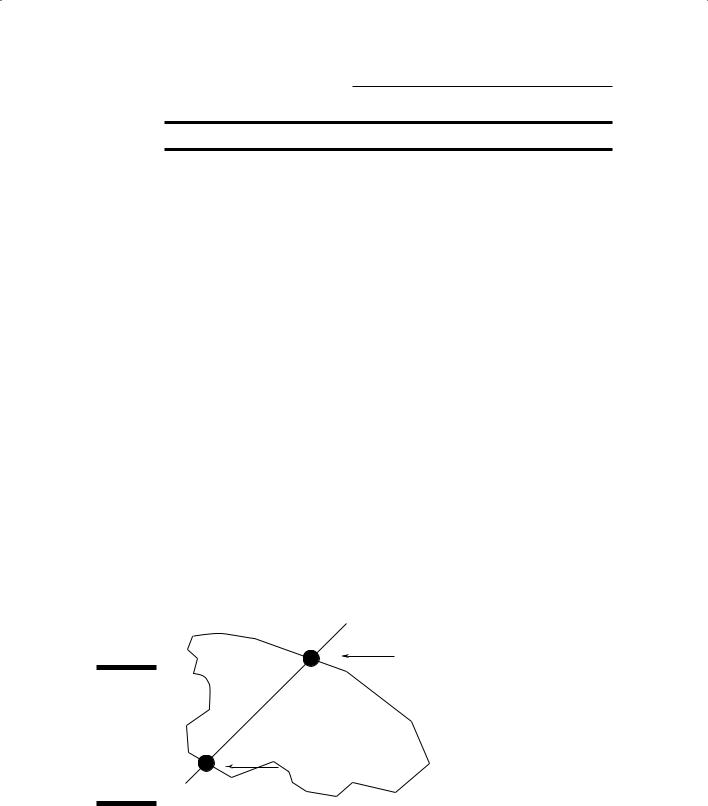
In vector GIS, lines are composed of line segments, each with its own set of beginning and ending coordinate pairs. Most of the time, these beginning and ending locations don’t coincide exactly with the borders of polygons. So, the software has to work a little harder to figure out exactly where the line moves from one polygon to another by determining where the line is going and where it will intersect the coordinates of the boundary for each new polygon (as shown in Figure 16-2). Both raster and vector GIS models can perform line-on-polygon operations, but GIS users more commonly use the vector model for this operation.
Like with point-in-polygon methods (discussed in the preceding section), this overlay operation produces tables that show which lines and polygons intersect so that you can analyze properties like orientation, density, and comparisons of line and polygon types.
(X, Y) |
(line/polygon |
|
intersection) |
Figure 16-2:
Finding the coordinates for points where a line
crosses a (X, Y) polygon’s
borders. (line/polygon intersection)

Chapter 16: Comparing Multiple Maps 245
Using Logical Overlay to Compare Polygons
The most powerful, most robust, and probably most common types of overlay operations are those comparing one set of polygons to another. Generally known as polygon overlay, they offer many more options than point-in-poly- gon and line-on-polygon overlays.
Logical overlay is a method of comparing multiple maps that uses a group of operations based on set theory to search the polygons to determine whether attributes are shared from one map to the other (belong to a common set).
In set theory, three basic set operations compare the objects contained in one set to those of another set. These operations are union (where you combine all the stuff from both sets), intersection (where you select only those things common to both sets), and complement or symmetrical difference
(where you identify all the objects that the sets don’t have in common).
Table 16-3 shows some possible uses of polygon overlay.
GIS
Table 16-3 |
Polygon Overlay Uses |
Polygons |
Comparison |
|
|
Land uses or land cover |
Time periods |
|
|
Plant and animal species ranges |
Common distributions |
|
|
A time series of maps of Dutch |
The rate of the spread of Dutch elm disease |
elm disease |
|
Neighborhoods |
Which fall within a 100-year flood zone |
|
|
Unlike comparing sets of dinnerware or sets of keys to make decisions, with GIS software, you look at portions of each polygon that you overlay to see how those portions relate to other polygons in different layers. Like set theory itself, these overlays employ three basic types of operation. You’ll also find some less familiar but quite useful forms in your map comparison activities. I explain each of these forms in the following sections so that you can actually see what they look like.
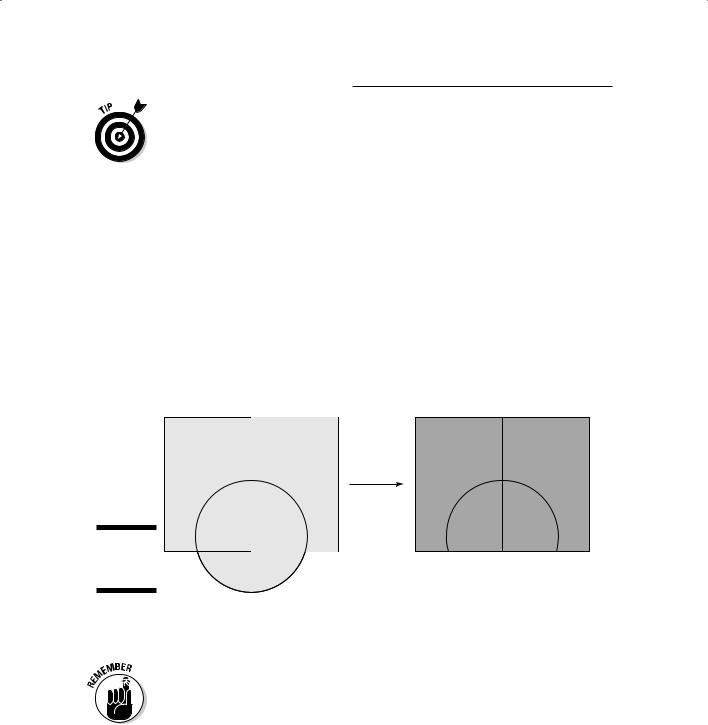
Searching with union overlay
The first form of logical overlay is called union overlay (see Figure 16-3). Union overlay, sometimes called an OR search, collects all the polygons that have any of the attribute search criteria and makes a new map out of them.
246 Part IV: Analyzing Geographic Patterns
So, you might search for all polygons that are classed as agriculture in a landuse map and polygons classed as flat lands in your terrain map. This search returns all lands that are both agriculture and flat. The resulting map would combine these two categories into a larger one. Union overlay maintains the categories from each of the input layers, so you can use them later to perform still more comparisons of flat agricultural land with other layers such as soil nutrient values.
Input |
Output |
Figure 16-3:
Union overlay.
Use union overlay when you want to broaden your search and combine different attributes of your polygons. All the polygons that have any of the search criteria are included in the output.
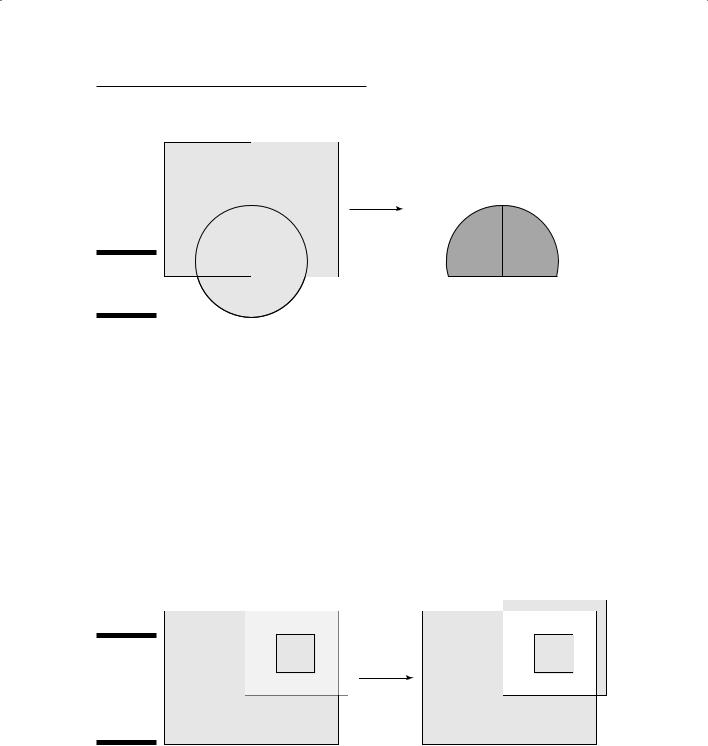
Using intersection overlay
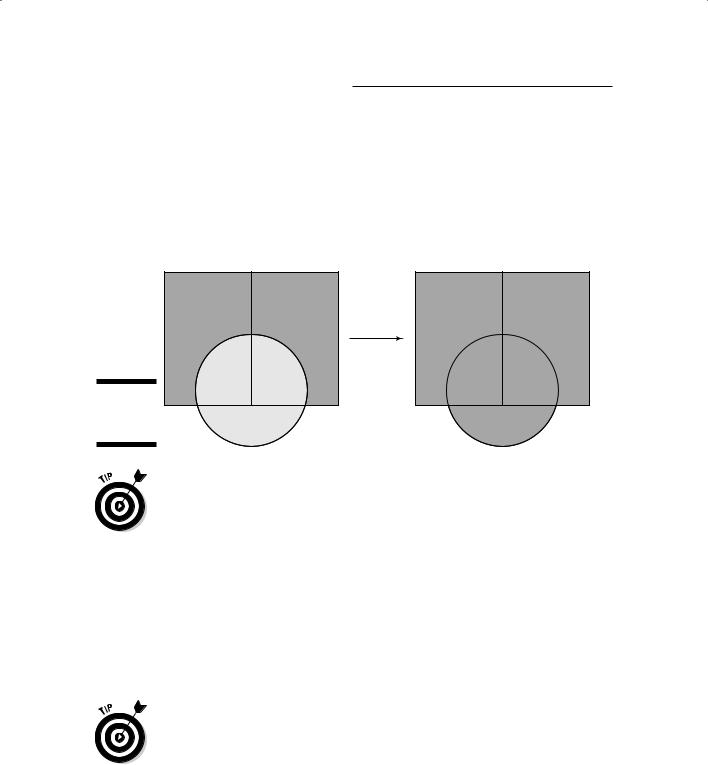
Sometimes, you want to know which polygon features are shared by each of the polygons you’re searching. In other words, instead of combining pieces of land for sale with lands that are agricultural, you only want to know which agricultural lands you can buy. You can get this information by using a logical AND search, which needs both categories to exist before it returns a value to the output map. This search typically reduces the size of the area retrieved, instead of increasing it like union overlay does (see Figure 16-4).
Use intersection overlay when you want to narrow your search to satisfy a number of criteria at the same time. This technique can help you find the most appropriate places for some activity.
Chapter 16: Comparing Multiple Maps 247
Input
Output
Figure 16-4:
Intersection
overlay.
Intersect
feature
Understanding complement or symmetrical difference overlay
Sometimes, when you try to perform a search, you may find it easier to eliminate things that don’t match all your criteria, instead of identifying those that do match. This search, called complement or symmetrical difference overlay, computes the geometric intersections of all polygon types and categories that don’t have certain attributes in common (see Figure 16-5). You might want to do this kind of search if you plan to later perform an analysis that relaxes the criteria you originally established.
Input |
Output |
Figure 16-5:
Complement or symmetrical difference overlay.
248 Part IV: Analyzing Geographic Patterns
Use complement overlay when you want to know what attributes a group of polygons doesn’t share.
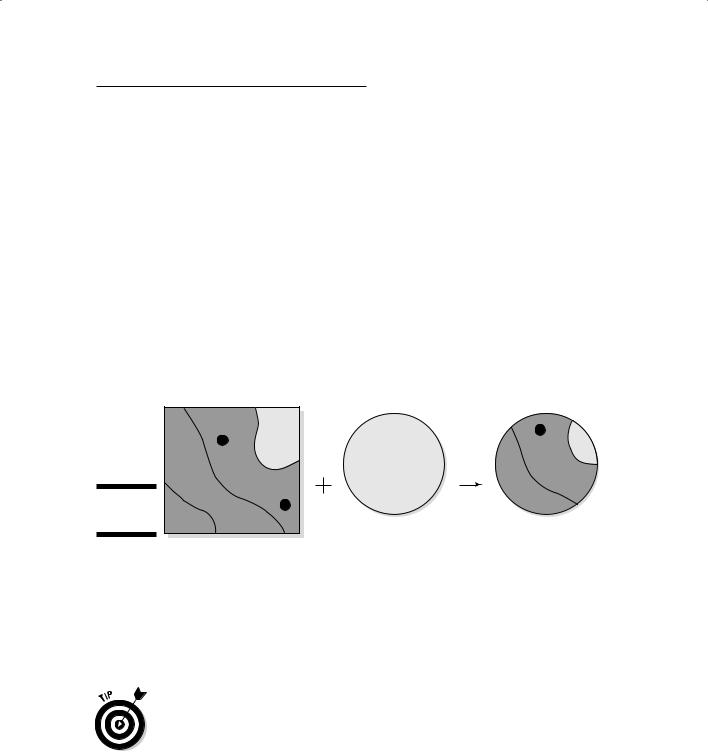
Using identity overlay
Identity overlay is similar to intersection overlay, but it treats the layers differently. One layer, the identity layer, must be composed of polygons because its attributes determine the identity of everything that coincides with it. But for the other input layer, you can use a point layer (such as wells) or a line layer (such as roads) if you want. When your GIS overlays the two layers, the new shape takes on the attributes of the identity layer (as shown in Figure 16-6). In other words, it takes on the identity of that layer. So, you can have complete control over which layer is more important than another, which is a form of cartographic overlay hierarchy (where one layer takes precedence over another for analysis).
Input |
Output |
Figure 16-6:
Identity overlay.
Identity
feature
Use identity overlay when you want to convert intersecting portions of one layer to the attributes of a more important layer. The more important layer is the layer that often controls what values will be assigned to the new polygons, and you usually determine which layer is more important based on what you want to change and what you want to stay the same after overlay.
Chapter 16: Comparing Multiple Maps 249
Comparing geometry with clip overlay
You can use clip overlay to compare the geometries of different areas. You simply clip one portion of a map based on the size and configuration of another (see Figure 16-7). Think of clip overlay a bit like a cookie cutter. You might use this overlay if you want to combine information from a small subportion of your study area with the entire study area. For example, if you’ve done some extensive field research on a small part of a larger forest and want to compare these new data to the original whole-forest layer. Obviously, you need only the small sample area to do your analysis. You don’t want the computer to do all that time-consuming graphics work for parts of the database that you don’t need.
When you use clip overlay, the attributes of the polygon you clip aren’t a factor in determining the size and shape of the resulting layer. Instead, you gather all the information from all layers that you want — but for only a small portion of the map.
Figure 16-7:
Clip overlay.
Input |
Clip feature |
Output |
|
|
I found the clip overlay useful when I was working with a group of researchers studying land-use change during four different time periods. Because we used un-rectified aerial photographs, each of our study areas was slightly different from the others. To fix this discrepancy, we chose the study area that had the smallest footprint (covered the smallest area) as a cookie cutter and clipped all the other layers to match it.
Use the clip overlay when you want two or more layers to have the same geometry (size and shape), which allows you to have all the attributes that you want to evaluate, but for a selected portion of the study area.

250 Part IV: Analyzing Geographic Patterns
Understanding Raster Overlay
You can perform pretty much any overlay operation in either raster or vector GIS. In Chapter 17, I discuss map algebra. Map algebra is primarily a raster GIS modeling language that allows a huge amount of flexibility in comparing one map to another. Raster overlay is not only more powerful than its vector equivalent, but also less troublesome.
Among the more powerful features of raster overlay is that it can compare raster grid layers by mathematical expression, geometry, and statistical measures; and it’s capable of performing a wide variety of operations, including controlling both the search geometry of the overlay and the computational, logical, and statistical methods by which the GIS compares the numbers.
In raster, each grid cell has its own identity. Also, each grid cell’s location is directly aligned to the corresponding grid cells on the other layers (coregistered). So, you don’t have to worry about all your layers being aligned or problems caused by mismatched edges. Raster overlay also eliminates the need to spend time evaluating very small (sliver) polygons to determine whether your GIS created them in error or they really are important.
Use raster overlay when you want to have some serious control over which portions of your map you overlay and what methods you employ.
Comparing Features with
Selective Overlay
Selective overlay is not really a specific type or set of overlay operations — it’s a unique powerful portion of map algebra normally performed in raster GIS. In many situations, you know exactly which features you want to compare to which others. Frequently, you even want to assign specific new categories and/or numbers to such combinations.
I worked with a team in which we used this technique to examine vegetation at different time periods and compare that vegetation to the landforms. We found over ten types of vegetation and ten types of landforms, making the number of possible combinations rather daunting. But daunting or not, we could more easily decide which combinations we really wanted to examine and do this overlay operation at the same time, rather than do each set as a separate set of overlays. Both approaches would work, but the selective
overlay gave us the opportunity to get what we needed in a single operation. It also allowed us to experiment with different sets of combinations quickly.