GIS For Dummies
.pdfChapter 20: GIS in Organizations 311
your organization to define your application needs. So, they have to identify your current goals and products, and determine how GIS might be able to enhance your operations, instill efficiency, and develop better products.
Make getting your existing products set up for GIS automation priority number one. When your organization figures out more about the capabilities of GIS, you begin asking the system to do more. When your needs increase, ask your vendors to help you respond to them.
Analytical model design: Know what analytical techniques you need your GIS to perform. These techniques differ for ecological, economic, military, and any other type of analysis. System designers use their knowledge of the GIS capabilities to guide you through the maze of possibilities.
Database design: Various software packages use different data models. The application design needs and the analytical model needs you define for your GIS work together to determine your database needs. A thorough database design involves everything from formatting and gathering data to devising a complete plan for creating and maintaining your GIS database.
Institutional/system design: When you implement GIS, you need to consider the people in an organization. You need to answer questions regarding personnel, equipment, space, organizational structure, enterprise-wide goals and objectives, and costs and benefits. Costs and benefits, in particular, often determine whether a GIS is even viable.
Most organizations conduct the process of needs assessment with the assistance of outside GIS design consultants. If you already know which software you want to use, these companies can provide design consultants. Many organizations just starting out with GIS prefer to have a system developed from the ground up so that the design document they receive allows them to create an RFP (request for proposals), which gets GIS companies to beg for your business. Using a design document in an RFP often gets you the system that’s right for you, rather than the one that some GIS firm wants to sell you. (See Chapter 23 to find out what questions to ask GIS vendors.)
For some businesses, you can look at your competition to see what systems they use. They may not be forthcoming about the specifics, but the companies that serve them will be quick to let you know that they’re around.
Performing a cost/benefit analysis
You need to assess the costs and benefits of a GIS implementation if the GIS is designed to bring real financial benefits to the organization. Although organizations that don’t generate income from the implementation of GIS
don’t use it as often, they might still be able to justify the expense because of other benefits, such as savings in time and improved product quality.


Chapter 20: GIS in Organizations 313
Government: The benefits to government agencies other than the one actually implementing the GIS. This benefit also applies to partnerships that result in reduced costs or shared resources. Better, more timely products result in greater customer satisfaction and often increase sales.
External: Improvements in the quality and quantity of external factors, perhaps including the impact of the products (for example, you may save a historic site as a result of the output of GIS), improved public perception of your company (the good-neighbor effect), and the regional benefits of increased tourism. These external benefits may be harder to quantify but often have a lasting, long-term positive effect on your company.
Understanding initial versus ongoing analysis
Organizations often consider GIS design when thinking about a new operation or implementation other than what was originally intended. During this consideration period, have systems analysts review your needs; perform all the necessary cost-benefit analyses; and make initial staffing, education, hardware, software, and all the other recommendations to ensure you’re headed in the right direction.
But GIS operations already under way, even those that you design well from the start, can benefit from periodic review and remediation. Systems designers are trained to detect the effects of changes that might reduce the potential of your GIS, keeping it from operating at peak efficiency.
Using Change Detection
You can prevent the slow decay in GIS functionality by putting in place a good system of change detection. Change really is the only constant in the universe — and with the rapid advances in technology, change is only going to happen faster. Most business models assume that the organization is dynamic and subject to change. Hardware, software, and operating systems often change most quickly. But organizations also change. The following sections describe the two major types of change that you need to monitor and adjust to.


Part VI
The Part of Tens

In this part . . .
In some ways, GIS is like a smorgasbord with lots of choices. In this Part of Tens, I offer you a sort of menu
that helps you choose among the GIS software packages with different capabilities and price ranges. You’ll also want someone to serve you, so I provide you with a list of questions you should ask your vendor. Finally, because you must also have data to feed into your GIS, I show you ten sources of spatial data from all over the world — it’s an international smorgasbord!

Chapter 21
Ten GIS Software Vendors
In This Chapter
Getting to know the main GIS vendors
Understanding what the vendors supply
Looking into the system requirements
GIS software vendors are as varied as the data you encounter inside the software. These vendors range from companies that specialize
in industry-specific software (such as Surfer for terrain analysis and CrimeStat for crime analysis), to more generic software companies (such as Environmental Systems Research Institute, Intergraph, and GE Smallworld). With the list of GIS software vendors tipping the scales at “a whole lot” and growing, you may find having a list of ten well-known vendors helpful. For an updated, comprehensive list of GIS vendors, see www.geog.ubc.ca/ courses/klink/resources/gis_vendors.html.
Each of the vendors listed in this chapter has a loyal client base, so it doesn’t hurt to ask folks who use each company for guidance when you’re choosing the company that’s right for you. Most GIS users are more than happy to talk about their experiences.
Environmental Systems
Research Institute
Environmental Systems Research Institute (ESRI, at www.esri.com) boasts the largest market share for GIS and has come by that boast honestly. Although their products have a steep learning curve, the power this software provides is worth the time investment:

318 Part VI: The Part of Tens
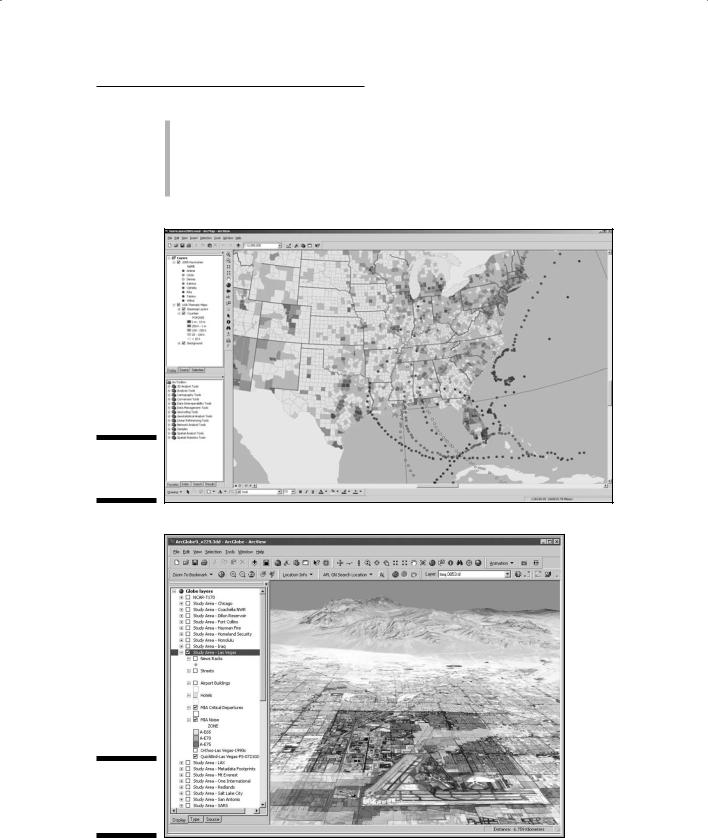
Product line: The primary ESRI product is ArcGIS (shown in Figure 21-1). This product comes in many forms and price lines, including online, server, and desktop versions. It incorporates both vector (polygonal) and raster (grid) data models, and it has a new data model called the geodatabase that’s object oriented and allows database designers to incorporate detailed geographic properties into the geographic features. Other products include Business Analyst, Business Map, Route Map, and many more packages for traditional or Internet delivery and software development. You can download a demonstration version of the ArcGIS software at support.esri.com/downloads/.
One of the ArcGIS extensions, ArcGIS 3D Analyst, has added a new technology for visualizing extremely large three-dimensional geographic data, from local to global perspective. Called ArcGlobe, this product allows the user to interact seamlessly with any geographic data as map layers on a three-dimensional globe (Figure 21-2). Think Google with underlying GIS data to analyze.
Basic tools of the ESRI software include
•Editing tools
•Cartography tools
•Internet mapping and analysis
•On-the-fly map projections
•Large data-format compatibility
•A full suite of spatial analysis tools
•Spatial statistics and visualization
•Coordinate geometry tools
Training opportunities: ESRI provides many forms of training, including instructor-led instruction at its facilities or yours, online courses through its virtual campus, and training modules at its tradeshows and annual user meetings. Through its own publishing house, ESRI provides software documentation, as well as tutorial and training texts. Some of these documents come with educational versions of the software that work for a time and then stop running.
The ESRI Web site includes both educational and research-focused audio podcasts that you can download. For educators, ESRI provides a student version of the software that allows students to become familiar with GIS concepts by using ESRI’s professional products.
Other services: Far more than a GIS software vendor, ESRI provides many consulting opportunities, such as custom implementation and assistance in the design and application of its software. ESRI also provides datasets and support services for your installation and Web hosting for online delivery of GIS analysis and inquiry.
Chapter 21: Ten GIS Software Vendors 319
Platforms: The ESRI GIS software works on Unixand Windows-based machines. The online products require Internet Explorer, Firefox, or other Web browser software to run.
Contact information: Corporate Headquarters: 380 New York St., Redlands, CA 92373-8100. Phone: 909-793-2853. Web: www.esri.com.
Figure 21-1:
Presenting
ArcGIS.
Figure 21-2:
What you
see on
ArcGlobe.