GIS For Dummies
.pdfChapter 17: Map Algebra and Model Building 271
|
I’ve talked to literally hundreds of people who specialize in cartographic mod- |
|
|
eling. Nearly everyone has told me that the key to good cartographic modeling |
|
GIS |
is to formulate the model through the use of flowcharting techniques. They |
|
also tell me that you should normally create the flowcharts even before you |
||
|
||
|
know what’s in your database. Such formulations have helped me decide what |
|
|
should go into the model in the first place. |
Making a formulation flowchart
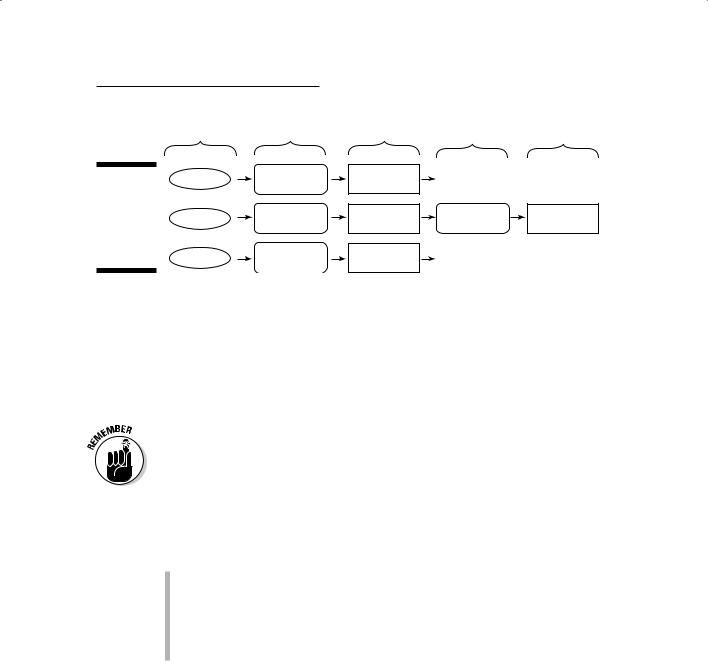
The easiest way to formulate a model is by creating a formulation flowchart — a set of graphics and arrows showing steps in the modeling process. A formulation flowchart starts with the final desired product (the spatial information product), breaks it up into sub-models, and finally outlines the actual map elements that you need. Your software may have built-in flowcharting capabilities, you may have your own flowcharting software, or you can even (hold onto your hat here) use a pencil and paper. (Sometimes, this old pencil-and- paper way is the fastest.)
Suppose that you want to put up some solar panels to generate electricity. You call the map that you want to create solsites, meaning sites where you should place solar panels. You need to make sure that you fulfill three requirements of your solar-panel placement:
Each site must be at least 2 miles from town.
Each site should be on slopes of at least 30 degrees but less than 55 degrees.
The slopes must face south to get as much sun as possible.
Figure 17-13 shows your formulation flowchart.
|
|
|
needed |
|
|
|
final output |
submodel |
operations |
elements |
|
|
|
good |
south |
elevation |
|
|
|
aspect |
aspect |
||
|
|
|
|||
Figure 17-13: |
|
|
slope |
|
|
A for- |
solsites |
good |
elevation |
||
mulation |
slope |
30-55 |
|||
|
|
||||
flowchart |
|
|
|
|
|
for the sol- |
|
good |
dist>2mi |
citylimits |
|
sites model. |
|
||||
|
distance |
||||
|
|
|
|

Chapter 17: Map Algebra and Model Building 273
In Figure 17-13, notice how the final spatial information product on the left (solsites) breaks down into submodels that identify searchable aspects of the GIS data:
Good aspect and good slope: You can derive both of these submodels from manipulations and reclassifications of the same starting map element — topography (essentially, a Digital Elevation Model, or DEM). In this case, you want a south-facing aspect and a slope between 30 and 55 degrees.
Good distance: To determine an area that fits the good distance submodel, you measure 2 miles from the outside perimeter of the City polygon on a map layer containing city limits data.
You use the GIS software to combine the sub-models by using a map overlay operation (discussed in Chapter 16) called intersection, which means that it finds only those areas that include all the elements (2 miles from the city, slopes between 30 and 55 degrees, and a south aspect) for your solsites locations.
This basic model has all the elements that you need to make more complex models. You can break models into smaller pieces, and each of the pieces requires one or more map elements to produce it. And you can use the same map element to create multiple derived maps. Cool, huh?
Basing your database on your flowchart
When you finish a formulation flowchart, you know exactly what map elements you need to create the maps you want. Instead of relying on an existing database, you can make all the decisions about what maps, at what scales, and with what classifications you need to get your answer. You’re not even restricted by whether the maps exist. You’re creating a best-case scenario, and the most effect and most accurate models start with this kind of model-specific data.
Always take the time to develop a formulation flowchart of your cartographic model that includes everything you want to see the model contain without worrying about whether the data are available.
Implementing a Model
Implementing a cartographic model is really just the reverse of formulating it, but with one major difference. You can no longer assume that you have all the best data and all the map elements that you need to do the job. If you assume that you have all the layers at the appropriate scales and classification levels for your solsites model, you simply need to reverse the flowchart so that it moves from basic map element input to the final product (see Figure 17-14).


276 Part IV: Analyzing Geographic Patterns
Assessing whether the model gives adequate results
You need to carefully consider whether the constraints that you put into your model give you adequate results. I’ve run models that attempt to show the most appropriate place to put a planned development only to have the model tell me that the majority of the unoccupied portion of the city will do nicely. If you get this kind of result, you need to rethink your model and tighten the rules and constraints. I also created a model to show the best
location for winter movement of troops, and the output gave me a blank map because I made the constraints too tight. Adjusting model constraints takes finesse; consult the user when you make adjustments so that you don’t violate the spirit or purpose of the model.
Gauging whether your model makes sense
Models must make sense. I can’t tell you how to determine whether a model makes sense because I’m probably not an expert in your particular field or discipline. Use your own background to assess whether the logic is consistent with how your portion of the real world works. To make this determination, you (and often the user) need to be able to interpret the model. Making your cartographic model understandable, you may need to provide ample documentation, make sure that the model employs easy-to-understand functions and operations, include flowcharts, and even keep the model simple and general enough that users can easily figure out its purpose and function.
Ensuring that your model satisfies the user
Most real-world GIS operations employ consulting firms to do their cartographic modeling (although this fact is changing). The users must be satisfied with the model. They might find a really accurate model worthless because
it doesn’t provide the answers that they want or expect, they can’t read or interpret the output (bad map design), the output is in the wrong format (for example, a travel log versus a map), or the GIS doesn’t deliver the model and output on time.
I don’t have any easy answers to potential problems of model-user dissatisfaction, but I do have one suggestion: Make sure that you always keep the lines of communication open with the users. If you keep the users involved throughout the process, they’re much more likely to accept the final product. A correct model is a useful model only if the user accepts it. Keep the user involved in every phase of your GIS work.

Part V
GIS Output and
Application

In this part . . .
AGIS analysis is only as good as its ability to communicate the results to the user. In this part, I show
you how you can use GIS to create traditional map output. Or you might opt for some radically different types of maps (called cartograms), which are sometimes even more effective at communicating your message.
But GIS output isn’t limited to maps; this part also introduces other types of output, including travel directions, lists, tables, animations, and flythroughs — all of which help boost your understanding of how to present the results of your analyses. Finally, this part offers a guide for how you can efficiently incorporate the GIS technology into your organization and take advantage of its transforming power.

Chapter 18
Producing Cartographic Output
In This Chapter
Finding your way around a traditional map
Understanding the usefulness of cartograms
In the past, trained cartographers in cartographic production shops made almost all the maps created. Their products were hard copy maps done
on parchment, paper, Mylar, or other surfaces, depending on the technology of the day. Today, large production shops are still available in government agencies such as the National Geospatial-Intelligence Agency (NGA) or in businesses (such as Rand McNally) that specialize in maps. Many professional cartographers do both production and cartographic design work for GIS companies, as well.
These large shops will likely be around for some time. They can always find a market for large volumes of well-designed maps, ranging from the general reference and atlas maps to content-specific thematic maps. Although the shops have staying power, their role in producing cartographic output is quickly and permanently changing because of the ready availability and rapidly increasing numbers of GIS software users.
When you work with GIS software, you’re the cartographer. Unfortunately, you don’t automatically inherit the training and experience that professional cartographers possess because you own the latest and greatest GIS software. GIS software provides you access to the cartographer’s toolkit, but many of those tools have specialized uses that require instruction and particular conditions under which you can and should use them.
The cartographic product of your GIS work is important. You can do the most elaborate and impressive GIS models in the world, but when you’re done, you need to produce a map that the user accepts and, more importantly, that exactly communicates the analysis.
This chapter shows some basic ideas behind how you can produce good maps. I show you some bad maps and describe how they detract from the quality of your GIS work. The more you work with GIS, the more maps you