

- •VOLUME 4
- •CONTRIBUTOR LIST
- •PREFACE
- •LIST OF ARTICLES
- •ABBREVIATIONS AND ACRONYMS
- •CONVERSION FACTORS AND UNIT SYMBOLS
- •HYDROCEPHALUS, TOOLS FOR DIAGNOSIS AND TREATMENT OF
- •HYPERALIMENTATION.
- •HYPERBARIC MEDICINE
- •HYPERBARIC OXYGENATION
- •HYPERTENSION.
- •HYPERTHERMIA, INTERSTITIAL
- •HYPERTHERMIA, SYSTEMIC
- •HYPERTHERMIA, ULTRASONIC
- •HYPOTHERMIA.
- •IABP.
- •IMAGE INTENSIFIERS AND FLUOROSCOPY
- •IMAGING, CELLULAR.
- •IMAGING DEVICES
- •IMMUNOLOGICALLY SENSITIVE FIELD–EFFECT TRANSISTORS
- •IMMUNOTHERAPY
- •IMPEDANCE PLETHYSMOGRAPHY
- •IMPEDANCE SPECTROSCOPY
- •IMPLANT, COCHLEAR.
- •INCUBATORS, INFANTS
- •INFANT INCUBATORS.
- •INFUSION PUMPS.
- •INTEGRATED CIRCUIT TEMPERATURE SENSOR
- •INTERFERONS.
- •INTERSTITIAL HYPERTHERMIA.
- •INTRAAORTIC BALLOON PUMP
- •INTRACRANIAL PRESSURE MONITORING.
- •INTRAOCULAR LENSES.
- •INTRAOPERATIVE RADIOTHERAPY.
- •INTRAUTERINE DEVICES (IUDS).
- •INTRAUTERINE SURGICAL TECHNIQUES
- •ION-EXCHANGE CHROMATOGRAPHY.
- •IONIZING RADIATION, BIOLOGICAL EFFECTS OF
- •ION-PAIR CHROMATOGRAPHY.
- •ION–SENSITIVE FIELD-EFFECT TRANSISTORS
- •ISFET.
- •JOINTS, BIOMECHANICS OF
- •JOINT REPLACEMENT.
- •LAPARASCOPIC SURGERY.
- •LARYNGEAL PROSTHETIC DEVICES
- •LASER SURGERY.
- •LASERS, IN MEDICINE.
- •LENSES, CONTACT.
- •LENSES, INTRAOCULAR
- •LIFE SUPPORT.
- •LIGAMENT AND TENDON, PROPERTIES OF
- •LINEAR VARIABLE DIFFERENTIAL TRANSFORMERS
- •LITERATURE, MEDICAL PHYSICS.
- •LITHOTRIPSY
- •LIVER TRANSPLANTATION
- •LONG BONE FRACTURE.
- •LUNG MECHANICS.
- •LUNG PHYSIOLOGY.
- •LUNG SOUNDS
- •LVDT.
- •MAGNETIC RESONANCE IMAGING
- •MAGNETOCARDIOGRAPHY.
- •MANOMETRY, ANORECTAL.
- •MANOMETRY, ESOPHAGEAL.
- •MAMMOGRAPHY
- •MATERIALS, BIOCOMPATIBILITY OF.
- •MATERIALS, PHANTOM, IN RADIOLOGY.
- •MATERIALS, POLYMERIC.
- •MATERIALS, POROUS.
- •MEDICAL EDUCATION, COMPUTERS IN
- •MEDICAL ENGINEERING SOCIETIES AND ORGANIZATIONS
- •MEDICAL GAS ANALYZERS
- •MEDICAL PHOTOGRAPHY.
- •MEDICAL PHYSICS LITERATURE
- •MEDICAL RECORDS, COMPUTERS IN
- •MICROARRAYS
- •MICROBIAL DETECTION SYSTEMS
- •MICROBIOREACTORS
- •MICRODIALYSIS SAMPLING
- •MICROFLUIDICS
- •MICROPOWER FOR MEDICAL APPLICATIONS
- •MICROSCOPY AND SPECTROSCOPY, NEAR-FIELD
- •MICROSCOPY, CONFOCAL
- •MICROSCOPY, ELECTRON
- •MICROSCOPY, FLUORESCENCE
- •MICROSCOPY, SCANNING FORCE
- •MICROSCOPY, SCANNING TUNNELING
- •MICROSURGERY
- •MINIMALLY INVASIVE SURGICAL TECHNOLOGY
- •MOBILITY AIDS
- •MODELS, KINETIC.
- •MONITORING IN ANESTHESIA
- •MONITORING, AMBULATORY.
- •MONITORING, FETAL.
- •MONITORING, HEMODYNAMIC
- •MONITORING, INTRACRANIAL PRESSURE
- •MONITORING, NEONATAL.
- •MONITORING, UMBILICAL ARTERY AND VEIN
- •MONOCLONAL ANTIBODIES
- •MOSFET.
- •MUSCLE ELECTRICAL ACTIVITY.
- •MUSCLE TESTING, REHABILITATION AND.
- •MUSCULOSKELETAL DISABILITIES.
576MONITORING, INTRACRANIAL PRESSURE
31.Gibbs NC, Gardner RM. Dynamics of invasive pressure monitoring systems: Clinical and laboratory evaluation. Heart Lung 1988;17:43–51.
32.Gardner RM, Hujcs M. Fundamentals of physiologic monitoring. AACN Clinical Issues Crit Care Nursing 1993;4(1):11–24.
33.Daily EK. Hemodynamic waveform analysis. J Cardiovasc Nurs 2001;15(2):6–22.
34.McGhee H, Bridges EJ. Monitoring arterial blood pressure: What you may not know. Crit Care Nurse 2002;22:60–78.
35.Sander O, et al. Impact of prolonged elevated heart rate on incidence of major cardiac events in critically ill patients with a high risk of cardiac complications. Crit Care Med 2003; 33:81–88.
36.Weissman C, Landesberg G. Vital are the vital signs. Comment/Editorial Crit Care Med 2003;33:241–242.
37.Grogan EL, et al. Volatility: A new vital sign identified using a novel bedside monitoring strategy. J Trauma 2005;58:7–14.
38.Poon KB. Fusing Multiple Heart Rate Signals to Reduce Alarms in Adult the Intensive Care Unit. MS dissatation, University of Utah Department of Medical Informatics, Salt Lake City (UT); May 2005.
39.Gardner RM. Information management hemodynamic monitoring. Semin Anesth 1983;2:287–299.
40.Gardner RM. Computerized management of intensive care patients. MD Comput 1986;3(1):36–51.
41.Shabot MM, Carlton PD, Sadoff S, Nolan-Avila L. Graphical reports and displays for complex ICU data: A new, flexible and configurable method. Comput Methods Programs Biomed 1986;22:111–116.
42.Gardner RM, Huff SM. Computers in the ICU: Why? What? So what? Intl J Clin Monit Comput 1992;9:199–205.
43.Gardner RM, Sittig DF, Clemmer TP. Computer in the ICU: A match meant to be! In: Ayers SM, Grenvik A, Holbrook PR, Shoemaker WC. editors. Textbook of Critical Care Medicine. 3rd ed. Philadelphia: W. B. Saunders;1995: p 1757–1770. chapt. 196.
44.Morris AH. Treatment algorithms and protocolized care. Curr Opin Crit Care 2003;9:236–240.
45.Morris AH. Clinical trial of a weaning protocol. Crit Care 2004;8:207-209.
46.Bria II WF, Shabot MM. The electronic medical record, safety and critical care. Crit Care Clin 2005;21:55–79.
Further Reading
Nichols WW, O’Rourke MF. McDonald’s Blood Flow in Arteries: Theoretical, Experimental and Clinical Principles. 5th ed. Of special note is Chapter 6: Measuring principles of arterial waves pages 132–135. Hodder Arnold; 2005.
Daily EK, Tilkian AG. Hemodynamic Monitoring. In: Tilkian AG, Daily EK, editors. Cardiovascular Procedures: Diagnostic Techniques and Therapeutic Procedures. St. Louis (MO): Mosby; 1986 chapt. 4.
Geddes LA. The Direct and Indirect Measurement of Blood Pressure. Chicago: Year Book Medical Publisher; 1970.
Geddes LA. Handbook of Blood Pressure Measurement. Clifton (NJ): Humana Press; 1991.
Webster JG, editor. Design of Pulse Oximeters. Institute of Physics; 1997.
Webster JG, editor. Medical Instrumentation: Application and Design. 3rd ed. New York: John Wiley & Sons Inc.; 1998.
Tungjitkusolmun S, Heart and Circulation, In: Webster JG, editor. Bioinstrumentation. John Wiley & Sons, Inc.; 2004. Chapt. 8.
Shabot MM, Gardner RM, editors. Decision Support Systems for Critical Care. New York: Springer-Verlag Inc.; 1994.
Gardner RM, Shabot MM. Patient-monitoring systems. In: Shortliffe EH, Cimino JJ, editors. Biomedical Informatics: Computer
Applications in Health Care. 3rd ed. New York: SpringerVerlag; 2005; in press, Aug. 2005. Chapt. 17.
See also BLOOD PRESSURE MEASUREMENT; CARDIAC OUTPUT, FICK TECHNIQUE FOR; CARDIAC OUTPUT, INDICATOR DILUTION MEASUREMENT; CARDIAC OUTPUT, THERMODILUTION MEASUREMENT; ELECTROCARDIOGRAPHY, COMPUTERS IN; HEMODYNAMICS.
MONITORING, INTRACRANIAL PRESSURE
MICHAEL L. DALEY
IAN PIPER
The University of Memphis
Memphis, Tennessee
INTRODUCTION
Intracranial pressure (ICP) monitoring is a form of pressure monitoring used in patients with pathologies that might give rise to raised ICP. The definition of raised ICP depends on the underlying pathology and, for example in adult patients who have sustained a severe head, injury is defined as pressure greater than 20 mm Hg. Over the past 50 years there has been an active and wide ranging research into the causes and consequences of raised ICP that, to date, has been the subject of 11 international symposia embracing such diverse disciplines as neurosurgery, anesthesia, radiology, biophysics, electrical and mechanical engineering, mathematics, and computer science. This article reviews the underlying physiology pertinent to measurement of ICP as well as gives an overview of some of the current technology used to measure ICP. Then, a brief review follows of the clinical literature underlying the case for ICP measurement, with an emphasis on the main clinical condition of patients with a head injury. The last two sections focus on the use of waveform analysis and mathematical modeling techniques to research into mechanisms underlying raised ICP.
PHYSIOLOGY
ICP is the pressure recorded within the tissue (parenchyma) or fluid-filled spaces and is not uniformly distributed within the craniospinal axis. The craniospinal axis consists of all neural tissue and contiguous fluid-filled spaces within the cranium and spinal sac. The central neural tissue is encapsulated within bone and three-layered tissue coverings or meninges. From outside in the meninges are the dura, arachnoid, and pia membranes. The meninges provide a physical barrier between neural tissue and the external environment but also serve both a structural and a physiological function as an architecture for supporting cerebral vessels and maintaining a space for flow of cerebrospinal fluid (CSF). CSF cushions the delicate neural tissues, supports the weight of the brain, and acts as a transport media for nutrients, chemical messengers, and waste products. Except at the choroid plexus, the CSF is freely permeable
to the appendymal lining and is in chemical communication with the interstitial fluid and the CNS. ICP is a reflection of the relationship between alterations in craniospinal volume and the ability of the craniospinal axis to accommodate added volume. The craniospinal axis is essentially a partially closed box with container properties including both viscous and elastic elements. The elastic or, its inverse, the compliant properties of the container will determine what added volume can be absorbed before ICP begins to rise. So an understanding of raised ICP encompasses an analysis of both intracranial volume and craniospinal compliance.
The history of the subject of ICP has been well reviewed (1,2) and starts from the doctrine named after Monro (3) and Kellie (4), which proposed that the brain and its contained blood were incompressible, enclosed in a rigid and inextensible skull, of which the total volume remained constant. In its original form, the Monro–Kellie doctrine did not take into account the CSF as a component of the cranial compartment. The concept of reciprocal volume changes between blood and CSF was introduced in 1846 by Burrows and later extended in the early twentieth century by Weed et al. (5,6) to allow for reciprocal changes in all craniospinal constituents. Kocher (7) in 1901 translated into clinical terms the four stages of cerebral compression proposed almost 25 years earlier by the experimental studies of Duret (8). Kocher described four stages of cerebral compression related to the expansion of intracranial brain tumours. In stage 1, the initial increase in tumor volume is compensated by a reduction in volume of the other intracranial components, chiefly CSF and venous blood. This spatial compensation results in no net increase in intracranial volume or pressure and hence no clinical symptoms. In stage 2, the compensatory mechanisms are exhausted, ICP increases, and the patient becomes drowsy with a headache. Stage 3 is characterized by a considerable increase in ICP, an associated deterioration in conscious level, and intermittent elevations of blood pressure (BP) accompanied by bradycardia. In the fourth and final stage, the patient is unconscious, with bilateral fixed dilated pupils and falling BP usually leading to death.
Cushing (9–11), then a research worker for Kocher, described in both experimental and clinical studies the close relationship between increases in ICP and BP and proposed that the BP rose to maintain adequate blood supply to the hind brain, the stimulus to this vasopressor response believed to be medullary ischemia (12,13). At about this time, a false confidence developed in the lumbar CSF pressure technique (lumbar puncture), which caused Cushing’s findings to be challenged. Reports emerged (14–16) that some patients showing clinical signs of brain compression had normal lumbar CSF pressures and that in other patients elevations in BP were found at times when ICP was well below the level of BP.
Partly because of this apparent dissociation between ICP and clinical symptoms, emphasis switched away from ICP measurement toward the relationship between craniospinal volume and pressure, particularly the importance of the elastic properties of the craniospinal system. The relationship between ICP and intracranial volume is often described graphically by an exponential function that is relatively flat at low ICPs but rises rapidly as pressure
MONITORING, INTRACRANIAL PRESSURE |
577 |
increases much above 20 mm Hg. Under normal conditions, at the low ICP end of this curve, compliance (the ratio of added volume to pressure) is high. When the patient’s volume–pressure status changes to move further up the curve, compliance will fall rapidly. Measurement of craniospinal compliance in brain-injured patients may, therefore, offer the potential for early detection of raised ICP before it rises to levels damaging to brain parenchyma. The most commonly used methods of measuring craniospinal compliance were developed by Marmarou (17,18) and depend on the rapid injection of known volumes of fluid into the CSF space with immediate measurement of the resultant increase in CSF pressure. One of these methods is the pressure volume index (PVI); this value being the volume that when added to the CSF space would produce a tenfold rise in ICP. Miller et al. (19,20) defined a further measure of the craniospinal volume–pressure relationship, the volume pressure response (VPR). The VPR, also calculated from the ICP response resulting from a rapid bolus injection of saline into the CSF space, is a direct measure of the inverse of compliance: elastance. Although both are measures of compliance, some confusion remains as to what exactly is the difference between the VPR and the PVI. The PVI, which assumes a mono-exponential pressure versus volume relationship, is a single index that characterizes the patient’s entire volume–pressure relationship and is, numerically, a measure of the slope of the logarithm of the ICP versus intracranial volume relationship. Its strength lies in its ability to define the whole volume– pressure status of the patient with a single index. It was the late J. Douglas Miller who pointed out that if there was only a single volume–pressure curve, then no new information would be gained by measuring compliance or elastance, and a knowledge of absolute ICP alone would suffice in determining the state of a patient’s craniospinal volume decompensation. However, several studies (21,22) have shown that the shape of the volume–pressure relationship changes under a variety of conditions both between patients and within patients at different times. Under these circumstances, it is likely that the PVI will provide the more useful information. One weakness of the PVI is that if a patient’s pressure–volume relationship remains stable, single measurements will not detect movement along a given pressure–volume curve and thus may not detect slow increases in volume of a space-occupying lesion before it causes significant increases in ICP. It is in this situation where a continuous measure of absolute compliance (or its inverse: elastance as measured by the VPR) provides, potentially, more useful information. It is for this reason that, in head-injured patients, Miller et al. found that the VPR correlated better to the degree of brain mid-line shift, as imaged on CT scan, than it did to absolute ICP alone. They subsequently demonstrated that the VPR could serve as an indicator for surgical decompression, critical levels being between 3 and 5 mm Hg/mL (19,23). However, in clinical practice, both circumstances (movement along the pressure–volume curve and shift of the curve along the pressure axis) may occur within a patient at different times and thus shows the need for ICP monitoring capable of both continuous compliance measurement and derivation of the PVI.
578 MONITORING, INTRACRANIAL PRESSURE
Few clinicians would argue over the theoretical utility of monitoring compliance in brain-injured patients; what has limited its use in practice has been the inherent problems associated with manual volume–pressure testing. It is difficult to inject equal volumes of fluid manually at a constant and rapid rate of injection. As a result, repeated measures are usually required that can result in a lengthy and time-consuming procedure. Also, even with stringent maintenance of the sterile procedure, repeated addition or removal of CSF from patients carries an increased risk of infection to the patient. Despite the reported benefits of compliance measurement, it has been largely these limitations that have prevented widespread adoption of compliance measurement in clinical practice.
It was not until the 1960s when Lundberg (24) published his now classic monograph that interest in clinical ICP measurement was rekindled. Using ventricular fluid pressure recording in brain tumor patients, Lundberg was the first to delineate the frequency with which raised ICP occurs clinically, at times reaching pressures as high as 100 mm Hg. Lundberg also described three types of spontaneous pressure wave fluctuations: ‘‘A’’ waves or plateau waves of large amplitude (50–100 mm Hg) with a variable duration (5–20 min), ‘‘B’’ waves that are smaller (up to 50 mm Hg), and sharper waves with a dominant frequency of 0.5–2 cycles per min.
DEVICES
ICP was first measured experimentally in animals by Baylis (25) in 1897 using an early form of strain gauge. The most common form of strain gauge use specially prepared alloys that change their resistance in proportion to the amount they are elongated or stretched in cross section due to applied strain.
The Wheatstone Bridge and the Strain Gauge
Most common strain gauge transducers are used in a Wheatstone Bridge configuration, where the resistive strain elements are placed on diagonally opposite arms of the bridge. Should the strain gauge change its resistance (for example, due to an applied strain—perhaps caused by a pressure acting on the strain gauge to cause it to elongate), then the bridge will become unbalanced and a potential difference will be generated in proportion to the degree of strain.
Fluid-Filled Catheter Transducer Systems
The standard intraventricular catheter connected to an external strain gauge transducer is called a cathetertransducer system because it behaves, in many ways, like a mechanical system with a mass of fluid that acts against the spring-like ‘‘elastic’’ properties of the catheter walls and the transducer diaphragm. A typical catheter-trans- ducer system is one used for the measurement of arterial pressure comprising a silicon strain gauge, fluid-filled catheter, three-way tap, and an arterial cannulae. Modern transducers are semiconductor fabricated and normally disposable. If a flushing device is attached to the transdu-
cer, extreme care must be used to avoid accidental flushing into the cranium. The older catheter-transducer system included long tubing and therefore had different frequency characteristics than modern transducers. The older transducer first found widespread use in the 1960s and 1970s following the pioneering work on long-term ICP monitoring by Nils Lundberg (24). Most publications in this field still refer to intraventricular monitoring as the ‘‘Gold-Standard’’ method of measuring ICP for several reasons. First, this method allows checking for zero and sensitivity drift of the measurement system in vivo. Second, pressure measurement within the CSF space transduces pressure within a medium that is an incompressible fluid and, provided CSF flow is not blocked, is not subject to the development of intracompartmental pressure gradients. Finally, access to the CSF space provides a method for ICP treatment via CSF drainage. However, concerns are often expressed about the increased risks of infection associated with ventriculostomy. Although a range of infection rates has been reported, some as high as 40% (26), recent reports confirm infection rates to be in the region of 1%, which is not considered a prohibitive risk (27).
The Head Injury Management Guidelines published by the Brain Trauma Foundation in 1994 recommend intraventricular ICP measurement as the first-line approach to monitoring ICP. They state that ‘‘A ventricular catheter connected to an external strain gauge transducer or catheter tip pressure transducer device is the most accurate and reliable method of monitoring ICP and enables therapeutic CSF drainage. Clinically significant infections or haemorrhage associated with ICP devices causing patient morbidity are rare and should not deter the decision to monitor ICP’’ (28). Despite the existence of these guidelines (27,28), catheter-tip intraparenchymal pressure monitoring remains popular, particularly in the United Kingdom, as it does not require catheter placement in the operating theater and thus carries significantly lower resource implications. However, the routine use of fluid-filled cathetertransducer systems is not without difficulties. A cathetertransducer system can be described as a second-order mechanical system and, if under-damped, will oscillate at its own natural frequency producing significant amplitude and phase distortion of the pressure signal. The degree of distortion will depend on the damping factor (b) of the system. For most purposes, a damping factor of 0.64 is optimal as the amplitude error will be less than 2% for up to two thirds of the natural frequency of the system (29). Typically, most pressure catheter-transducer systems used in patients tend to be under-damped with a damping factor (b) less than 0.4 (29,30). Manipulating a catheter-transducer system from under-damped (b < 0.3) to over-damped (b >0.8) can cause a decrease in mean pressure of 7 mm Hg. Commercial devices are available, however, such as the acudynamic adjustable damping device (31) that can alter the damping characteristics of external strain gauge pressure transducers and bring them within the range of optimal damping. Another problem with fluid-filled catheter-transducer systems is correcting for the presence of hydrostatic pressure gradients when measuring cerebral perfusion pressure (CPP). Typically, the external strain gauge transducer is zeroed at the same
level as the arterial pressure (BP) transducer, usually at the level of the right atrium. Although the patient is managed in the horizontal position, there is no column of fluid between the site of ICP and BP measurement. However, when the patient is managed with head-up tilt and if the BP transducer is not moved to the same horizontal level as the head, a hydrostatic fluid column will be created. This can produce a significant error between the observed CPP and the actual CPP, which, in the worst case, can produce an error of as much as 15 mm Hg.
The Spiegelberg ICP monitoring system (Spiegelberg KG, Homburg, Germany) largely overcomes these problems. This system is a special case of a fluid-filled cathe- ter-transducer system. With this device, ICP is measured using a catheter with an air pouch balloon situated at the tip. By maintaining a constant known volume within the air pouch, the pressure within the air pouch balloon is equivalent to the surrounding pressure or ICP. The internal air pouch balloon is transduced by an external strain gauge transducer, and because the fluid used for pressure transduction is air, the pressure error caused by an ‘‘air column’’ is clinically insignificant. The design of this device also allows automatic in vivo zeroing of the ICP system and, in laboratory bench tests, showed the least zero drift in comparison with standard catheter-tip ICP devices (32). This system now has versions for use in epidural, subdural, intraparenchymal, and intraventricular sites. The intraventricular catheter is a double lumen catheter that allows access to the CSF space for drainage. The Spiegelberg system, although having many attractive features, is, as yet, a relatively little used system outside of Germany and its longterm clinical utility and robustness require evaluation.
Catheter-Tip Transducer Systems
Now several catheter-tip ICP monitoring systems are available, including the Camino (33–36) systems. The Gaeltec ICP/B solid-state miniature ICP transducers, for useinthe epidural space, are reusable, and the zero reference can be checked in vivo. However, reports of measurement artifacts (37) and decay in measurement quality associated with repeated use (35) have limited the widespread adoption of this technology.
The InnerSpace OPX 100 system (InnerSpace Medical, Irvine, CA) is, like the Camino system, a fiber optic system. Bench test reports on this system show it to have good zero drift and sensitivity stability (32). However, a recent clinical evaluation of this system in 51 patients reported a high (17%) incidence of hematoma formation around the ICP sensor (36). The authors concluded that improved fixation of the catheter is required to minimize micro-movements.
The two catheter-tip systems most frequently used in the management of head-injured patients are the Codman and Camino systems. Neither allows a pressure calibration to be performed in vivo. After these systems are ‘‘zeroed,’’ relative to atmospheric pressure during a pre-insertion calibration, their pressure output is dependent on zero drift of the sensor. For this reason, it is critical that these devices exhibit good long-term zero drift characteristics. These devices provide an electrical calibration, to calibrate external monitors, but they cannot be corrected for inher-
MONITORING, INTRACRANIAL PRESSURE |
579 |
ent zero drift of the catheter once placed. For the Camino system, the manufacturers specify the zero drift of the catheter to be 2 mm Hg for the first day and 1 mm Hg per day thereafter. Czosnyka et al. (32) have confirmed these zero drift findings in bench tests studies although they also reported that the temperature drift of the device was significant (0.3 mm Hg/8C). They reported that if the manufacturers specify the zero drift of the catheter to be 2 mm Hg for the first day and 1 mm Hg per day thereafter. In clinical practice, the reported zero drift upon removal of the Camino device from the patient has been reported to be greater than the manufacturer’s specifications. Munch (38) assessed 136 Camino sensors in a clinical study and found an average daily drift rate of 3.2 mm Hg. Chambers (39), in a comparative study of the Camino ventricular catheter with an external fluid-filled cathetertransducer system, reported that only 60% of the readings were within 2 mm Hg of the gold-standard method. There are also reports of Camino probe failure because of technical complications (cable kinking, probe dislocation), with reported failure rates ranging from 10% to 25% (39,40).
The Codman transducer is a micro-miniature strain gauge within a titanium housing side mounted at the tip of a catheter. Similar to other transducers, bench test reports on this technology have been favorable (32,41). However, clinical evaluations have reported the presence of inter-patient and intra-patient biases that are independent on whether the device is compared against the Camino transducer or an intraventricular catheter-trans- ducer system (42). A report by Fernades (43) found that in 24% of the recordings, the Codman sensor over-read the Camino system by 5 mm Hg or more.
The Rehau System
The technology of miniaturization is allowing the development of catheter-tip pressure sensors. Catheter-tip systems, due to their small diameter, are likely to cause less damage to tissue upon placement than larger fluidfilled catheters and are not affected by hydrostatic pressure differences. However, they are potentially more prone to problems of robustness and in vivo zero drift. Several similar technologies, although performing well in bench test studies, have been shown to exhibit unacceptable zero drift, fragility, or both during trials conducted under clinical conditions (38,43–45). In vivo drift is especially important in catheter-tip strain-gauge technology as it is impossible to check if the calibration has altered after being placed in the patient. Until recently, to reduce the physical size of the catheter-tip strain gauge catheters, often only a partial Wheatstone bridge is employed at the catheter-tip. Recently, a new technology has become available, the Neurovent-P (REHAU AGþCO, REHAU, Germany), in which a full Wheatstone bridge is fabricated in the probe tip, and this solution should, in theory, provide improved zero drift characteristics. One potential advantage of the Rehau NeuroVent system seems to be the incorporation of a full Wheatstone bridge into the catheter-tip electronics. This Wheatstone technological improvement should enhance the zero drift characteristics by reducing temperature sensitivity and the effects of non-pressure-related external
580 MONITORING, INTRACRANIAL PRESSURE
strains. Until recently, this approach was only possible in the much physically larger external strain gauge systems. Through advances in miniaturization technology, it has now been able to incorporate this technology into its catheter-tip systems. In the bench studies performed (46), each catheter was tested for days, from a minimum of 3 to more than 8 days. This timeframe typically covers the period in which an ICP transducer is used in the clinical setting. The results from this bench test study confirm the manufacture’s claim that pre-insertion calibration is not required as the drift was within manufacture’s specifications ( 1 mm Hg). This advantage is very important in the clinical arena because the first pre-insertion zeroing is a crucial step conducted by the surgeons and potentially, if incorrectly performed, could generate erroneous readings during the period of monitoring. Both long-term zero drift and the dynamic pressure test results also confirm that this system performs well in bench test studies and meets manufacturer’s specifications. Mean zero drift, after 5 days, was very small and long-term continuous recording of a stable pressure was precise. The response to dynamic tests, i.e., the changes of pressure over a wide range, was excellent. The average bias of the Rehau catheter compared with a hydrostatic pressure column is very small. Despite these promising bench test study results, further work is required to determine the performance of this measurement device in the clinical environment. Following on from these bench tests, the next and most critical step will be to conduct a trial of this promising technology under the more demanding clinical environment. The BrainIT group (http://www.brainit.org) as a multicenter collaborative group of neurointensive care scientists and clinicians are well placed to design and conduct such a trial (47). Should this technology demonstrate, under clinical conditions, the required robustness and low drift as indicated by these bench test studies, it may lead to more precise and reliable measurement of ICP.
CLINICAL LITERATURE
Raised ICP has been found to be associated with a poorer outcome from injury with the higher the level of ICP, particularly the peak ICP level, which has been found to correlate with the expected prognosis for mortality and morbidity (48–51). There has, however, been controversy over the usefulness of monitoring raised ICP with some groups, with a ‘‘no ICP monitoring’’ policy, finding in their studies of head injury mortality and morbidity that outcome is similar to other groups that do monitor ICP (52). Reported differences in the utility of ICP monitoring could be due to variability both in management and in monitoring protocols between different neurosurgical centers. Variation in type of ICP pressure monitor, site of placement, treatment thresholds, patient referral characteristics, and in outcome measures can all combine to produce a large variability both in measured ICP and in outcome irrespective of whether ICP is monitored or how it is treated. Another source of variation in terms of raised ICP is the inherent variability of the head-injured population with outcome being dependant on several other factors. For
example, mass lesions are generally accompanied by elevations in ICP of greater than 40 mm Hg and are associated with poorer outcome, whereas diffuse injuries tend to have lower ICP levels associated with a similar poor outcome (50,53). Age is also an important factor with an age-depen- dent distribution of ICP for both type of injury and outcome. This is particularly so for pediatric cases (54–56). ICP can even be raised in the absence of overt signs of swelling or mass lesions on CT. In a small study of severely head-injured patients, O’Sullivan (57) demonstrated that some comatose head-injured patients whose initial CT scan was normal, with no mass lesion, midline shift, or abnormal basal cisterns, developed raised ICP greater than 20 mm Hg that lasted longer than 5 min. This included a subset of patients showing pronounced raised ICP of greater than 30 mm Hg.
Data from large prospective trials carried out from single centers and from well-controlled multicenter studies have provided the most convincing evidence for a direct relationship between ICP and outcome (58–61). Narayan et al. (58) in a prospective study in 133 severely head-injured patients demonstrated that the outcome prediction rate was increased when the standard clinical data such as age, Glasgow Coma Score on admission (GCS), and pupillary response with extraocular and motor activity was combined with ICP monitoring data. Marmarou et al. (60), reporting on 428 patients’ data from the National Institute of Health’s Traumatic Coma Data Bank, showed that following the usual clinical signs of age, admission motor score, and abnormal pupils, the proportion of hourly ICP recordings greater than 20 mm Hg was the next most significant predictor of outcome. Outcome was classified by the Glasgow Outcome Score (GOS) at 6 months follow-up. They also found, using step-wise logistic regression, that after ICP, arterial pressure below 80 mm Hg was also a significant predictor of outcome. Jones et al. (61) studied prospectively 124 adult head-injured patients during intensive care using a computerized data collection system capable of minute by minute monitoring of up to 14 clinically indicated physiological variables. They found that ICP, above 30 mm Hg, arterial pressure below 90 mm Hg, and cerebral perfusion pressure below 50 mm Hg significantly affected patient morbidity.
Although differing opinions remain about the contribution of continuous monitoring of ICP to reduction in mortality and morbidity after head injury, there is now sufficient evidence to remove doubt about the value of ICP monitoring toward improving the detection and preventative management of secondary cerebral injury.
Raised Intracranial Pressure: Relationship to Primary and Secondary Injury
Both experimental and clinical studies have clearly shown that after traumatic brain injury, normal physiological mechanisms for maintaining cerebral perfusion can become impaired (62–65). These studies demonstrate that brain injury can cause impairment or loss of autoregulation defined as the ability of the cerebral vessels to respond to changes, in arterial gases or to arterial pressure. As a result of these changes, there can, at times, be a decrease
in cerebrovascular resistance that can lead to raised ICP in both adults and children (66–70). Although brain-injured patients are being managed in intensive care, there are, superimposed on to the primary injury, periods of reduced arterial PO2 or episodes of arterial hypotension often as a result of other injuries or treatment by hypnotic drugs (50,53,60,61,71,72). With an impaired physiological mechanism unable to respond adequately to these adverse changes in physiological parameters (or ‘‘secondary insults’’), ischemic brain damage can occur. These secondary, chiefly ischemic brain insults are common, with Graham et al. (74) reporting, in a series of 151 fatal cases of severe head injury, a 91% incidence of ischemic brain damage found on autopsy. A second study carried out by the same group over 10 years later found a similar high incidence (>80%) of ischemic brain damage despite subsequent improvements in intensive care of head-injured patients (74).
There has been much interest in the relationship among ICP, CPP, and CBF. The landmark study of Miller and Garibi (75) produced some of the first experimental evidence confirming the concept that changes in ICP affect cerebral blood flow not directly but through changes in CPP, where CPP is defined as the difference between mean arterial pressure and ICP. Strictly speaking, the actual cerebral perfusion outflow pressure would be cerebral venous pressure, although this pressure is, in most situations, impractical to measure routinely. However, it has been established that over a wide range of pressures cerebral venous pressure is well approximated (within 3–4 mm Hg) by ICP (76–78). In an experimental study of CBF as determined by the venous outflow technique in dogs, Miller and Garibi (75) also demonstrated that when MAP and ICP rise in parallel so that CPP remains constant at 60 mm Hg, CBF increases with MAP in animals found to be non-autoregulating. It was further shown that as CPP drops in autoregulating animals, the breakpoint at which CBF starts to decrease is at a higher level if CPP is reduced through hemorrhagic arterial hypotension than through intracranial hypertension. This work suggests that cerebral perfusion is more sensitive to arterial hypotension than to intracranial hypertension.
The clinical significance of this information is that in the management of head injury, it is often necessary to employ therapy to lower raised ICP. Therapeutic agents for reducing raised ICP often do so at the expense of reduced MAP, and as a consequence, CPP may not improve. If autoregulation is preserved, CBF should remain unchanged despite parallel changes in MAP and ICP. However, clinically, autoregulation is likely to be impaired in those conditions in which ICP is increased such as head injury or subarachnoid hemorrhage (68,69,79–82). Under these circumstances, it is important that reduction in ICP should not be achieved at the expense of lowering CBF and provoking brain ischemia.
This earlier work of Miller and Garibi was later extended by Chan et al. (83) to include CPP ranges of 60, 50, and 40 mm Hg. At CPP levels of 50 and 60 mm Hg, when autoregulation was intact, CBF remained unchanged. However, with loss of autoregulation, there was a trend for CBF to increase as MAP and ICP were
MONITORING, INTRACRANIAL PRESSURE |
581 |
increased in parallel at a CPP of 50 and 60 mm Hg. Absolute CBF levels were significantly different between the autoregulating and non-autoregulating groups. At a CPP of 40 mm Hg CBF showed a linear correlation with BP. This work demonstrates that when autoregulation is impaired, there is a functional difference between autoregulating and non-autoregulating cerebral vessels despite similar MAP and CPP, and that when autoregulation is impaired, CBF depends more on arterial driving pressure than on cerebral perfusion pressure.
The importance of arterial pressure as the prime factor governing CPP-related secondary insults has been well demonstrated by the work of Jones et al. (61), where they carried out a prospective study over 4 years of the frequency and severity with which secondary insults occur to head-injured patients while being managed in intensive care. They developed a microcomputer-based data collection system that allows the acquisition of data from up to 15 monitored variables minute by minute (84). At each bed space, data collection was under the control of a microcomputer where serial links between the patient monitors and the microcomputer allow the controlled transfer of multiple channels of physiological data once per minute. The controlling software allowed medical staff to add comments to the current active computer file at any time, precisely annotating significant events. The software performs artifact detection, calculates derived data, and highlights valid data that falls outside normal physiological levels. Collected data were stored to disk and could be printed either locally or remotely. Later work by Chambers et al. (85) found that both raised ICP and lowered ABP are major factors in producing secondary insults.
From the valid physiological data produced, manual processing of data was used to identify secondary insults that are defined at one of three grades of severity and that must last for 5 min or longer to be recorded as an insult. This permits calculation of the frequency, severity, and total duration of insults, measured in minutes.
An analysis was made of 124 adult head-injured patients who were monitored during intensive care using the computerized data collection system. Information was logged at 1 min intervals and scanned to identify insults when values fell outside threshold limits for 5 min or longer. Three grades of insult were defined for each variable (Table 1). The duration of insults has been analyzed in relation to the GOS of these patients at 12 months after injury. The monitored patients included 68 with severe head injury (GCS 8 or less with no eye opening), 36 with moderate head injury (GCS 9–12), and 20 with minor head injury (GCS 13–15 but with multiple injuries, scoring 16 or more on the Injury Severity Scale).
Insults were found in 91% of patients at all degrees of severity of head injury. Overall, 10% of patients had insults that were only at the lowest grade 1 level, 31% had insults at both grade 1 and grade 2 levels, and 50% of patients had at least one insult at grade 3 level in addition to grades 1 and 2 insults. Overall, the majority (77%) of all insults detected in the ITU were at grade 1 level, and these represented 85% of the total duration in minutes of insult measured. Differences in the duration of insult between outcome groups 12 months post-injury were compared with
582 MONITORING, INTRACRANIAL PRESSURE
each grade of insult using Kruskall–Wallis one-way analysis of variance and Mann–Whitney U tests. Significant differences in the distribution of hypotensive insults were found between the outcome grades at all levels of severity of insult. Similar results were found for cerebral perfusion pressure insult duration. These data confirm the important adverse effect of even moderate reductions in arterial pressure (systolic BP less than 90 mm Hg or mean BP less than 70 mm Hg).
Although the occurrence and clinical significance of severe and long-lasting secondary insults in head-injured patients is not disputed. The incidence, severity, and duration of shorter acting ‘‘minute by minute’’ cerebral perfusion pressure insults, as defined by the Edinburgh secondary insult detection methodology, has not been defined outside of the Edinburgh study population. In addition, the strong association between the occurrence of specific insult types and the subsequent patient morbidity and mortality found by the Edinburgh study (61) needs to be reproduced in other centers. From the Edinburgh group, Signorini et al. (86,87) developed and validated a model for predicting survival in head-injured patients based on collection of simple demographic features. When the minute by minute secondary insult data were added to the baseline model, they found only ICP insults significantly improved the fit of the model.
Almost all of the evidence for a CPP management is based on single-center cohort studies, often compared with historical controls. For example, Rosner and Becker (26) reported on clinical results of a CPP management protocol where approximately 40% of patients received vasopressor support. They reported a greatly improved incidence of favorable outcome in patients’ GCS 7 compared with historical controls. Despite evidence from single-center studies as described above, a critique of the literature for the purposes of defining head injury management guidelines published by the Brain Trauma Foundation in 1994 states that there is not sufficient evidence to establish either a standard or a guideline for the management of CPP; however they indicate management of CPP greater than 70 mm Hg as a management option (28). Since then, Robertson et al. (88) performed one of the first randomized controlled single-center trials of the CPP management approach. They defined two management cohorts, one based on their normal practice of CPP management and the other CBF, guided practice that included the aggressive management of CPP above 70 mm Hg, together with restricted use of significant hyperventilation. Conversely, their trial has shown that aggressive management of CPP >70 mm Hg, although reducing the incidence of jugular venous desaturation < 50%, demonstrated no difference in neurological outcome possibly due to the increased incidence of acute respiratory distress syndrome in the CBF management group. Thus, secondary insults are common, result in mainly ischemic brain damage, and are a major contribution to disablement. Moreover Chambers et al. (89) has reported that the critical CPP thresholds for insults of pediatric patients varies with age. For both adult and pediatric patients, insults are important because they are common and yet so potentially avoidable. Clearly a critical challenge facing us is to develop patient monitoring
systems and protocols that will lead to rapid detection and resolution of secondary insults. However, detection is not enough; we need also improved and clinically proven methods of treating secondary insults—further evidence is required. In Signorini et al.’s article (87), they conclude that the questions posed by such observational studies can only be answered definitively within the context of a randomized clinical trial. However, to design such a multicenter randomized clinical trial will require improved standards in the monitoring and analysis of secondary insult data. In Europe, improved standards for highresolution collection and analysis of multicenter data from head-injured data is now being addressed by the Brain-IT group (90). The Brain-IT group (http://www.brainit.org) is an open consortium of clinicians and basic scientists working toward improving the infrastructure for conducting both observational and controlled trials of medical devices and patient management.
INTRACRANIAL PRESSURE ANALYSIS METHODS
Since the early 1990s, clinical monitoring of ICP has generally become part of the intensive care management of patients with brain injury. Several methods of analysis have been designed to extract pathophysiological information from the ICP and the corresponding ABP recordings. As noted, one particular computation used in clinical practice is the determination of mean CPP, the pressure across the brain. CPP is calculated as the difference between mean ABP and mean ICP and is based on the assumption that cerebral venous pressure is approximately equal to ICP. CPP is a useful parameter because it provides some insight as to whether the blood flow though brain capillaries is regulated. In the uninjured brain, cerebral blood flow is regulated to match the metabolic demand of the brain cells. Regulation of flow is primarily done by active dilation and constriction of cerebral arterioles in response to changes of CPP and/or biochemical vasoconstrictive or vasodilator agents that interact with the vascular endothelium. The steady-state relationship between cerebral blood flow and CPP is termed static pressure regulation and is illustrated by the graphical relationship between cerebral blood flow and CPP shown in Fig. 1.
In the steady state, cerebral blood flow is laminar and computed as the ratio of CPP to hemodynamic resistance, which is inversely proportional to the fourth power of the radius of the vessel. In the autoregulatory range, the arterial–arteriolar bed actively adjusts the resistance of its vessels by dilating when CPP decreases and constricting when CPP increases to maintain a relatively constant cerebral blood flow during changes in CPP. When CPP is below the lower limit of the autoregulatory range, vessels within the arterial–arteriolar bed tend to passively vasoconstrict. When CPP is above the upper limit of autoregulation, passive vasodilation occurs. One proposed intensive care therapeutic procedure designed to prevent secondary complications during recovery is CPP-oriented therapy (91). This therapy requires pressure autoregulation and the ability to manipulate CPP within the autoregulatory range (91). During intact pressure regulation, increases of
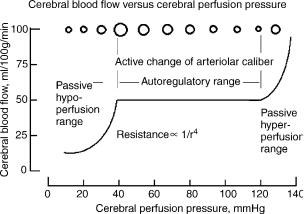
Figure 1. Illustration of static pressure regulation. Within the autoregulatory range, changes in arteriolar diameter, represented here as circles at the top of the graph, are primarily responsible for the regulation of cerebral blood flow. The arterial–arteriolar bed actively constricts with increasing CPP and dilates with decreasing CPP. Hypoperfusion occurs when CPP falls below the lower limit of regulation. As CPP falls below this limit, the vascompression of the arterioles and resistance increases markedly. The lower limit of regulation is not precisely known and varies with age, with 40–50 mm Hg for young pediatric cases (90) and 60–70 mm Hg for an adult (61,86).
CPP cause constriction of the arterial-arteriolar vascular bed and lowering of ICP by a reduction in cerebral blood volume. In addition, the resulting decrease of preand postcapillary pressure lessens fluid filtration and increases absorption, thus reducing the effects of edema. The application of CPP-oriented therapy when autoregulation has been lost may result in an imbalance of Starling forces at the capillaries, leading to increased net filtration and further brain injury by increased production of vasogenic edema.
In contrast to clinical cardiology, where the physiological mechanism underlying the dynamic features of the arterial pressure recording are fairly well understood, very little is known about the mechanism that underlies the shape of pulsations of intracranial pressure and how they are influenced by changes in CPP. Past studies have indicated that pulsations in the cerebrospinal fluid develop from either pulsations of the choroids plexus (92,93) or the arterial vasculature (94,95). Depending on the dilatory state of the cerebrovascular bed, ABP, ICP, and whether the autoregulation is intact, at times the primary component of the ICP pulse may be due to pulsations of venous or arterial origin (94–96). Although the origin of the ICP pulsation is not completely understood, possibly useful methodologies involving the pulsation have been developed. Over two decades ago, Avezatt and van Eijnhoven developed a procedure for distinguishing the occurrence of the loss of regulation of cerebral blood flow through numerical analysis of the pulsation of intracranial pressure (96,97) From laboratory studies, they found that within the autoregulatory range, the relationship between the mean amplitude of the pulsation of ICP increased linearly with mean ICP with a high slope value. At mean ICP above 30 mm Hg, the slope of this relationship decreased. They
MONITORING, INTRACRANIAL PRESSURE |
583 |
proposed that the flattening of the slope of this relationship was an indication of loss of autoregulation (97). A weakness of this technique is that it is dependent on heart rate (98). A low heart rate reflects an increase in the volume, of pulsatile cerebral blood inflow resulting from increased cardiac stroke volume, and the converse is likely for high heart rates. Thus, the variability in the amplitude of the ICP due to heart-rate variability can complicate the analysis (98). However, one modification of the analysis technique is to examine the correlation value between amplitude-pressure and mean ICP rather than the slope of the respective regression line (99). Positive values of this correlation value, which has been called RAP, indicate the ability of the vasculature to regulate cerebral blood flow, and negative values indicate poor cerebrovascular reserve and impaired cerebrovascular reactivity (99,100). Statistical analysis revealed that patients with a fatal outcome were associated with a negative RAP value (99). Most recently, the RAP index has been used to predict the achievable reduction in intracranial pressure a patient can obtain by the implementation of moderate hyperventilation (101). A modification of the mean amplitude of ICP and mean ICP characteristic has been proposed as a means of predicting which patients with idiopathic adult hydrocephalus will have a good outcome after shunting surgery (102). In this application, the amplitude of B-wave of ICP is used instead of the amplitude of the ICP pulsation (102).
In addition to relatively synchronous pulsations of ICP associated with the cardiac cycle, the ICP recording obtained during mechanical ventilation contains a lowfrequency component at the rate of ventilation. Generally during mechanical ventilation, inhalation is produced by positive pressure and expiration occurs during zero pressure. Changes in pulmonary volume produce changes in intrathoracic pressure that mechanically modulate arterial and venous blood flow and produce a cyclic compression of the craniospinal sac. Evidence for this mechanical modulation by intrathoracic pressure can be observed in the spectra of an ICP recording obtained during mechanical ventilation. Because the pulsation in ICP associated with the cardiac cycle produced is quasi-periodic and the rate of ventilation is relatively constant, the spectra of the ICP pressure recording contains salient peaks at the cardiac frequency and its higher harmonics. In addition, each of the spectra associated with cardiac cycle has sidebands with a deviation at the ventilation frequency (103). Such a result is consistent with the premise that intrathoracic pressure changes mechanical modulated arterial and venous blood pressure and volume of the craniospinal sac (103).
Over the last few decades, several clinical and laboratory studies of the correlative relationship between ABP and ICP have been completed. Portnoy et al. reported that during normal vascular tone and intact regulation of cerebral blood flow, the ICP and ABP recordings do not look similar, but during maximum vasodilation of the arterial– arteriolar bed and impaired autoregulation induced by severe hypercapnia, these pressure recordings look remarkably similar (104–106). To numerically quantify the correlation between ABP and ICP, this group examined changes in the coherence function. Specifically, they found
584 MONITORING, INTRACRANIAL PRESSURE
that the frequency domain coherence function approached unity when the ICP and ABP recording became similar. Generally, their observations and the observations of others using a spectral analysis systems approach have suggested that the more similar the spectral components of the ICP recording are to those of the ABP recording, the more likely cerebral autoregulation is impaired (106–108). The physical process describing the ABP as the input to the craniospinal sac and the ICP as the corresponding output has been termed cerebrovascular pressure transmission (106). An observational clinical study determined that four types of frequency descriptions of the transmission characteristic could be identified. Two types were associated with high ICP and the other two with low ICP (47).
More recent studies using time-domain correlation analysis on the ICP and ABP pressure recordings have been completed. As correlation analysis of two signals in the time domain is analytically equivalent to coherence analysis in the frequency domain, it was not unexpected that studies on the normocapnic/hypercapnic piglet model found that as the ICP and ABP recordings became more similar, the maximum value of the correlation function approaches unity, the pial arterioles became more dilated, and cerebral blood flow increased (109,110). Consistent with clinical reports that indicate that unlike adult patients, brain-injured pediatric patients often demonstrate cerebral hyperemia and increased ICP (82,109,111), correlation analysis of pressure recordings obtained from pediatric patients have been found to often approach unity, indicating the occurrence of inappropriate vasodilation and cerebral hyperemia (112). Most recently, Czosnyka et al. have reported the clinical use of a pressure reactivity index (PRx). This index is a moving correlation coefficient between 40 consecutive samples of values for intracranial and arterial pressures averaged for a period of 5 s (113,114). They have concluded that when slow waves in the ABP and ICP recordings are present, the proposed clinical index provides a continuous index of cerebrovascular reactivity (114,115). In particular, the PRx was designed to evaluate the integrity of the cerebrovascular response and estimate cerebrovascular autoregulatory reserve reactivity (114,115). The hypothesis is that because of the sluggish nature of the cerebrovascular system, naturally occurring slow-varying oscillations of ABP can be used to evaluate the autoregulatory reserve reactivity (114,115). Unlike the coherence and correlation indices described above, this index cannot be related to a linear system model. By employing averaging over a 5 s interval, most of the frequency changes above 0.2 Hz in the ABP and ICP recordings are filtered out. In addition, Nyquist’s sampling theorem dictates that the highest frequency that can be represented by a signal sampled every 5 s is 0.1 Hz or six oscillations per minute. As a result, aliasing occurs, and the dynamical system relationship between ABP and ICP is not precisely defined by this index. Nevertheless, the PRx has been found to be a very useful tool. Clinical observations demonstrate that the PRx is high both during the occurrence of plateau waves and during refractory ICP hypertension (115). In addition, the PRx has been used to guide proposed therapies (116) and while variable seems to provide a reliable index of autoregulation (117).
Most recently, the regressive relationship between mean ICP and mean CPP has been used to assess whether autoregulation of cerebral blood flow is intact. In these studies, ABP is pharmalogically elevated and the regressive relationship between ICP and CPP during the test period is obtained (118). If pressure regulation of cerebral blood flow is intact, then increases of CPP will cause vasoconstriction, a decrease of ICP, and the regressive relationship should have a negative slope parameter. A marked positive slope parameter of this regressive relationship is an indication of passive pressure regulation; increases of CPP cause dilation and increased ICP (119).
ANALYSIS METHODS BASED ON MODELS OF ICP
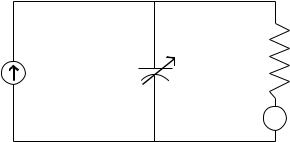
Models of ICP dynamics are based on the modified Monroe– Kellie doctrine (see the Physiology section), which assumes that the total volume of intracranial substance, tissue, blood, and CSF, is constant. Initial mathematical models described the relationship between the formation of CSF and absorption of CSF in equilibrium. Specifically, in these models, laminar flow of CSF is assumed during steadystate conditions (120–123) and the parameters of the mathematical model are presented as an electrical circuit (Fig. 2).
Using this circuit and manipulating the volume of CSF by bolus either by withdrawal, injection, or constant infusion, it is possible to estimate Ro, C, the volume–pressure response, and the PVI. The latter two parameters have been discussed previously in the Physiology section. All parameters have been used to guide the management of hydrocephalous and traumatic brain injury.
Higher order mathematical models of intracranial hydrodynamics that incorporate the arterial and venous blood volume compartments into the analog electric circuit model have been developed to simulate the pulsatility, which is present in the ICP recording. To account for the reciprocal relationship between cerebral blood volume and volume of CSF, Agarwal et al. (124) constructed a model that connected vascular compliance to intracranial compliance in a series configuration. This modeling effort was further developed in detail by Ursino’s proposed fourthorder analog circuit model of overall human intracranial
CSF outflow resistance
CSF storage
R
C
CSF formation
ICP
compliance Ps Dural Sinus pressure
Figure 2. Electric circuit analog model of CSF system. In this model, current represents flow of CSF fluid, and voltage represents pressure. The capacitance C, represents intracranial compliance, and the resistance R represents resistance of CSF fluid flow into the venous system.
hydrodynamics (125,126). A feature of this model is that the arterial–arteriolar vascular bed consists of vasomotor regulating resistance and compliance elements. Dilatory and constrictive responses are primarily simulated by a corresponding decrease or increase of vascular resistance. This initial model has been modified by synchronously modulating the terminal venous bed resistance to account for cyclic variation of ICP produced by positive pressure ventilation (127). The modified model demonstrates that both the depth of modulation and the cerebrovascular venous terminal bed resistance seem to be progressively reduced with increasing levels of vasodilation induced by increasing the levels of partial pressure of arterial blood carbon dioxide. Numerical modeling of cerebrovascular pressure transmission, the relationship between ABP and CPP, has been used to assess changes in the modes of pressure transmission before and after injury. Specifically, a proposed third-order model of ICP dynamics (128) was used to define the mathematical structure to construct a numerical identification model of cerebrovascular pressure transmission from laboratory pressure recordings (112). Consistent with active vasoconstriction before brain injury, during intact regulation of cerebral blood flow, the highest modal frequency of cerebrovascular pressure transmission decreased with increasing CPP. Conversely, consistent with passive vasodilation with loss of autoregulation induced by fluid percussion injury, the highest modal frequency demonstrated a direct relationship with increasing CPP (112).
SUMMARY
Although the subject of intracranial pressure dates back to over 200 ago, both the invasive monitoring procedure required to measure ICP with its accompanying risk of infection and the nonunique nature of the extravascular pressure measurement have retarded the development of knowledge in this area. As a result, the intent of this article is to provide the reader with a broad perspective of ICP monitoring by providing background material on (1) the physiological and anatomical characteristics of the craniospinal, (2) a history of instrumentation techniques including the most recent advances, (3) a brief review of significant clinical ICP monitoring studies with an emphasis on severe head injury, (4) a review of analysis methods, and (5) models of ICP dynamics related to analysis.
BIBLIOGRAPHY
1.Stern WE. Intracranial fluid dynamics. The relationship of intracranial pressure to the Monro-Kellie doctrine and the reliability of pressure assessment. J Royal College Surgeons Edinburgh 1963;9:18–36.
2.Langfitt TW. Increased intracranial pressure. Clin Neurosurg 1969;6:436–471.
3.Monro A. Observations on the Structure and Function of the Nervous System. Edinburgh: Creech and Johnston; 1783.
4.Kellie G. An account of the appearances observed in the dissection of two of three individuals presumed to have perished in the storm of the third and whose bodies were discovered in the vicinity of Leith on the morning of the 4th,
MONITORING, INTRACRANIAL PRESSURE |
585 |
November 1821, with some reflections on the pathology of the brain. Trans Med Chir Soc Edinb 1824;1:84–169.
5.Weed LH, McKibben PS. Pressure changes in cerebrospinal fluid following intravenous injection of solutions of various concentrations. Am J Physiol 1919;48:512–530.
6.Weed LH. Some limitations of the Monro–Kellie hypothesis. Arch Surg 1929;18:1049–1068.
7.Kocher T. Hirnerschutterung, Hirndruck und chirurgische Eingriffe bein Hirnerkrankungen Nothnagel: Spezielle Pathologie und Therapie: 1901.
8.Duret H. Etudes experimentales et cliniques sur les traumatismes cerebrau. Paris: 1978.
9.Cushing H. Some experimental and clinical observations concerning states of increased intracranial tension. Am J Med Sci 1902;124:375–400.
10.Cushing H. The blood pressure reaction of acute cerebral compression, illustrated by cases of intracranial haemorrhage. Am J Med Sci 1903;125:1017–1044.
11.Cushing H. Concerning a definite regulatory mechanism of the vasomotor center which controls blood pressure during cerebral compression. Johns Hopk Hosp Bull 1901;12:290–292.
12.Jennet WB. Experimental brain compression. Arch Neurol 1961;4:599–607.
13.Johnston IH, Rowan JO. Raised intracranial pressure and cerebral blood flow: 3. Venous outflow tract pressures and vascular resistances in experimental intracranial hypertension. J Neurol Neurosurg Psych 1974;37:392–402.
14.Browder J, Meyers R. Observations on behaviour of the systemic blood pressure, pulse and spinal fluid pressure following craniocerebral injury. Am J Surg 1936;31:403–427.
15.Smyth CE, Henderson WR. Observations on the cerebrospinal fluid pressure on simultaneous ventricular and lumbar punctures. J Neurol Psychiat 1938;1:226–237.
16.Evans JP, Espey FF, Kristoff FV, Kimball FD, Ryder HW. Experimental and clinical observations on rising intracranial pressure. Arch Surg 1951;63:107–114.
17.Marmarou A, Shulman K, LaMorgese J. Compartmental analysis of compliance and outflow resistance of the cerebrospinal fluid system. J Neurosurg 1975;43:523–534.
18.Miller JD, Stanek AE, Langfitt TW. Concepts of cerebral perfusion pressure and vascular compression during intracranial hypertension. In: Meyer JS, Schade JP, editors. Progress in Brain Research. vol 35: Cerebral Blood Flow. Amsterdam: Elsevier; 1972. pp 411–432.
19.Miller JD, Garibi J, Pickard JD. Induced changes of cerebrospinal fluid volume: Effects during continuous monitoring of ventricular fluid pressure. Arch Neurol 1973;28: 265–269.
20.Miller JD, Pickard JD. Intracranial volume/pressure studies in patients with head injury. Injury 1974;5:265–268.
21.Miller JD, Leech PJ, Pickard JD. Volume pressure response in various experimental and clinical conditions. In: Lundberg N, Ponten U, Brock M, editors. Berlin: Springer; Intracranial Pressure II; 1975. pp 97–99.
22.Miller JD. Volume and pressure in the craniospinal axis. Clin Neurosurg 1975;22:76–105.
23.Hase U, Reulen HJ, Meinig G, Schrmann K. The influence of the decompressive operation on the intracranial pressure and the pressure volume relation in patients with severe head injuries. Acta Neurochir 1978;45:1–13.
24.Lundberg N. Continuous recording and control of ventricular fluid pressure in neurosurgical practice. Acta Psychiat Neurol Scand 1960;36:149.
25.Baylis WM, Hill L, Gulland GL. On intracranial pressure and the cerebral circulation. J Physiol 1897;18:334–362.
26.Rosner MJ, Becker DP. ICP monitoring: Complications and associated factors. Clin Neurosurg 1996;23:494–519.
586MONITORING, INTRACRANIAL PRESSURE
27.Maas A, Dearden M, Teasdale GM, Braakman R, Cohodan F, Iannotti F, Karimi A, Lapirre F, Murray G, Ohman J, Persson L, Servadei F, Stocchetti N, Unterburg A. EBIC-Guidelines for management of severe head injury in adults. Acta Neurochir 1997;139:286–294.
28.Naryan RK. et al. Guidelines for the management of severe head injury. J Neurotrauma 1997;13:639–734.
29.Gabe IT. Cardiovascular fluid dynamics. Acta Physiol Scand 1972;19:306–322.
30.Piper IR, Dearden NM, Miller JD. Methodology of spectral analysis of the intracranial pressure waveform in a head injury intensive care unit. In: Hoff JT, Betz AL, editors. Intracranial Pressure VII. Berlin: Springer-Verlag; 1989. pp 668–671.
31.Allan MWB. Measurement of arterial pressure using cathe- ter–transducer systems. Br J Anaesth 1988;60:413–418.
32.Czosnyka M, Czosnyka Z, Pickard J. Laboratory testing of the Spiegelberg brain pressure monitor: A technical report. J Neurol Neurosurg Psych 1997;63:732–735.
33.Ostrup RC, Luerssen TG, Marshall LF. Continuous monitoring of intracranial pressure with a miniturized fibreoptic device. J Neurosurg 1987;67:206–209.
34.Marmarou A, Tsuji O, Dunbar JG. Experimental evaluation of a new solid state ICP monitor. In: Nagai H, Kemiya K, Ishiii S, editors. Intracranial Pressure IX. New York: Springer-Verlag; 1994. pp 15–19.
35.Morgalla MH, Cuno M, Mettenleiter H, Will BE, Krasznai L, Skalej M, Bitzer M, Grote EH. ICP monitoring with a reusable transducer: experimental and clinical evaluation of the GaeltecICT/bpressureprobe.ActaNeurochir(Wien)1997;139(6): 569–573.
36.Holzschuh M, Woertgen C, Metz C, Brawanski A. Clinical evaluation of the InnerSpace fibreoptic intracranial pressure monitoring device. Brain 1988;12:191–198.
37.Betsch HM, Aschoff A. Measurement artifacts in Gaeltec intracrnial pressure monitors due to radio waves from personal beeper systems. Anaesthesiol Intensivmed Notfallmed Schmerzther 1992;27(1):51–52.
38.Munch E, Weigel R, Schmiedek P, Schurer L. The Camino intracranial pressure device in clinical practice: Reliability, handling characteristics and complications. Acta Neurochir 1998;140:1113–1119.
39.Chambers IR, Kane PJ, Choksey MS, Mendelow AD. An evaluation of the Camino ventricular bolt system in clinical practice. Neurosurgery 1993;33:866–868.
40.Weinstable C, Richling B, Plainer B, Czech T, Spiss CK. Comparative analysis between epidural (Gaeltec) and subdural (Camino) intracranial pressure probes. J Clin Monit 1992;8:116–120.
41.Piper IR, Miller JD. The evaluation of the waveform analysis capability of a new strain-gauge intracranial pressure microsensor. Neurosurgery 1995;36:1142–1145.
42.Signorini DF, Shad A, Piper IR, Statham PFX. A clinical evaluation of the Codman microsensor for intracranial pressure monitoring. Br J Neurosurgery 1988;12:223–227.
43.Fernades HM, Bingham K, Chambers IR, Mendelow AD. Clinical evaluation of the Codman microsensor intracranial pressure monitoring system. Acta Neurochir Suppl (Wien) 1998;71:44–66.
44.Mendelow AD, Rowan JO, Murray L, Kerr AE. A clinical comparison of subdural screw pressure measurements with ventricular pressure. J Neurosurg 1983;58:45–50.
45.Piper IR, Barnes A, Smith DH, Dunn L. The Camino intracranial pressure sensor: Is it optimal technology? An internal audit with a review of current intracranial pressure monitoring technologies. Neurosurgery 2001;49: 1158–1165.
46.Citerio G, Piper I, Cormio M, Galli D, Cazzaniga S, Enblad P, Nilsson P, Contant C, Chambers I, on behalf of the BrainIT Group, Bench test assessment of the new Raumedic.
47.Piper IR, Miller JD, Dearden NM, Leggate JR, Robertson I. Systems analysis of cerebrovascular pressure transmission: An observational study in head injured patients. J Neurosurg 1993;73:871–880.
48.Becker DP, et al. The outcome from severe head injury with early diagnosis and intensive management. J Neurosurg 1977;47:491–502.
49.Marshall LF, Smith RW, Shapiro HM. The outcome with aggressive treatment in severe head injuries. Part 1: The significance of intracranial pressure monitoring. J Neurosurg 1979;50:20–25.
50.Miller JD, et al. Significance of intracranial hypertension in severe head injury. J Neurosurg 1977;47:503–516.
51.Pitts LH, Kaktis JV, Juster R, Heilbrun D. ICP and outcome in patients with severe head injury. In: Shulman K, Marmarou A, Miller JD, Becker DP, Hochwald GM, Brock M, editors. Intracranial Pressure IV. Berlin: Springer; 1980. pp 5–9.
52.Stuart G, Merry G, Smith JA, Yelland JDM. Severe head injury managed without intracranial pressure monitoring. J Neurosurg 1983;59:601–605.
53.Miller JD, et al. Further experience in the management of severe head injury. J Neurosurg 1981;54:289–299.
54.Alberico AM, Ward JD, Choi SC, Marmarou A, Young H. Outcome after severe head injury: Relationship to mass lesions, diffuse injury and ICP course in pediatric and adult patients. J Neurosurg 1987;67:648–656.
55.Choi SC, Muizelaar JP, Barnes TY, Marmarou A, Brooks DM, Young HF. Prediction tree for severely head injured patients. J Neurosurg 1991;75:251–255.
56.Vollmer DG, Torner JC, Jane J, et al. Age and outcome following traumatic coma: Why do older patients fare worse? J Neurosurg 1991;75:s37–s49.
57.O’Sullivan MG, Statham PF, Jones PA, et al. Role of intracranial pressure monitoring in severely head–injured patients without signs of intracranial hyperension on initial computerised tomography. J Neurosurg 1994;80:46–50.
58.Narayan RK, Greenberg RP, Miller JD, Enas GG, Choi SC, Kishore PRS.
59.Saul TG, Ducker TB. Effect of intracranial pressure monitoring and aggressive treatment on mortality in severe head injury. J Neurosurg 1982;56:498–503.
60.Marmarou A, et al. Impact of ICP instability on outcome in patients with severe head trauma. J Neurosurg 1991;75:s59– s66.
61.Jones PA, Andrews PJD, Midgley S, Anderson SI, Piper IR, Tocher JL, Housley AM, Corrie JA, Slattery J, Dearden NM, Miller JD. Measuring the burden of secondary insults in head–injured patients during intensive care. J Neurosurg Anaesth. 6:4–14.
62.Lewelt W, Jenkins LW, Miller JD. Autoregulation of cerebvral blood flow after experimental fluid percussion injury of the brain. J Neurosurg 1980;53:500–511.
63.Povlishock JT, Kontos HA. Continuing axonal and vascular change following experimental brain trauma. Central Nervous System Trauma 1985;2:285–298.
64.Nordstrom CH, et al. Cerebral blood flow, vasoreactivity and oxygen consumption during barbiturate therapy in severe traumatic brain lesions. J Neurosurg 1988;68:424–431.
65.Miller JD, Adams JH. The pathophysiology of raised intracranial pressure. In: Adams JH, Duchen LW, editors. Greenfield’s Neuropathology. 5th ed. London: Arnold; 1992: 69–105.
66.DeSalles AF, Muizelaar JP, Young HF. Hyperglycemia, cerebrospinal fluid lactic acidosis and cerebral blood flow in severly head–injured patients. Neurosurgery 1987;21:45–50.
67.Jaggi LJ, Obrist WD, Gennarelli TA, Langfitt TW. Relationship of early cerebral blood flow and metabolism to outcome in acute head injury. J Neurosurg 1990;72:176–182.
68.Muizelaar JP, Ward JD, Marmarou A, Newton PG, Wachi A. Cerebral blood flow and metabolism in severely head–injured children. Part 2: Autoregulation. J Neurosurg 1989;71:72–76.
69.Muizelaar JP, Marmarou A, DeSalles AAF, Ward JD, Zimmerman RS, Zhongchao L, Choi SC, Young HF. Cerebral blood flow and metabolism in severely head–injured children. Part 1: Relationship with GCS score, outcome, ICP and PVI. J Neurosurg 1989;71:63–71.
70.Uzzell BP, Obrist WD, Dolinskas CA, Langfitt TW. Relationship of acute CBF and ICP findings to neuropsychological outcome in severe head injury. J Neurosurg 1986;65:630–635.
71.Rose J, Valtonen S, Jennett B. Avoidable factors contributing to death after head injury. Brit Med J 1977;2:615–618.
72.Gentleman D, Jennett B. Hazards of interhospital transfer of comatose head injured patients. Lancet 1981;ii:835–855.
73.Graham DI, Hume Adams J, Doyle D. Ischemic brain damage in fatal non–missile head injuries. J Neurol Sci 1978;39:213– 234.
74.Graham DI, Ford I, Adams JH, Doyle D, Teasdale GM, Lawrence AE, Mclellan DR. Ischemic brain damage is still common fatal non–missile head injury. 1989.
75.Miller JD, Garibi J. Intracranial volume/pressure relationships during continuous monitoring of ventricular fluid pressure. In: Brock M, Dietz H, editors. Intracranial Pressure. Berlin: Springer; 1972. 270–274.
76.Johnston IH, Rowan JO. Raised intracranial pressure and cerebral blood flow: 3. Venous outflow tract pressures and vascular resistances in experimental intracranial hypertension. J Neurol Neurosurg Psychi 1974;37:392–402.
77.Yada K, Nakagawa Y, Tsuru M. Circulatory disturbance of the venous system during experimental intracranial hypertension. J Neurosurg 1973;39:723–729.
78.Nakagawa Y, Tsura M, Yada K. Site and mechanism for compression of the venous system during experimental intracranial hypertension. J Neurosurg 1974;41:427–434.
79.Harper AM. Autoregulation of cerebral blood flow: influence of the arterial pressure on blood flow through the cerebral cortex. J Neurol Neurosurg Psych 1966;29:398–403.
80.Muizelaar JP, Becker DP. Induced hypertension for the treatment of cerebral ischemia after subarachnoid hemorrhage. Direct effect on cerebral blood flow. Surg Neurol 1986;25:317–325.
81.Obrist WD, et al. Cerebral blood flow and metabolism in comatose patients with acute head injury. Relationship to intracranial hypertension. J Neurosurg 1984;61:241–253.
82.Bouma GJ, Muizelaar JP. Relationship between cardiac output and cerebral blood flow in patients with intact and with impaired autoregulation. J Neurosurg 1990;73:368–374.
83.Chan KH, Miller JD, Piper IR. Cerebral blood flow at constant cerebral perfusion pressure but changing arterial and intracranial pressure: Relationship to autoregulation. J Neurosurg Anaesth 1992;4:188–193.
84.Piper IR, Lawson A, Dearden NM, Miller JD. Computerised data collection: a microcomputer data collection system in head injury intensive care. Br J Intensive Care 1991;1:73–78.
85.Chambers IR, Treadwell L, Mendelow AD. The cause and incidence of secondary insults in severely head–injured adults and children. 2000.
86.Signorini DF, Andrews PJD, Jones PAJ, Wardlaw JM, Miller JD. Prediciting survival using simple clinical variables: A case study in traumatic brain injury. J Neurol Neurosurg Psych 1999;66:20–25.
87.Signorini DF, Andrews PJD, Jones PAJ, Wardlaw JM, Miller JD. Adding insult to injury: The prognostic value of early
MONITORING, INTRACRANIAL PRESSURE |
587 |
secondary insults for survival after traumatic brain injury. J Neurol Neurosurg Psychi 1999;66:26–31.
88.Robertson CS, Valadka AB, Hannay HJ, Contant CF, Gopinath SP, Cormio M, Uzura M, Grossman RG. Prevention of secondary ischemic insults after severe head injury. Crit Care Med 1999;27(10):2086–2095.
89.Chambers IR, Jones PA, Lo TY, Forsyth RJ, Fulton B, Andrews PJ, Mendelow AD, Minns RA. critical threshold of intracranial pressure and cerebral perfusion pressure related to age in paediatric head injury. 2005.
90.Piper I, et al. The BrainIT Group: Concept and core dataset definition. Acta Neurochir 2003;145:615–629.
91.Rosner MJ, Rosner SD, Johnson AH. Cerebral perfusion pressure: management protocol and clinical results. J Neurosurg 1995;83:949–962.
92.Bearing EA. Choroid plexus and arterial pulsation of cerebrospinal fluid. Arch Neurol Psych 1955;73:165–172.
93.Hamit HF, Beall AC, DeBakey ME. Hemodynamic influences upon brain and cerebrospinal fluid pulsations and pressures. J Trauma 1965;5:174–184.
94.Dardenne G, Dereymaeker A, Lacheron JM. cerebrospinal fluid pressure and pulsatility. An experimental study of circulatory and respiratory influences in normal and hydrocephalic dogs. 1969.
95.Hamer J, Alberti E, Hoyer S, Wiedemann K. Influence of systemic and cerebral vascular factors on the cerebrospinal fluid pulse waves. 1977.
96.Avezatt CJJ, van Eijndhoven JHM. Clinical observations on the relationship between cerebrospinal fluid pulse pressure and intracranial pressure. In: Cerebrospinal Fluid Pulse Pressure and Cranio–spinal Dynamics: A Theoretical, Clinical and Experimental Study. Thesis. Erasmus Univ., Rotterdam, 1984.
97.Avezatt CJJ, van Eijndhoven JHM. Cerebrospinal fluid pulse pressure and intracranial volume–pressure relationships. J Neurol Neurosurg Psych 1979;42:687–700.
98.Daley ML, Gallo A, Mauch W. Analysis of the intracranial pressure pulsation associated with the cardiac cycle. Innovation Et Technology En Biologie Et Medicine 1986;7:537–544.
99.Czosynka M, Guazzo E, Whitehouse M, Smielewski P, Czosynka Z, Kirkpatric P, Piechnik S, Pickard JD. Significance of intracranial pressure waveform analysis after head–injury. Acta Neurochir (Wien) 1996;138(5):531–541.
100.Balestreri M, Czosynka M, Steiner LA, Schmidt E, Smielewski P, Matta B, Pickard JD. Intracranial hypertension: What additional information can be derived from ICP waveform after head injury? Acta Neurochir 2004;146:131–141.
101.Steiner IA, Balestreri M, Johnston AJ, Coles JP, Smielewski P, Pickard JD, Menon DK, Czosnyka M. Predicting the response of intracranial pressure to moderate hyperventilation Acta Neurochirurgica (online) 2005.
102.Lenfeldt N, Anderson N, Agren–Wilsson A, Bergenheim AT, Koskinen LO, Eklund A, Malm J. Cerebrospinal fluid pulse pressure method: A possible substitute for the examination of B waves. J Neurosurg 2004;101(6):944–950.
103.Daley ML, Pasley R, Connolly M, Angel J, Timmons S, Stidham G, Leffler C. Spectral characteristics of B–waves and other low– frequency activity. Acta Neurochurirgica 2002;81:147–150.
104.Chopp M, Portnoy H. System analysis of intracranial pressure. J Neurosurg 1980;53:516–527.
105.Portnoy HD, Chopp M. Cerebrospinal fluid pulse wave form analysis during hypercapnia and hypoxia. Neurosurgery 1981;9:14–27.
106.Portnoy HD, Chopp M, Branch C, Shannon MD. Cerebrospinal fluid pulse waveform as an indicator of cerebral autoregulation. J Neurosurg 1982;56:666–678.