

86 HYPOTHERMIA.
116.Wu F, et al. Pathological changes in human malignant carinoma treated with high-intensity focused ultrasound. Ultrasound Med Biol 2001;27:1099–1106.
117.Chaussy C, Thuroff S. High-intensity focused ultrasound in prostate cancer: Results after 3 years. Mol Urol 2000;4:179– 182.
118.Madersbacher S, et al. Tissue ablation in benign hyperplasia with high-intensity focused ultrasound. Eur Urol 1993;23 (Suppl. 1):39–43.
119.Hynynen K, et al. MR imaging-guiding focused ultrasound surgery of fibroadenomas in the breast: A feasibility study. Radiology 2001;219:176–185.
120.Hynynen K, et al. A clinical noninvasive MRI monitored ultrasound surgery method. RadioGraphics 1996;16:185–195.
121.Hazel JD, Stafford RJ, Price RE. Magnetic resonance imaging-guided focused ultrasound thermal therapy in experimental animal models: Correlation of ablation volumes with pathology in rabbit muscle and VX2 tumors. J Magnet Reson Imag 2002;15:185–194.
122.Weidensteiner C, et al. Real time MR temperature mapping of rabbit liver in vivo during thermal ablation. Mag Reson Imag 2003;50:322–330.
123.Chan AH, et al. An Image-guided high intensity focused ultrasound device for uterine fibroids treatment. Med Phys 2002;29:2611–2620.
124.Tempany CMC, et al. MR imaging-guided focused ultrasound surgery of uterine leiomyomas: A feasibility study. Radiology 2003;226:897–905.
125.Stewart EA, et al. Focused Ultrasound treatment of uterine fibroid tumors: Safety and feasibility of a noninvasive thermoablative technique. Am J Obstet Gynecol 2003;189:48–54.
126.Wu F, et al. Changes in ultrasonic image of tissue damaged by high intensity ultrasound in vivo. J acoustic Soc Am 1998;103:2869.
127.Wu F, Wang ZB, Chen WZ, Zou JZ. Extracorporeal HighIntensity Focused Ultrasound for treatment of solid carcinomas: Four-year Chinese clinical experience. Proceedings of the 2nd International Symposium on Therapeutic Ultrasound; July 29-Aug1; Seattle; 2002.
128.Kennedy JE, et al. HighIntensity focused ultrasound for the treatment of liver tumours. Ultrasonics 2004;42:931–935.
129.Wu F, et al. Extracorporeal high intensity focused ultrasound ablation in the treatment of patients with large hepatocellular carcinoma. Ann Surg Oncol 2004;11(12): 1061–1069.
130.Uchida T, et al. Transrectal high-intensity focused ultrasound for treatment of patients with stage T1b-2NOMO localized prostate cancer: A preliminary report. Urology 2002;59:394–399.
131.Blana A, Walter B, Rogenhofer S, and Wieland W. HighIntensity focused ultrasound for the treatment of localized prostate cancer: 5-year experence. Urology 2004;63:297–300.
132.Madersbacher S, et al. Effect of high intensity focused ultrasound on human prostate cancer in vivo. Cancer Res 1995;55:3346–3351.
133.Gelet A, et al. Treatment of prostate cancer with transrectal focused ultrasound: Early clinical experience. Eur Urol 1996;29:174–183.
134.Chaussy C, Thuroff S, Lacoste F, Gelet A. HIFU and prostate cancer: The European experience. Proceedings of the 2nd International Symposium on Therapeutic Ultrasound; July 29–Aug 1; Seattle; 2002.
135.Beerlage HP, et al. High-intensity focused ultrasound followed after one to two weeks by radical retropubic prostatectomy: Results of a prospective study. Prostate 1999;39:41– 46.
136.Beerlage HP, et al. Transrectal high-intensity focused ultrasound using the Ablatherm device in treatment of localised prostate carcinoma. Urology 1999;54:273–277.
137.Kohrmann KU, et al. High-intensity focused ultrasound for noninvasive tissue ablation in the kidney, prostate, and uterus. J Urol 2000;163 (4Suppl.):156.
138.Wu F, et al. A randomized clinical trial of high-intensity focused ultrasound ablation for the treatment of patients with localised breast cancer. BJC 2003;89:2227–2233.
139.Mc Pherson K, Steel CM, Dixon JM. Breast cancer epidemiology, risk factors, and genetics. Br J Med 2000;321: 624–628.
140.Curran D, et al. Quality of life in early stage breast cancer patients treated with radical mastectomy or breastconverging procedure: Results of EORTC trial 10801. The European Organization for Research and Treatment of Cancer (EORTC), Breast Cancer Cooperative Group (BCCG). Eur J Cancer 1998;34:307–314.
141.Aubry J, et al. Experimental demonstration of noninvasive transskull adaptive focused based on prior computed tomography scans. J Acoust Soc Am 2003;113:84–93.
142.Clement GT, Hynynen K. A noninvasive method for focusing ultrasound through the human skull. Phys Med Biol 2002;47:1219–1236.
143.Foley J, et al. Image-guided HIFU neurolysis of peripheral nerves to treat spasticity and pain. Ultrasound Med Bio 2004;30:1199–1207.
144.Ohtsuka T, et al. Thoracoscopic internal mammary artery harvest for MICABG using the Harmonic Scalpel. Ann Thorac Surg 1997 June; 63 (6Suppl):S10.
145.Lee LA, et al. High intensity focused ultrasound effect on cardiac tissues: Potential for clinical application. Echocardiography 2000 Aug; 17(6 Pt 1):563–566.
146.Strickberger SA, et al. Extracardiac ablation of the canine atrioventricular junction by use of high-intensity focused ultrasound. Circulation 1999;100:203–208.
147.Natale A. Cleveland Clinic Foundation. Personal Interview. March 5, 2005.
148.Natale A, et al. First Human Experience with Pulmonary vein isolation using a through-the-balloon circumferential ultrasound ablation system for recurrent atrial fibrillation. Circulation 2000;102:1879.
149.Saliba W, et al. Circumferential ultrasound ablation for pulmonary vein isolation: Analysis of acute and chronic failures. J of Cardiovasc Electrophysiol 2002;13:957–961.
150.Ayoma H, et al. Circumferential lesion characteristic of high intensity focused ultrasound balloon catheter for pulmonary vein isolation. Heart Rhythm 2004;1:S430.
151.Smith NB, Hynyen K. The feasibility of using focused ultrasound for transmyocardial revascularization Ultrasound Med Biol 1998;24:1045–1054.
152.Foldes K, et al. Magnetic resonance imaging-guided focused ultrasound synovectomy. Scand J Rheumal 1999;28:233–237.
153.Vaezy S, et al. Hemostasis of punctured blood vessels using high-intensity focused ultrasound. Ultrasound Med Biol 1998;24:903–910.
154.Roberts WW, et al. High-Intensity focused ultrasound ablation of the vas deferens in canine model. J Urol 2002; 167:2613–2617.
See also HYPERTHERMIA, INTERSTITIAL; HYPERTHERMIA, SYSTEMIC;
THERMOMETRY.
HYPOTHERMIA. See TEMPERATURE MONITORING.
I
IABP. See INTRAAORTIC BALLOON PUMP.
IMAGE INTENSIFIERS AND FLUOROSCOPY
MELVIN P. SIEDBAND
University of Wisconsin
Fitchburg, Wisconsin
INTRODUCTION
Early fluoroscopic systems used a phosphor-coated sheet or screen to convert incident X-ray photons to light. The radiologist observed the image through a lead glass protective screen. A film camera was often used to record the image. There are two serious disadvantages to this method: the radiologist had to be dark adapted so that image details were hard to see and the collection solid angle of the eye or camera lens was small. The small collection angle meant that the X-ray exposure had to be increased by almost 100 times to have the same diagnostic quality as a conventional radiograph. Photographing the fluoroscopic screen, photofluorography, is no longer used because of the high exposure to the patients. All X-ray images are noise limited by the finite number of X-ray quanta detected and seen. A 50 keV X-ray photon can, at best, produce 1000 visible light photons, if absorbed by the old-type phosphor. About 5– 10% of the incident X-ray photons are stopped and converted to light by the fluorescent screen. The quantum detection efficiency, (QDE) of the screen is the product of the ability to absorb the incident X-ray photon and the probability of emitting light. A thicker screen would absorb more photons, but would also cause more lateral spreading of the light and reduce the resolution of the image. The 5– 10% QDE figure is a practical compromise between resolution and sensitivity. If it is assumed that the visible light photons are emitted isotropically, then the lens of the eye or camera subtends only a very small fraction of this light radiation hemisphere. A sheet of film in a radiographic cassette has a phosphor-coated sheet on either side and can collect light photons far more efficiently.
The invention of the image intensifier overcame these objections. The concept of the early image intensifiers was to use a thin, curved, glass meniscus, 15 cm diameter, coated on the convex side with a scintillator, originally of the same composition as the zinc:cadmium sulfide fluoroscopic phosphor plates, and a photoemitter on the concave surface. Light produced by the scintillator did not have far to travel to excite the photoemitter. This assembly was placed in a vacuum tube and the photoelectrons were accelerated toward an output viewing screen where a small and very bright image was produced. Because the photoemitter was in close optical contact with the scintillator, the collection angle was very large so that a higher radiation exposure was not needed and the image at the viewing screen was bright enough so that dark adaptation was
obviated and fine details could be seen. An optical viewer comprising an objective lens and relay lens, similar in design to a submarine periscope, was used to observe the image.
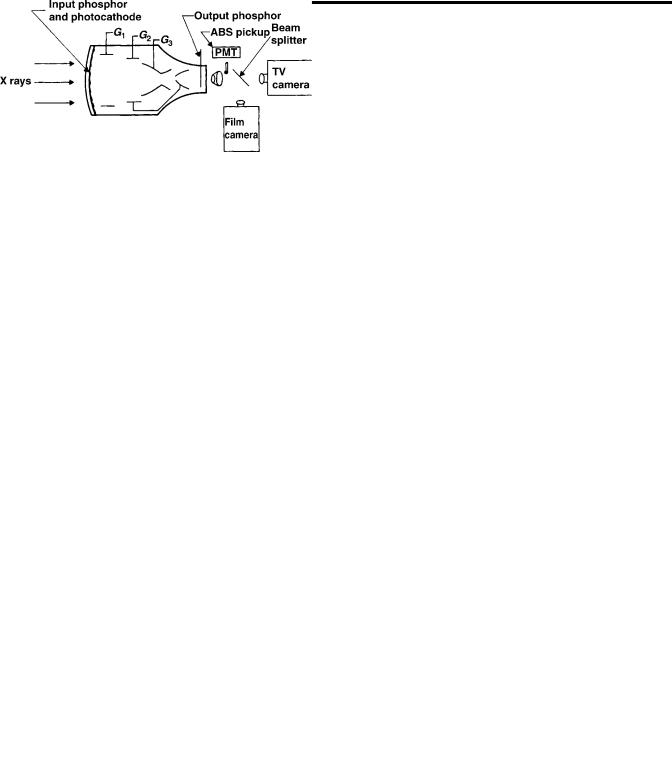
Modern image intensifiers use an epitaxially grown scintillator of CsI with the photoemitter deposited directly on the surface of that layer. Because the epitaxial layer can be made much thicker than the powdery deposit of the older type scintillator for the same resolution, the new image intensifiers require less exposure–image than conventional radiographs. The thicker layer has a higher QDE than the fluoroscopic screens (Fig. 1).
Many modern image intensifiers use a thin curved steel window on which the scintillator and photoemitter are deposited. This geometry eliminates the X-ray scatter produced by the glass window of the older tubes and improves image contrast. Larger tubes up to 35 cm sensor diameter have been made with variable magnification or zoom capability. The window of thin steel is the flash with a coating of aluminum or other metal and etched to create a domain structure, similar to the domains seen in the zinc coating of galvanized steel. The domains here are very small, 100 mm diameter. Cesium iodide is then vapor deposited on this surface and forms epitaxially (i.e., crystal growth follows the orientation of the metallic substrate), and grows as a collection of optically isolated fibers. This scintillator can be made quite thick with little light spreading. The greater thickness means higher quantum efficiency (i.e., a measure of the fraction of incident X-ray photons converted to light photons), when compared to conventional phosphor plate scintillators. A thin layer of silver and antimony is vapor deposited on top of the scintillator and the final sensitization is accomplished by depositing cesium from heated tubes or reservoirs after assembly in the vacuum tube. The AgCs:Sb photoemitter on the surface of the scintillator is similar to the photocathode of a photomultiplier (PMT), tube.
Figure 1. In the image intensifier, X rays strike the input phosphor screen, thus generating light. Light stimulates the photocathode to emit electrons, which are accelerated through 25 kV to strike the output phosphor screen. Brightness gain is due to both geometric gain and electronic gain.
87
88 IMAGE INTENSIFIERS AND FLUOROSCOPY
The vacuum tube uses a series of metal cylinders between the photoemitter and the output phosphor. The photoemitter, cylinders, and output phosphor are connected to voltage sources to create shaped electric fields. The field potential at any point affects an electron beam in the same way that the index of refraction of a glass lens affects a beam of light. These cylinders and their potentials form electrostatic lenses to focus the photoelectrons to produce the small and bright image on the output phosphor. Like optical lens elements, the metal cylinders can make compound electrostatic lenses so that focal length can be varied to change the size of the output image: variable zoom.
The brightness gain of an image intensifier is a measure that compares the brightness of the image at the small output screen to that of the older fluoroscopic screens. This gain is a result of the added energy imparted to the photoelectrons, the higher probability of stopping an incident X-ray photon, and the effect of compressing the large input area signal to the small area of the output screen. The older term, brightness gain, has been replaced by conversion efficiency. This term is defined as the output lumi-
nance |
in |
candela m 2 |
1 for an input exposure rate of |
|
|
1 |
|
||
1 mR s |
|
or 10 mGy s . If assumed it is that a single |
||
50 keV input X-ray photon has a 50% probability of interacting with the input scintillator and producing light (i.e., QDE is 50%) and produces 2000 visible light photons, of which 1000 reach the photoemitter. About 100 of these will produce electrons that will be accelerated by the electric field across the tube and strike the output phosphor as 25 keV electrons. Each 25 keV photoelectron has about a 10% probability of converting its energy into 2.2 eV visible light photons. The QDE, quantum detection efficiency, of the image intensifier is assumed to be 50% because of the thicker CsI scintillator.
An input exposure rate in the diagnostic range produces200,000 X-ray photons mm 2 s 1, converts to 100,000 light photons/X-ray photon. In the visible range, 1010 photons/mm2 have a light intensity of 1 candela/m2. Substituting in the above, a 1 mR (10 mGy) input would produce 1 candela m 2 for an output screen the same size as the input scintillator. This is >200 times brighter than the older fluoroscopic screens. Because the output screen area of an image intensifier is 25 mm diameter for an input screen of diameter of 220 mm, the same number of output light photons are emitted from a smaller area resulting in an additional gain factor of 75. This yields a total brightness gain of >15,000 over the old fluoroscopic screen!
A fluoroscopic television system is used for dynamic studies, to enable the viewer to see how a contrast agent is swallowed, how blood flows, to locate objects for a surgical procedure, and so on. During the study, an image record (formerly a film record) could be made for later examination using a video recorder or computer. A rapid succession of images could be recorded and then viewed to find the few images revealing the particular problem, for example, how a heart valve functioned or to diagnose an eroded region in the esophagus as the contrast medium sped by. Or a single image could be made to show the problem for later correction.
A fast optical lens optically collimates the small output image of the image intensifier. Collimation, in this case,
means that the optical object is at the focal plane of the collimating lens and its image is focused on an infinite distance away. Any optical device with its own objective lens, such as a TV or film camera, could be aimed through the collimating lens and its image size would be the original intensified image size times the ratio of (objective focal length)/(collimator focal length). The lenses could be separated by several centimeters before image vignetting occurs. A beam splitting mirror can be interposed on the collimator and the objective lenses so that image light is simultaneously apportioned between a TV and film camera. A small mirror or prism and lens could sample the light and form an image over a small hole in the cover of a PMT tube. The hole would permit only light from the center of the image to reach the PMT. The output of the PMT is used to control the X-ray tube current to maintain constant image brightness for continuous viewing or for automatic exposure control of one or a sequence of recorded images. This automatic brightness stabilizer scheme is similar in concept to automatic exposure control of most digital cameras.
The quality of an X-ray image is a compromise between exposure to the patient and the noise or ‘‘graininess’’ of the image. Most images are made using the ALARA principal (As Low As Reasonably Achievable). For any given X-ray exposure, there are a finite number of X-ray photons incident on the patient and then, through the patient, incident on the image sensor. The statistics of photons– area follow the Poisson distribution, so that the variance (noise) is the square root of the average number of photons in a pixel (picture element). To produce a second image having twice the linear resolution (detail) as the first requires four times the exposure. Because the eye averages exposure time >0.2 s, to record an equivalent image in 0.02 s requires an exposure rate 10 times greater. X-ray exposure requirements are determined by the by the X-ray absorption of the patient, diagnostic needs and are different for continuous viewing (real-time fluoroscopy), a sequence of images (video or motion pictures), or single images for later diagnoses.
Before the rapid growth and improvement of digital cameras and computer technologies, still and motion picture film cameras were the only practical means to record images. Because of differences of integrating capability of the eye and detail required of the recorded film images, the X-ray beam current, pulse width (exposure time/image), and so on, the ratio of transmission/reflection of the beam splitting mirror, and other operating parameters, must, be adjusted to obtain the required image quality for each image application requirement while minimizing total exposure to the patient.
Most modern systems use charge-coupled image sensors with a high dynamic range and pulse the X-ray beam current to the required level while digitally recording video images. Computer display of selected images or a dynamic sequence of images has largely displaced motion picture film techniques. Video tape recorders are used in simple systems. The automatic brightness control–automatic exposure control of the digital system uses signals from selected image areas derived from the computer image to optimize image quality in the region of interest.
BIBLIOGRAPHY
Further Reading
Gebauer A, Lissner J, Schott O. Roentgen Television. New York: Grune & Stratton; 1966.
Siedband MP. Image storage subtraction techniques and contrast enhancement by electronic means. Symposium on the Physics of Diagnostic Radiology; University of California, June 1968.
Siedband MP. Image intensification and television. In: Taveras, Ferrucci, editors. Radiology, Diagnosis, Imaging, Intervention. Chapt. 10. New York: Lippincott; 1990.
Siedband MP, Duffy PA. Brightness Stabilizer with Improved Image Quality, US patent No. 3,585,391. Accessed 1971.
Siedband MP. X-ray image storage, reproduction and comparison system. US patent No. 3,582,651, 1971.
IMAGING, CELLULAR. See CELLULAR IMAGING.
IMAGING DEVICES
MARK J. RIVARD
Tufts New England Medical
Center
FRANK VAN DEN HEUVAL
Wayne State University
INTRODUCTION
Historically, external radiation treatment of deep-seated malignancies was performed using ortho-voltage equipment. The radiological characteristics of these beams caused maximum dose deposition to occur on the skin of the patient. At that time, skin damage was the limiting factor for dose delivery to the tumor. When the skin turned red due to radiation damage (erythema), the physician had to find another area or portal through which to deliver radiation. The portal was then defined by its orientation and the surface of skin it irradiated.
Nowadays, the treatment is performed with higher photon energies that permit a skin-sparing effect (i.e., the dose at the skin is lower than that deposited a few centimeters deeper) due to the absence of electronic equilibrium. The historic name ‘‘portal’’ still denotes a radiotherapy treatment beam oriented for entry within a patient. Physicians verify whether the treatment is correct using megavoltage treatment beams (4–20 MV photons) as an imaging tool. A transmission image, obtained much like a diagnostic transmission image, provides information describing the patient anatomy and gives clues on the beam orientation and positioning, but also on the extent and shape of the treated area (or portal field). As such, portal imaging is the most direct manner to confirm accuracy of treatment delivery.
Traditional portal verification is done using radiographic films, much like the classical diagnostic films. Films are positioned at the beam exit side of the irradiated patient. Portal image analysis involves comparison with a simulation image that is typically obtained using diagnos-
IMAGING DEVICES |
89 |
tic quality X rays (60–120 kV photons). The simulation image serves as the reference image, showing anatomical information clearly and delineating the intended treatment field. Comparison of the simulation image with the portal image is complicated due to the inherent poor quality obtained when imaging using high energy photons (1). The whole procedure of patient positioning, artifact removing, imaging processing, and evaluation using film represents a significant fraction of the total treatment time. This procedure increases the workload per patient, and as a result, the number of images taken is minimized due to economic concerns rather than concerns for efficiency or treatment quality. Indeed, studies have demonstrated that weekly portal image verification, which is the current clinical standard, does not guarantee accurate treatment setup for a population of patients (2).
Portal imaging differs considerably from diagnostic transmission imaging. The main difference is the photon energies used to generate the images. In diagnostic imaging, photons having energies ranging from 50 to 120 kV interact in patients primarily via the photoelectric effect. The cross-section for these interactions is highly dependent on the atomic number of the medium in which they traverse: A higher atomic number increases the probability of interaction. The average atomic number of bony anatomy is higher than that of soft-tissue, yielding good contrast for the bony anatomy. At treatment energies (1–10 MeV) the predominant photon interaction is Compton scattering. The cross-section for this interaction is largely dependent on the media density, and the resulting image will show the largest contrast when large differences in density are present. In practice, this means that differences in soft tissues will contribute most to the visible signal.
These considerations imply that the dynamic range of an electronic portal imaging detector (EPID) is used to obtain information on soft-tissue variations (3), divergence effects (4), scatter contributions (5), field-edge information, and in the case of fluoroscopic imagers: vignetting and glare. With the exception of field-edge information, all of these factors are nonlocalized and tend to change gradually within an image. Not only are these features slowly varying, but they also have a large contrast-to-noise ratio (CNR) compared to the clinically important bone–soft-tissue contrast.
The EPIDs permit the same tasks as film-based imaging, but increase the efficiency and provide added value by using digital imaging techniques. The EPIDs are devices that electronically capture the photon energy fluence transmitted through a patient irradiated during treatment, and allow direct digitization of the image. This image is then immediately available for visualization on a computer screen and electronic storage. When the treatment verification process uses EPIDs, departmental efficiency is increased and quality is improved at the same cost as when using film-based imaging.
Proposals to generate electronic images started in the beginning of the 1980s mainly through the work of Bailey et al. (6), who used systems based on video techniques. This seminal work was then further developed toward more clinically applicable systems by Shalev and co-workers (7), Leong (8), Munro et al. (9), and Visser et al. (10). All
90 IMAGING DEVICES
of these systems were the basis for the first generation of commercially available EPIDs. They all combined an analog camera with a fluorescent screen generating the optical coupling using a mirror system. Wong et al. (11) replaced the mirror system with optical fibers (one for each pixel). The technology developed further, and is described below in greater detail.
PHYSICAL ASPECTS OF ELECTRONIC PORTAL IMAGING TECHNOLOGY
Camera-Based Detectors
The initial experience using EPIDs was obtained using camera-based systems. Again similar to film-based portal imaging, the camera-based systems measured the photon energy fluence exiting the patient. However, phosphorescent and fluorescent screens replaced the film, and a mirror was oriented at an angle of 458 to reflect the screen toward a video camera. Subsequently, the image was digitized. Because of the intrinsically low-detector efficiency, bulky detector size, and poor image quality, this technology has now become outdated in comparison with more sophisticated technologies.
The low-detector efficiency was due to many limitations in the signal path from screen to computer. Screen conversion efficiency was not ideal when using Gd2O2S. In addition, <0.1% of the light emitted reached the video camera, due to the poor light collection efficiency of the video camera lens. This low rate of signal collection was subsequently impacted by competing electronic noise from the camera in close proximity to the operating linear accelerator (linac). Also, image acquisition typically required a full treatment fraction as compared to the technique using partial fraction irradiation that is commonly used for radiographic portal imaging. Due to the camera-based system detector orientation, rigid positioning of the large mirror was crucial. Changes in linac gantry rotation could cause apparent changes in patient positioning due to physical sag of the camera and mirror mounting system. Furthermore, image quality was suboptimal due to
the large lenses required to focus the light signal to the video camera. Degradation of spatial resolution, field uniformity, signal-to-noise (SNR), and field flatness all contributed to minimizing the utility of this detector type.
LIQUID IONIZATION CHAMBERS
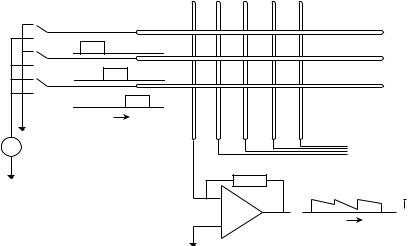
The liquid ionization chamber (LIC) is based on a design proposed by Wickman (12), who proposed to use liquid as an ionization medium to increase the efficiency of ionization chambers. Indeed, the introduction of isooctane increased the signal level by over a factor of 10, but also deleteriously increased the recombination of the electrons due to their low mobility. A first prototype was built by Meertens et al. (13) using two printed circuit boards with perpendicular electrode strips. This resulted in a 30 30 matrix of ionization chambers, and was further refined by van Herk et al. (14) to include 128 128 and finally 256 256 matrices.
To obtain an image, the matrix is scanned row by row, by successively switching high voltage to different row electrodes and measuring all column electrodes. The ionization chamber polarizing voltage is typically 300 V, which is comparable to the voltage applied over a regular megavoltage ionization chamber. The typical current produced by the chamber is of the order of 100 pA. Due to the high voltage switching there is a limit on the speed with which the image may be obtained.
In most of the commercially available imagers, 1 s is required to readout the complete matrix. Figure 1 shows a schematic diagram of a EPID. The LIC is efficient in that it is able to obtain information constantly in between readouts. The low recombination rate (a ’ 4.510 16 m3/s) of the ions in the liquid makes that the signal accumulates during radiation and provides an averaging effect.
Multiple Detector Combinations
An alternative way to obtain two-dimensional (2D) transmission images is to use a line detector much like the ones found in computer–tomography devices. They consist of a
Figure 1. Implanted gold seeds, imaged using a flat-panel portal imager.
|
1 |
2 |
3 |
4 |
5 |
|
|
|
|
|
|
|
1 |
|
|
|
|
|
|
2 |
|
|
|
|
|
|
3 |
|
|
|
|
|
Chamber |
|
|
t |
|
|
|
electrodes |
|
|
Electrode |
|
|
|
|
|
HV |
voltages |
|
|
|
|
To other |
|
|
|
|
|
electrometers |
|
|
|
Electrometer 1 |
|
|||
|
|
|
|
|||
|
|
|
|
|
I1,1 |
I1,2 I1,3 |
|
|
|
|
|
t |
I |
|
|
|
|
|
Ionization current |
|
line of point detectors, which usually contain a phosphorescent material and an optical light detector (15). Alternatively, Lam et al. (16) constructed a device containing 256 silicon diodes. The line of detectors is scanned through the field in a mechanical fashion. However, this approach is time intensive and not appropriate for clinical techniques such as respiratory gated radiotherapy for treatment of lung cancer where the exiting photon energy fluence is of a dynamic nature.
Flat Panel Technology
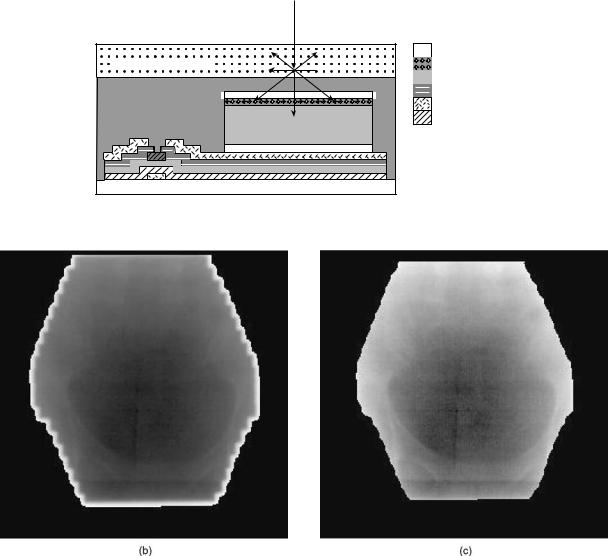
The advance of flat-panel displays, where the use of amorphous silicon created surfaces that locally behaved as a crystalline material, allowed for lithography of integrated circuits. The same thin-film technology (TFT) was used to generate photodiode circuits detecting optical light. The TFT is deposited on a glass substrate of 1 mm thick as is shown in Fig. 2. One of the major advan-
IMAGING DEVICES |
91 |
tages of these circuits is that they are highly radiation resistant and can be placed directly in a radiation beam. As with computer integrated circuit chip technology, the TFT EPID can be etched with a resolution of a few micrometers, permitting construction of a large detector matrix. As the photodiodes only detect visible light, a phosphorescent screen is used to perform the conversion much as for camera-based EPIDs. The TFT EPID is nonconducting during the radiation. To read out the TFT, a voltage bias is applied to allow collected charge to flow between the photodiode and an external amplifier. An amplifier records this charge, which is proportional to the light intensity. The TFT EPID array has a maximum readout rate of 25 Hz. In comparison to the camera-based EPID system, the large TFT detectors are designed to be in direct contact with the conversion screen, thus eliminating the poor optical coupling and efficiency intrinsic to the camera-based systems.
|
Incident X ray |
|
Indium tin oxide |
Converting phosphor |
p-doped Si |
|
a-Si:H |
Passivation |
n-doped Si |
|
Metal |
|
Dielectric |
|
|
|
|
|
|
|
|
|
|
|
|
|
|
|
|
|
|
|
|
|
|
|
|
|
|
|
|
|
|
|
|
|
|
|
|
|
|
|
|
|
|
Glass substrate |
|
|
|
|
TFT |
|
|
|
Photodiode |
|
|
|
|
|
|
|
|
|
(a) |
|
Figure 2. Schematic cross-section (not to scale) of a single a-Si:H imaging pixel.
92 IMAGING DEVICES
|
|
|
|
|
|
|
|
|
|
|
|
|
|
|
|
|
|
|
|
|
|
|
|
|
|
|
|
|
|
|
|
|
|
|
|
|
|
|
|
|
|
|
|
|
|
|
|
|
|
|
|
|
|
|
|
|
|
|
|
|
|
|
|
|
|
|
|
|
|
|
|
|
|
|
(a) |
|
|
|
|
|
|
|
|
|
|
|
(b) |
||||||||||||
Figure 3. Illustration of EPID conversion screens used to trap optical light. Fig. 3a shows a regular Gd2O2S-screen with optical spread, while Fig. 3b shows a CsI screen which limits optical spread and increases detector resolution.
The resolution and efficiency of flat-panel imagers are theoretically superior to those from camera-based and LIC EPIDs. Research performed by Munro et al. (17) indicates that the amorphous silicon imager is X-ray quantum limited, and that the resolution is limited by the spread of the optical photons in the imager. The increase in quality and the compact size of TFT EPIDs means that they may be easily installed onto a linac using a robotic arm. Consequently, TFT EPIDs are now the only type of detectors commercially available. Efforts are underway to replace the current conversion screens, which usually are Gd2O2S phosphors, with CsI, which can be grown as single crystals the size of a pixel. The optical light is then trapped in a manner similar to an optical fiber, and therefore optical spread is eliminated, as shown in Fig. 3.
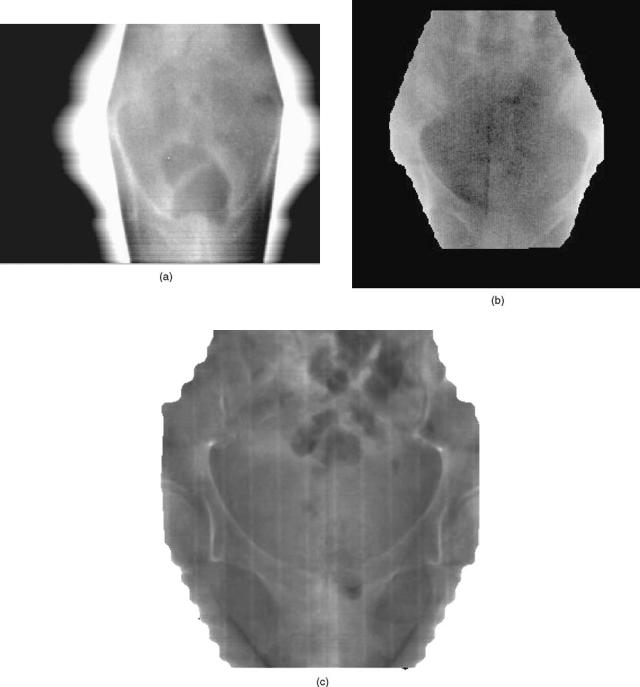
Figure 4 shows pelvic images taken with a camerabased detector, LIC, and flat-panel imager.
EPID APPLICATIONS
Replacement of Radiographic Film
Just as is common in radiology departments, electronic acquisition and management of imaging data is quickly becoming standard practice. Because of the fast pace of detector evolution in the past decade, EPID technology is facilitating hospital-wide imaging digitization. However, to understand why widespread implementation of EPID systems has not yet occurred, it is important to perform a brief cost analysis.
Compared to radiographic film-based portal imaging, up-front capital expenditures for EPID systems are about a factor of 5 larger (e.g., $25,000 vs. 125,000). However, on-going costs associated with an EPID system as compared to a radiographic film-based portal imaging program are much less. For example, regular purchasing of film and maintenance of a film processor (including silver harvesting) is not required with an EPID program. This cost-analysis makes EPID highly competitive given the digital direction facing modern health care.
With direct image digitization comes the ability to transmit data as required for telemedicine. Furthermore, imaging data storage and retrieval, as required for radi-
ology picture archiving and communication systems (PACS), has additional advantages over conventional radiographic film storage. In radiation oncology departments, it is now commonplace for record-and-verify systems to be coupled to an electronic patient charting system. By storing the EPID images in this domain, many of the concerns for patient record keeping, retrieval, and preservation of treatment confidentiality are overcome.
Improvement of Patient Positioning
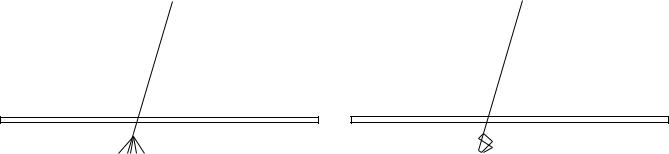
The original purpose of portal imaging is to reduce the incidence and extent of errors made during radiation treatment. The type of errors can be categorized as gross errors and stochastic errors. Examples of such errors are shown in Fig. 5. The gross errors occur only once and when detected can be removed from the treatment after one fraction. Stochastic errors contain a random component, which implies that the error changes from day to day. Errors and QA-problems can also introduce a systematic component hidden by the random component, which can only be corrected for if it’s extent is known.
To reduce stochastic errors, there are two general methodologies, onor off-line corrections. The most straightforward methodology uses on-line correction where an image is obtained in ‘‘localization mode’’ where minimal dose to the patient is applied. If a discrepancy is observed in the patient setup, and if this discrepancy is larger than a predetermined threshold or action level, efforts are taken to eliminate the error by changing the patient position or changing the treatment configuration. The aforementioned threshold is based on the precision to which position can be determined and with which the patient setup correction can be applied. Given the digital nature of EPID images, it is possible to increase the accuracy using computerized algorithms to objectively measure patient positioning with respect to the treatment field (18–21). This approach has not been widely adopted, mainly due to the perceived labor intensity and some medico-legal aspects. However, this may change with the advent of other on-line repositioning techniques (cf. ultrasound-based repositioning) and increased process automation.
Weekly port-filming is the standard procedure in the QA of external beam radiation therapy, which generally
IMAGING DEVICES |
93 |
Figure 4. A comparison of pelvic images taken with three different types of EPIDs: 4a) a camerabased system, 4b) a liquid ionization chamber system, and 4c) a amorphous silicon (a-Si:H) flat panel imaging system.
implies that a sample of 4 positions is taken out of a 20 fraction treatment. Errors are corrected after the first image. An interesting study by Valicente et al. (2), showed that this practice is suboptimal. The use of EPIDs allows us to obtain images in a more economical way. Most off-line correction strategies assume that the distribution formed by all consecutive errors is a normal distribution characterized by the mean error and the standard deviation calculated as in
Mean: |
|
|
|
|
|
|
|
X |
|
|
|
|
|
|
|
|
1 |
|
|
|
|||
|
|
hxi ¼ |
|
|
i¼1xi |
|
ð1Þ |
||||
|
N |
|
|||||||||
Standard Deviation: |
|
|
|
|
|
|
|
|
|
||
|
vi |
||||||||||
|
u |
|
|
|
X |
|
|
|
|||
s |
|
|
1 |
|
|
|
|
N |
x x |
|
2 |
|
t |
|
|
|
|
|
|
|
|
|
|
|
¼ u |
N |
|
1 |
|
i 1 |
ðh i |
Þ |
|
||
|
ð |
|
Þ |
|
¼ |
|
|
|
|||
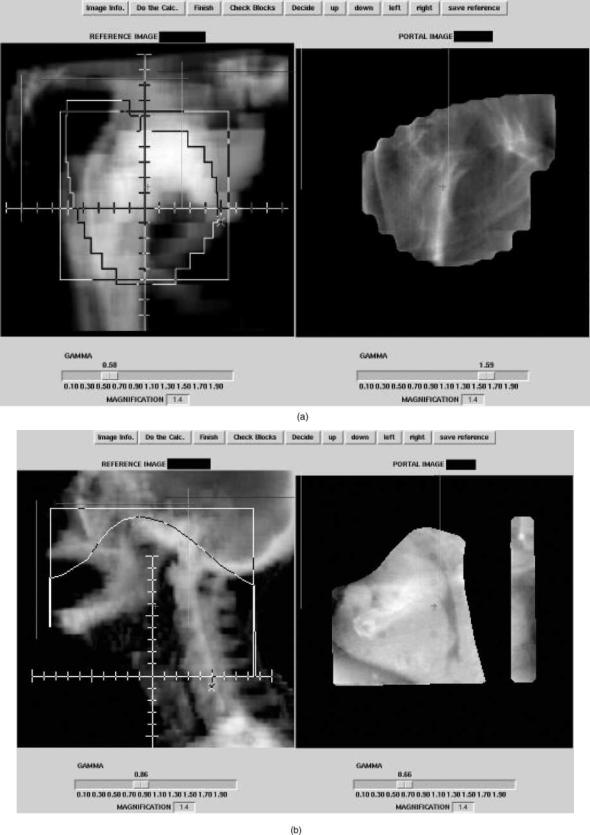
Figure 5. Examples of setup errors. Reference images on the right are digitally reconstructed radiographs with the correct setup. On the left are the measured portal images. (a) Faulty collimator angle. (b) Wrong blocking used. (c) Wrong MLC file. (d) Patient positioning error.
94
Figure 5. (Continued)
95
96 IMAGING DEVICES
By repeated sampling of the distribution (e.g., taking port films), the strategy estimates the value of hxi as close as possible and corrects for the error, which will reduce the systematic error in the treatment. Several groups have studied the implications of this strategy and its variations. The most successful approach seems to be the following strategy: The set-up variations are recorded and averaged. This is compared to an action level that depends on how many samples have been taken already (the level shrinks as the the amount of information on the systematic error increases). These studies showed that systematic errors could be reduced to 2 mm (22).
Organ Motion
One of the major reasons for use of EPIDs is the fact that the patients anatomy and position vary from those used for treatment planning purposes. The factors involving this variation are
Patient movement.
Patient positioning inaccuracies.
Organ motion.
Any of these factors will influence the actual dose distribution to be different from that obtained using treatment planning. It is straightforward to correct for the first two problems using portal imaging as the patients position is typically well-characterized using bony anatomy. An excellent compilation on the incidence, extent, and repercussions of organ movement was performed by Langen and Jones (23). Efforts to incorporate organ movement during radiotherapy treatment planning involves enlarging the target to be treated. Sophisticated algorithms that calculate the extent of these enlargements were developed independently by Stroom et al. (24) and by van Herk et al. (25). The general framework for this enlargement is given in ICRU 50 and ICRU 60 (26,27). In these reports the gross target volume (GTV) is defined as the volume containing demonstrated tumor. A margin is added to the GTV to account for suspected microscopic tumor involvement, and is defined as the clinical target volume (CTV). Finally, the planning target volume (PTV) is defined by the CTV and an additional margin to allow for geometrical variations such as patient movement, positioning errors, and organ motion. The margins added to GTV and CTV can substantially increase the PTV since the margins are applied in three dimensions. Because of volume effects of radiation therapy, there is a tendency to minimize the PTV by increasing the precision of the treatment. As explained above, EPIDs are able to minimize uncertainties caused by patient motion and positioning errors using offor on-line correction strategies.
Except in a few cases like in lung or where air pockets are present (24,28), the target is virtually indiscernible using X rays. To solve this problem, other modalities, like CT (29) and ultrasound (30,31), have been used to determine the position of the organ. The EPIDs can also be used to image the position of organs if radioopaque markers are implanted. The markers need to be of high density and migration needs to be limited. The efficacy
and feasibility of using markers with EPIDs was studied by Balter et al. (32), application of the use of markers have been extensively studied by Pouliot and co-workers (33). The use of markers is becoming more popular and EPID systems are being augmented with software to detect markers as well as perform the requisite positional calculations.
Quality Assurance and In Vivo Dosimetry
In 2001, Task Group No. 58 of the American Association of Physicists in Medicine Radiation Therapy Committee issued a protocol to define the standard-of-care for performing EPID QA on a daily, monthly, and annual basis (34). In this protocol, a quality assurance program is proposed where daily checks of EPID system performance, image quality, and safety interlocks are performed by a radiation therapy technologist. In addition to reviewing results and independently performing checks conducted by the technologist, a medical physicist should conduct the following checks on a monthly basis: perform constancy check of SNR, resolution, and localization; inspect images for artifacts; do a mechanical inspection of all EPID components; and maintain the computer system. The annual QA tasks are also performed by the medical physicist, and include all of the above tasks plus a full check of the EPID geometric localization accuracy. By performing these QA tasks, the radiotherapy department may be reasonably assured of a reliable EPID system for clinical use.
The QA tests typically utilize a vendor-supplied phantom designed to facilitate evaluation of the aforementioned tasks. Since clinical linacs are typically dual energy (e.g., 6 and 15 MV) in design, tests are applied to both photon energies. As expected, the lower photon energy will demonstrate improved image quality (e.g., SNR and spatial resolution). Since many EPID systems utilize sophisticated computer software utilities, testing of this software in a realistic setting is an integral component of the EPID quality management program. As can be expected with tests that are subjective in nature, it is recommended that multiple users be employed to evaluate the subjective criteria so as to minimize user bias.
In addition to the aforementioned advantages, an EPID system permits unique opportunities of radiotherapy treatment QA. Treatment fields are typically blocked with beam modifiers to account for irregularities in patient shape. These beam modifiers include compensating materials when minor changes are required, or beam wedges when gross changes are required. Because modern linacs have features like dynamic wedges and dynamic multileaf collimators, the nonintegral approach that EPIDs offer over radiographic film (i.e., the ability to obtain several images at different stages during a dynamic process) permits continued high-quality QA. Due to the electronic nature of EPID measurement of the photon energy fluence exiting a patient, one can perform exit dosimetry and quantitative comparisons with treatment planning intentions (35). However, these efforts are currently research driven, and widespread clinical implementation may not be expected for a few years.
BIBLIOGRAPHY
1.AAPM report No. 24: Radiotherapy portal imaging quality, 1987.
2.Valicenti RK, Michalski JM, Bosch WR, Gerber R, Graham MV, Cheng A, Purdy JA, Perez CA. Is weekly port filming adequate for verifying patient postion in modern radiation therapy? Int J Rad Oncol Biol Phys 1994;30(2):431–438.
3.Moseley J, Munro P. Display equalization: A new display method for portal images. Med Phys 1993;20(1):99–102.
4.Van den Heuvel F, Han I, Chungbin S, Strowbridge A, TekyiMensa S, Ragan D. Development and clinical implementation of an enhanced display algorithm for use in networked electronic portal imaging. Int J Rad Oncol Biol Phys 1999;45:1041–1053.
5.Jaffray DA, Batista JJ, Fenster A, Munro P. X-ray scatter in megavoltage transmission radiography: Physical characteristics and influence on image quality. Med Phys 1994;21(1):45–60.
6.Bailey NA, Horn RA, Kamp TD. Fluoroscopic visualization of megavoltage therapeutic x-ray beams. Int J Radiat Oncol Biol Phys 1980;6:935–939.
7.Leszczynski KW, Shalev S, Cosby S. A digital video system for on-line portal verification. Medical Imaging IV: Image Formation. SPIE 1990;1231:401–405.
8.Leong J. Use of digital fluorscopy as an on-line verification device in radiation therapy. Phys Med Biol 1986;31:985–992.
9.Munro P, Rawlinson JA, Fenster A. A digital fluoroscopic imaging device for radiotherapy localization. Int J Rad Oncol Biol Phys 1990;18:641–649.
10.Visser AG, Huizenga H, Althof VGM, Swanenburg BN. Performance of a prototype fluoroscopic radiotherapy imaging system. Int J Rad Oncol Biol Phys 1990;18:43–50.
11.Wong JW, Slessinger ED, Hermes RE, Offutt CJ, Roy T, Vannier MW. Portal dose images I: Quantitative treatment plan verification. Int J Rad Oncol Biol Phys 1990;18:1455– 1463.
12.Wickman GA. A liquid filled ionisation chamber with high spatial reslution. Phys Med Biol 1974;19:66–72.
13.Meertens H, van Herk M, Weeda J. A liquid ionisation detector for digitital radiography of therapeutic megavoltage photon beams. Phys Med Biol 1985;30:313–321.
14.Van Herk M, Meertens H. A matrix ionization chamber imaging device for on-line patient set-up verification during radiotherapy. Radiother Oncol 11:369–378.
15.Morton EJ, Swindell W, Evans PM. A linear array, scintillation crystal-photodiode detector for megavoltage imaging. Med Phys 1991;18:681–691.
16.Lam KS, Partowmah M, Lam WC. An on-line electronic portal imaging system for external beam radiotherapy. Br J Radiol 1986;59:1007–1013.
17.Munro P, Bouius DC. X-ray quantum limited portal imaging using amorphous silicon flat-panel arrays. Med Phys 1998;25(5):689–702.
18.De Neve W, Van den Heuvel F, De Beukeleer M, Coghe M, Verellen D, Thon L, De Roover P, Roelstraete A, Storme G. Interactive use of on-line portal imaging in pelvic radiation. Int J Rad Oncol Biol Phys 1993;25:517–524.
19.Van den Heuvel F, De Neve W, Verellen D, Coghe M, Coen V, Storme G. Clinical implementation of an objective computeraided protocol for intervention in intra-treatment correction using electronic portal imaging. Radiother Oncol 1995;35:232– 239.
20.Balter JM, Pelizarri CA, Chen GTY. Correlation of projection radiographs in radiation therapy using open curve segments and points. Med Phys Mar.–Apr. 1992;19(2): 329–334.
21.Bijhold J, Lebesque JV, Hart AAM, Vijlbrief RE. Maximizing setup accuracy using portal images as applied to a conformal
IMAGING DEVICES |
97 |
boost technique for prostate cancer. Radiother Oncol 1992;24:261–271.
22.Bel A, Vos PH, Rodrigus PTR, Creutzberg CL, Visser AG, Stroom JC, Lebesque JV. High-precision prostate cancer irradiation by clinical application of an offine patient setup verification procedure, using portal imaging. Int J Rad Oncol Biol Phys 1996;35(2).
23.Langen KM, Jones DT. Organ motion and its management. Int J Radiat Oncol Biol Phys May 1 2001;50(1):265– 278.
24.Stroom JC, Boer de HC, Huizenga H, Visser AG. Inclusion of geometrical uncertainties in radiotherapy treatment planning by means of coverage probability. Int J Radiat Oncol Biol Phys Mar 1 1999;43(4):905–919.
25.van Herk M, Remeijer P, Lebesque JV. Inclusion of geometric uncertainties in treatment plan evaluation. Int J Radiat Oncol Biol Phys Apr 1 2002;52(5):1407–1422.
26.ICRU and International Commission on Radiation Units and Measurements. Prescribing, recording and reporting photon beam therapy. ICRU Report 1993; 50.
27.ICRU and International Commission on Radiation Units and Measurements. Prescribing, recording and reporting photon beam therapy, Supplement to ICRU 50. ICRU Report 1999; 62.
28.Erridge SC, Seppenwoolde Y, Muller SH, van Herk M, De Jaeger K, Belderbos JSA, Boersma LJ, Lebesque JV. Portal imaging to assess set-up errors, tumor motion and tumor shrinkage during conformal radiotherapy of non-small cell lung cancer. Radiother Oncol 2003;66(1):75–85.
29.Jaffray DA, Drake DG, Moreau M, Martinez AA, Wong JW. Radiographic and tomographic imaging system integrated into a medical linear accelerator for localization of bone and soft-tissue targets. Int J Radiat Oncol Biol Phys Oct 1 1999;45(3):773–789.
30.Lattanzi J, McNeeley S, Hanlon A, Schultheiss TE, Hanks GE. Ultrasound-based stereotactic guidance of precision conformal external beam radiation therapy in clinically localized prostate cancer. Urology Jan 2000;55(1): 73–78.
31.Serago CF, Chungbin SJ, Buskirk SJ, Ezzell GA, Collie AC, Vora SA. Initial experience with ultrasound localization for positioning prostate cancer patients for external beam radiotherapy. Int J Radiat Oncol Biol Phys Aug 1 2002;53(5):1130– 1138.
32.Balter JM, Sandler HM, Lam K, Bree RL, Lichter AS,
ten Haken RK. Measurement of prostate movement over the course of routine radiotherapy using implanted markers. Int J Rad Oncol Biol Phys 1995;31(1):113– 118.
33.Vigneault E, Pouliot J, Laverdiere J, Roy J, Dorion M. Electronic portal imaging device detection of radioopaque markers for the evaluation of prostate position during megavoltage irradiation: A clinical study. Int J Radiat Oncol Biol Phys Jan 1 1997;37(1): 205–212.
34.Herman MG, Balter JM, Jaffray DA, McGee KP, Munro P, Shalev S, van Herk M, Wong JW. Clinical use of electronic portal imaging: report of radiation therapy committee task group 58. Med Phys May 2001;28(5):712– 737.
35.Boellaard R, Van Herk M, Mijnheer BJ. A convolution model to convert transmission dose images to exit dose distributions. Med Phys 1997;24(2):189–199.
See also COMPUTED TOMOGRAPHY; MAGNETIC RESONANCE IMAGING;
PHOTOGRAPHY, MEDICAL; POSITRON EMISSION TOMOGRAPHY; ULTRASONIC IMAGING.