

162 INTRAAORTIC BALLOON PUMP
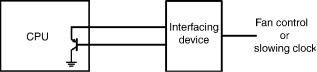
Figure 7. A scheme for monitoring the temperature of a CPU to protect it from overheating by fan control or by slowing down the clock.
these sensors can be used effectively, and undoubtedly their use will be wide spread in the near future.
Digital output IC temperature sensors show the most promise. Using such sensors, thermometers can be made without using analog components, and digital signals are convenient when a photocoupler is used for isolation.
Medical thermometry requires a relatively high degree of accuracy within a narrow temperature range. An absolute accuracy of 0.1 8C is required for body temperature measurements. However, this is hard to attain without individual calibration using most temperature sensors. While adjustment of the trimmer resistor has been used in many thermometer units, correcting data using a PC employing initially obtained correction factors will be much simpler, especially when many sensors are used, and digital output IC temperature sensors are advantageous for such a purpose.
Fabricating different types of sensors, such as force and temperature sensors, in one chip, and then applying them in robot hands to mimic all the sensing modalities of human skin, is another promising field. In such applications, the digital output capability will be a great advantage.
BIBLIOGRAPHY
1.Mackay RS. Endoradiosonde. Nature (London) 1957;179: 1239–1240.
2.Harris H. Concerning a thermometer with solid-state diodes. Sci Amer 1961;204(6):192.
3. MacNamara AG. Semiconductor diodes and transistors as electrical thermometers. Rev Sci Instrum 1963;33: 1091– 1093.
4.Cohen BG, Snow WB, Tretola AR. GaAs p-n junction diodes for wide range thermometry. Rev Sci Instrum 1963; 34:1091– 1093.
5.Griffiths B, Stow CD, Syms PH. An accurate diode thermometer for use in thermal gradient chambers. J Phys E 1974; 7:710–714.
6.Felimban AA, Sandiford DJ. Transistors as absolute thermometers. J Phys E 1974;7:341–342.
7.Davis CE, Coates PB. Linearization of silicon junction characteristics for temperature measurement. J Phys E 1977;10:613–619.
8.O’Neil P, Derrington C. Transistors—a hot tip for accurate temperature sensing. Electronics 1979;52(21):137–141.
9.Sah C, Noyce RN, Shockley W. Carrier generation and recombination in p-n junctions and p-n junction characteristics. Proc IRE 1957;45:1228–1243.
10.Sah C. Effect of surface recombination and channel on p-n junction transistor characteristics. IRE Trans Electron Devices 1962;ED9:94–108.
11.Sclar N, Pollock DB. On diode thermometers. Solid State Electron 1972;15:473–480.
12.Verster TC. p-n junction as an ultralinear calculable thermometer. Electron Lett 1968;4:175–176.
13.Ruhle RA. Solid-state temperature sensor outperforms previous transducers. Electronics 1975;48(6):127–180.
14.Ohte A, Yamagata M. A precision silicon transistor thermometer. IEEE Trans Instrum Meas 1977;IM-26:335–341.
15.Vester TC. Dual transistor as thermometer probe. Rev Sci Instrum 1969;40:174–175.
16.Timko MP. A two-terminal IC temperature transducer. IEEE J Solid-State Circuits 1976;SC-11:784–788.
17.Sheingold DH, editor. Transistor Interfacing Handbook, A Guide to Analog Signal Conditioning. Norwood, MA: Analog Devices; 1980. p 153–177.
Further Reading
Sze SM. Semiconductor Devices—Physics and Technology. New York: John Wiley & Sons; 1985.
¨
Togawa T, Tamura T, Oberg PA. Biomedical Transducers and Instruments. Boca Raton, FL: CRC Press; 1997.
Moore BD. IC temperature sensors find the hot spot. EDN July 2/ 98, 1998; 99–110.
Frank R. Semiconductor junction thermometers. In: Webster JG, editor. The Measurement, Instrumentation, and Sensors Handbook. Boca Raton, FL: CRC Press; 1999. p 32/74–32/87.
See also CAPACITIVE MICROSENSORS FOR BIOMEDICAL APPLICATIONS; ION-
SENSITIVE FIELD EFFECT TRANSISTORS; THERMOMETRY.
INTERFERONS. See IMMUNOTHERAPY.
INTERSTITIAL HYPERTHERMIA. See
HYPERTHERMIA, INTERSTITIAL.
INTRAAORTIC BALLOON PUMP
PETER WELLER
City University
London, United Kingdom
DARREN MORROW
Royal Adelaide Hospital
Adelaide, Australia
INTRODUCTION
The heart is a pump made of cardiac muscle or myocardium. It has four pumping chambers, namely, a right and left atrium and a right and left ventricle. The atria act as primer pumps for the ventricles. The right ventricle pumps deoxygenated blood returning from the body through the pulmonary artery and into the lungs. This is called the pulmonary circulation. The left ventricle pumps oxygenated blood returning from the lungs through the aorta and into the rest of the body. This is called the systemic circulation.
The heart also has four one-way valves that prevent the backward flow of blood. The tricuspid valve lies between the right atrium and right ventricle while the pulmonary valve lies between the right ventricle and the pulmonary artery. Similarly, the mitral valve lies between the left atrium and the left ventricle while the aortic valve lies between the left ventricle and the aorta.
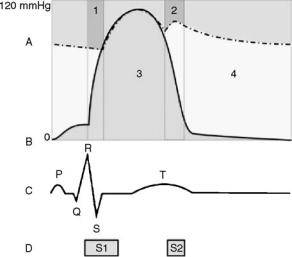
Figure 1. The relationship between the aortic pressure (A – dashed line), the ventricular pressure (B – solid line), the electrocardiogram (C) and the heart sounds (D). Region 1 ¼ isovolumetric contraction and Region 2 ¼ isovolumetric relaxation, Region 3 (green) ¼ tension time index (TTI) and Region 4 (yellow) ¼ diastolic pressure time index (DPTI). S1 represents the closing of mitral and tricuspid valves, S2 represents the closure of aortic and pulmonary valves.
CARDIAC CYCLE
The heart pumps rhythmically. The cardiac cycle is the sequence of events that take place in the heart during one heartbeat (Fig. 1). Thus, the duration of the cardiac cycle varies inversely with the heart rate. At a typical resting heart rate of 60 beats per minute (bpm), the cardiac cycle lasts 1 s or 1000 ms.
Mechanical Events
One cardiac cycle consists of a period of contraction called systole followed by a period of relaxation called diastole. The duration of systole, called the systolic time interval (STI), is relatively constant, but the duration of diastole, called the diastolic time interval (DTI), varies with the heart rate. Thus, when the heart rate increases, the DTI shortens.
When the left ventricle contracts, the pressure in the left ventricle rises above the pressure in the left atrium and the mitral valve closes. Soon afterward, the pressure in the left ventricle rises above the pressure in the aorta and the aortic valve opens. Blood flows from the left ventricle into the aorta. The period between closing of the mitral valve and opening of the aortic valve is called isovolumetric contraction.
When the left ventricle relaxes, the pressure in the left ventricle falls below the pressure in the aorta and the aortic valve closes. This causes a momentary drop in pressure in the aorta called the dichrotic notch. The period between the opening and closing of the aortic valve is called ventricular ejection. Soon afterward, the pressure in the left ventricle falls below the pressure in the left atrium and the mitral valve opens. Blood flows from the left atrium into the left
INTRAAORTIC BALLOON PUMP |
163 |
ventricle. The period between the closure of the aortic valve and opening of the mitral valve is called isovolumetric relaxation.
The left atrium contracts and relaxes just before the left ventricle. This boosts the blood flow from the left atrium into the left ventricle.
These events are mirrored in the right ventricle and right atrium. However, the pressures in the pulmonary circulation are much lower than the pressures in the systemic circulation.
The movements of the chambers, valves and blood can be imaged noninvasively using ultrasound and this is called an echocardiogram.
Electrical Events
The rhythmical pumping of the heart is caused by waves of electrical impulses that spread through the myocardium from the atria to the ventricles. A recording of these waves is called an electrocardiogram (ECG). The P wave represents atrial contraction. The R wave represents ventricular contraction and signals the beginning of systole. The T wave represents ventricular relaxation and signals the beginning of diastole.
Acoustic Events
The opening and closing of the valves in the heart creates sounds that can be heard at the surface of the chest using a stethoscope. A recording of these sounds is called a phonocardiogram. The first heart sound (S1) represents closure of the mitral and tricuspid valves and signals the beginning of systole. The second heart sound (S2) represents closure of the aortic and pulmonary valves and signals the beginning of diastole.
MYOCARDIAL OXYGEN BALANCE
The systemic circulation delivers oxygenated blood to the body. Body tissues use oxygen to generate energy from the oxidation of fuels. All tissues, including the myocardium, need energy to function. The net delivery of oxygen to the myocardium is called the myocardial oxygen balance.
MOB ¼ MOS MOD
where MOB ¼ myocardial oxygen balance, MOS ¼ myocardial oxygen supply, MOD ¼ myocardial oxygen demand. In the healthy heart the myocardial oxygen balance is positive, that is supply exceeds demand. In the failing heart the balance can be negative, that is demand exceeds supply.
Myocardial Oxygen Supply
The main blood supply of the myocardium comes from the two coronary arteries and their branches. The small amount of blood that reaches the myocardium transmurally from within the chambers of the heart is insignificant. The coronary arteries arise from the aorta just beyond the aortic valve and ramify within the myocardium. Myocardial oxygen supply depends on the coronary blood flow and the amount of oxygen that can be extracted from the blood.

164 INTRAAORTIC BALLOON PUMP
When the heart contracts the coronary arteries are compressed and the coronary blood flow is decreased. The net driving force for coronary blood flow is called the coronary perfusion pressure.
CPP ¼ AP VP
where CPP ¼ coronary perfusion pressure, AP ¼ aortic pressure, VP ¼ ventricular pressure. The coronary circulation is unique because more blood flows during diastole when the ventricular pressure is low than during systole when the ventricular pressure is high. Thus, the coronary blood flow depends on the coronary perfusion pressure, the diastolic time interval and the patency of the coronary arteries. Myocardial oxygen supply is represented by the area between the aortic pressure wave and the left ventricular pressure wave, called the diastolic pressure time index (DPTI).
Myocardial Oxygen Demand
The myocardium uses energy to perform the work of pumping. The work performed by the heart can be estimated by the mean aortic blood pressure multiplied by the cardiac output. Myocardial oxygen demand depends on the heart rate, the systolic wall tension and the cardiac contractility. Systolic wall tension is developed during isovolumetric contraction and depends upon the preload, the afterload and the wall thickness. The preload is the degree to which the left ventricle is filled before it contracts, that is the left ventricular end diastolic volume. The afterload is the pressure in the aorta or the systemic vascular resistance against which the left ventricle contracts. Myocardial oxygen demand is represented by the area under the left ventricular pressure curve, called the tension time index (TTI).
The myocardial oxygen balance is represented by the ratio DPTI:TTI.
THE PATHOPHYSIOLOGY OF LEFT VENTRICULAR PUMP FAILURE
When the left ventricle begins to fail as a pump, the cardiac output falls. Compensatory physiological mechanisms bring about an increase in left ventricular end diastolic volume, heart rate, and systemic vascular resistance. The result is an increase in preload and afterload with a decrease in coronary blood flow. Thus, the myocardial oxygen demand increases while the myocardial oxygen supply decreases. There may come a point when demand exceeds supply resulting in a negative myocardial oxygen balance. The left ventricle is then deprived of oxygen and cannot generate sufficient energy to do the work required of it. The pump failure is therefore exacerbated and this can precipitate a downward spiral of decline eventually ending in death. The therapeutic goal is to reverse this decline and help the failing left ventricle to recover by restoring a positive myocardial oxygen balance. Diuretics to decrease the preload, inotropic drugs to increase the myocardial contractility and vasodilators to decrease the preload and afterload are the mainstay of treatment. However, in the most severely ill patients, pharmacological
Figure 2. The relationship between the ventricular pressure with counterpulsation (A – solid line), without counterpulsation (B- dashed line), IABP balloon inflation (C) and ventricular systole
(D). Region 1 (green) ¼ systolic unloading and Region 2 (yellow) ¼ diastolic augmentation.
measures alone may be insufficient and it is in these extreme circumstances that counterpulsation therapy may be effective.
THE PRINCIPLE OF COUNTERPULSATION
The principle of counterpulsation is the incorporation of an additional pump into the systemic circulation in series with the left ventricle. The pump is operated in synchrony, but out of phase, with the cardiac cycle. Pump systole occurs during ventricular diastole and pump diastole occurs during ventricular systole.
The primary physiological effects of counterpulsation are twofold (Fig. 2): A decrease in the aortic pressure during systole (called systolic unloading). This is evidenced by a decrease in the end diastolic pressure (EDP), the peak systolic pressure (PSP) and the mean systolic pressure (MSP). An increase in the aortic pressure during diastole (called diastolic augmentation). This is evidenced by an increase in the mean diastolic pressure (MDP).
Systolic unloading reduces the work of the left ventricle because it pumps against a lower pressure. This decreases myocardial oxygen demand. Diastolic augmentation increases coronary blood flow because it increases the coronary perfusion pressure. This increases myocardial oxygen supply. Thus, the myocardial oxygen balance is improved.
Among the secondary physiological effects of counterpulsation are increases in the stroke volume (SV, the volume of blood pumped with each heartbeat), the CO (equal to the SV multiplied by the heart rate) and the blood flow to the other vital organs.
HISTORICAL PERSPECTIVE
Counterpulsation was first described in theory in 1958 by Harken (1). It was to be achieved by cannulating the femoral arteries, rapidly withdrawing a set volume of blood during systole and rapidly reinfusing the same volume of blood during diastole. Clauss et al. (2) reported this in clinical practice in 1961 but it was unsuccessful because the rapid movements of blood were difficult to implement and caused severe hemolytic damage to the red blood cells.
INTRAAORTIC BALLOON PUMP |
165 |
In 1958, Kantrowitz and McKennin (3) described counterpulsation achieved by wrapping a part of the diaphragm around the thoracic aorta and stimulating the phrenic nerve, causing contraction of the diaphragm, during diastole. Moulopoulos et al. (4) and Clauss et al.(5) described counterpulsation achieved by intra-aortic balloon pumping in 1962. Operative insertion of the balloon through a surgically exposed femoral artery was necessary. It was inflated during diastole and deflated during systole. In 1968, Kantrowitz et al. (6) reported a successful clinical study.
In 1963, Dennis et al.(7) described external counterpulsation achieved using a pneumatic compression garment that enclosed the legs and lower torso. It was inflated during diastole and deflated during systole. It was reported to be as successful as the IABP in clinical studies but it is not commonly used. Kantrowitz et al. (8) described counterpulsation achieved by a permanently implantable intraaortic balloon in 1972. It was unsuccessful in clinical practice because there remained the need for a connection to an external pump and this provided a portal of entry for infection.
In 1979, following the development of thinner catheters, percutaneous insertion of the intra-aortic balloon through a femoral artery puncture was introduced. This could be performed at the bedside and avoided the need for a surgical operation in most patients. Consequently, intraaortic balloon pumping became the most widely adopted method of counterpulsation.
CLINICAL APPLICATIONS
Indications
The IABP was first used clinically in 1968 by Kantrowitz to support patients with cardiogenic shock after acute myocardial infarction(9). During the 1970s the indications broadened (Table 1) and by 1990 70,000 pump procedures were performed worldwide each year (10) although there is wide variation between different countries and centres. The IABP support has been used successfully in patients with left ventricular failure or cardiogenic shock from many causes including myodarditis, cardiomyopathy, severe cardiac contusions and drug toxicity but the commonest are myocardial infarction and following cardiac surgery. The trend has been a move away from hemodynamic support in pump failure towards the treatment, and even prophylaxis of, acute myocardial ischaemia. Patients can be maintained on the IABP for hours, days or even weeks, particularly when used as a bridge to cardiac transplantation or other definitive treatment (11). Of those who survive to hospital discharge, long-term survival is satisfactory (12).
An early series of 747 IABP procedures in 728 patients between 1968 and 1976 was reported by McEnany et al.
(13). Over the course of the study, they observed that cardiogenic shock or chronic ischaemic left ventricular failure as the indication for IABP fell from 79 to 26% of patients whilst overall in-hospital survival rose from 24 to 65% of patients. They also noted an increase from 38 to 58% of patients undergoing cardiac surgery following IABP insertion. They postulated that broadened indications for, and earlier insertion of, the IABP together with more aggressive surgical treatment of any underlying cardiac lesion led to the improvement in survival. In the later Benchmark Registry of nearly 17,000 IABP procedures performed in 203 hospitals worldwide between 1996 and 2000, the main indications were support for coronary angioplasty (21%), cardiogenic shock (19%), weaning from cardiopulmonary bypass (16%), preoperative support in high risk patients (13%), and refractory unstable angina (12%) (14). The overall in-hospital mortality was 21%.
High risk patients undergoing cardiac surgery may have a better outcome if treated preoperatively with IABP therapy. In a series of 163 patients with a left ventricular ejection fraction of <0.25 and undergoing coronary artery bypass grafting (CABG), the 30 day mortality was reduced from 12 to 3% (15). Similar results were obtained in a small randomized study (16). In a series of 133 patients who underwent CABG off cardiopulmonary bypass between 2000 and 2003, the use of adjuvant preoperative IABP therapy in the 32 highest risk patients led to outcomes comparable with the lower risk patients (17). The use of IABP therapy to improve outcome after coronary angioplasty for acute myocardial infarction remains controversial. Early studies suggested an improved outcome (18–20), but two recent large randomized trials have shown no benefit in haemodynamically stable patients (21,22). A report from the SHOCK Trial Registry showed that the in-hospital mortality in patients with cardiogenic shock after acute myocardial infarction could be reduced from 77% to 47% by combined treatment with thrombolysis and IABP, particularly when followed by coronary revascularization (23).
IABP therapy is used infrequently in children, who commonly suffer from predominantly right ventricular failure associated with congenital heart disease. The greater elasticity of the aorta may limit diastolic augmentation and the more rapid heart rate may make ECG triggering difficult. Echocardiographic triggering has been used as an effective alternative (24,25). Survival rates of 57% (26) and 62% (27) have been reported in small series of carefully selected patients.
Contraindications
The only absolute contraindications to IABP therapy are severe aortic regurgitation and aortic aneurysm or dissection. In patients with severe aorto-iliac vascular disease
Table 1. Indications for IABP Therapy
Left ventricular failure or cardiogenic shock |
Preoperative support before cardiac or non-cardiac surgery |
Refractory unstable angina or ischaemic ventricular arrhythmias |
Adjunct to coronary angioplasty or thrombolyis |
Weaning from cardiopulmonary bypass |
Adjunct to off-bypass cardiac surgery |
Bridge to cardiac transplantation |
|
|
|
166 |
INTRAAORTIC BALLOON PUMP |
|
|
Table 2. |
Complications of IABP Therapy |
|
|
|
|
|
|
Vascular |
|
Balloon-Related |
Other |
|
|
|
|
Hemorrhage |
Gas embolism |
Infection |
|
Aortoiliac dissection |
Entrapment |
Thrombocytopenia |
|
or perforation |
|
|
|
|
|
|
Paraplegia |
Limb ischaemia
Visceral ischaemia
the balloon should not be inserted through the femoral artery.
Complications
The IABP therapy continues to cause a significant number of complications (Table 2), but serious complications are uncommon and directly attributable deaths are rare. Nevertheless, some have argued against its indiscriminate use, feeling that for many patients the risks outweigh the benefits. Kantrowitz reported rates of 41 and 4% for minor and major complications, respectively, in his series of 733 patients. Of these, 29% were vascular (including 7% hemorrhagic) and 22% were infections (28). Vascular complications include haemorrhage from the insertion site and lower limb ischaemia caused by the balloon catheter or sheath occluding the iliac or femoral artery. The vascular status of the lower limbs should be observed closely in patients on IABP therapy. Ischaemia may resolve when the catheter or sheath is removed but surgical intervention including femoral thromboembolectomy, femorofemoral bypass or even amputation is required in up to half of cases (29).
Several risk factors for vascular complications have been identified. They are female gender, diabetes, hypertension, peripheral vascular disease, obesity, old age, sheathed insertion, percutaneous insertion, and insertion via the femoral artery compared to directly into the ascending aorta (13,14,19,28–30). In one study of patients with peripheral vascular disease, the rate of vascular complications was 39% for percutaneous insertion compared to 18% for open insertion (29).
Complications caused by perforation of the balloon are rare, but potentially serious. Embolization of the helium shuttle gas can result in stroke or death. Coagulation of blood within the balloon can result in balloon entrapment. In this situation the instillation of thrombolytic agents may allow the balloon to be retrieved percutaneously but otherwise open surgery is required. It is therefore mandatory to remove the balloon immediately if any blood is detected within the pneumatic system.
Thrombocytopenia (a reduction in the number of platelets) developed in one-half of patients but they rapidly recovered when the balloon was removed (31).
EQUIPMENT FOR CLINICAL APPLICATION
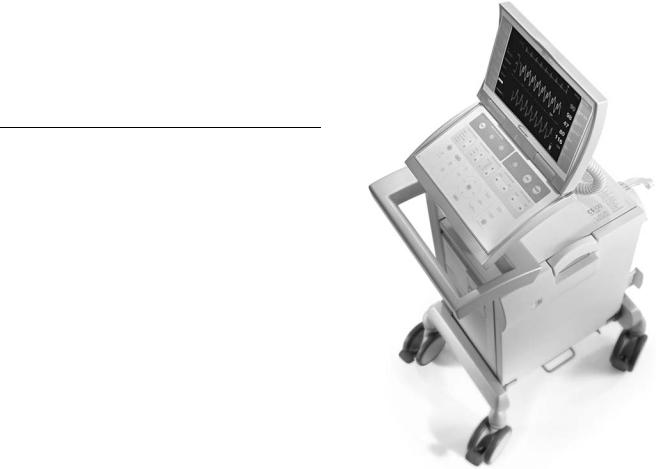
The IABP consists of a balloon catheter and movable drive console. A monitor on the drive console displays the arterial pressure wave and the ECG. Commercial consoles have
Figure 3. A commercial IABP device. (Courtesy of Datascope Corp.)
controls that allow the operator to select the assist ratio and trigger mode and adjust the timing of inflation and deflation and the inflation volume of the balloon. The drive console also contains a helium tank for balloon inflation and a battery as a backup power source in the event that the mains electricity supply is interrupted. In common with medical equipment the IABP console conforms to international safety standards. Figure 3 shows a current commercial model.
The balloon is made of inelastic polyurethane and is cylindrical in shape. Balloons are available in volumes from 25 to 40 cm3 and the correct size is selected according to the height of the patient. The balloon is mounted at the end of a double-lumen catheter. Modern catheters have an outer diameter of 7–8 French gauge. The inner lumen is open at the tip to allow insertion over a guidewire and direct measurement of the aortic blood pressure after the guidewire is removed. The outer lumen forms a closed system connecting the balloon to a pneumatic pump chamber within the drive console. Two views of a current balloon catheter are shown in Fig. 4.
The balloon catheter is most commonly inserted percutaneously through the femoral artery in the groin over a guidewire using a traditional or modified Seldinger technique. An intra-arterial sheath is used to secure and
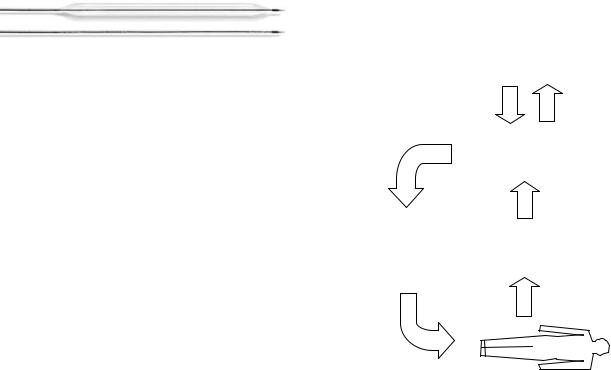
Figure 4. An IABP catheter. (Courtesy of Datascope Corp.) In both inflated (top image) and uninflated (bottom image) modes.
protect the access site before insertion of the balloon catheter. However, because the sheath has a larger outer diameter than the balloon catheter it can increase the risk of vascular complications and sheathless insertion has now been introduced. Under fluoroscopic guidance the balloon is positioned in the descending thoracic aorta just beyond the origin of the left subclavian artery. Alternatively, the balloon can be inserted through the iliac, axillary or subclavian arteries or directly into the ascending aorta during open surgery.
A shuttle gas is pumped back and forth between the pump chamber and the balloon to cause inflation and deflation. The ideal shuttle gas would have a low density combined with a high solubility in blood. A dense gas is slow to move along the catheter. This introduces a significant delay between the opening of the valves in the pump chamber and the inflation or deflation of the balloon making correct timing more difficult to achieve. An insoluble gas is unsafe if the balloon was to leak or burst allowing it to escape into the blood. There it may form bubbles leading to potentially fatal gas embolism. Originally, carbon dioxide was used as the shuttle gas. It is a dense gas but dissolves easily in blood. More recently, helium has been used as the shuttle gas. It is a less dense gas but dissolves less easily in blood.
Pumping is initiated with an assist ratio of 1:2, which means that one in every two heartbeats is assisted. This allows the arterial pressure wave of each assisted beat to be compared with an unassisted beat to facilitate correct timing.
Pumping is continued with an assist ratio of 1:1, which means that every beat is assisted. As the patient recovers, they can be weaned from the IABP by periodically decreasing the assist ratio until pumping is eventually discontinued.
Weaning can also be achieved by periodically decreasing the inflation volume of the balloon. However, this can lead to problems with blood clotting in the folds of the underinflated balloon and it is not commonly used.
CONTROL OF IABP
The inflation/deflation cycle of the intra-aortic balloon pump is controlled by a closed loop circuit as illustrated in Fig. 5.
The physiological variables required for determining triggering are measured, filtered and converted into digital signals. These are used in enable the control strategy to determine the appropriate inflation and deflation times of the balloon. This information is then passed to the pneumatic circuit for balloon operation. The results of this strategy are then feed back to the console via a new set of patient variables. The actions of the controller are dis-
INTRAAORTIC BALLOON PUMP |
167 |
|
|
|
|
|
|
|
Monitor |
|
|||
|
|
|
|
|
|
|
Console |
|
|||
|
|
Control strategy |
|
Information for |
|||||||
|
|
|
|||||||||
|
|
from user |
|
|
|
|
displaying to user |
||||
|
|
|
|
|
|
|
|
|
|
||
Inflation & |
|
|
|
|
|
Control Strategy |
|
|
|
||
|
|
|
|
|
|
|
|
|
|
||
Deflation |
|
|
|
|
|
|
|
|
|
|
|
strategy |
|
|
|
|
|
|
|
|
|
|
|
|
|
|
|
|
Enhanced physiological |
||||||
|
|
|
|
|
|
|
|||||
|
|
|
|
|
|
|
measurements |
||||
|
|
|
|
|
|
|
|
|
|
|
|
|
Pneumatic |
|
|
|
Analogue to Digital |
|
|
||||
|
System |
|
|
|
|
|
|||||
|
|
|
|
|
Converters and Filters |
|
|
||||
|
|
|
|
|
|
|
|||||
|
|
|
|
|
|
|
|
|
|
|
|
|
|
|
|
|
|
|
Measurements of |
||||
|
|
|
|
|
|
|
physiological variables |
||||
Balloon |
|
|
|
|
|
|
|
|
|
|
|
inflation & |
|
|
|
|
|
|
|
|
|
|
|
|
|
|
|
|
|
|
|
|
|
||
deflation |
|
|
|
|
|
|
|
|
|
|
|
|
|
|
|
|
|
|
|
|
|
|
|
Figure 5. Closed-loop circuit |
for IABP control. The arrows |
||||||||||
indicate the flow of information for controlling the IABP.
played on the console monitor. Additionally the control strategy can be set by the clinician.
TRIGGERING
The drive console requires a trigger signal to synchronise with the cardiac cycle. The trigger signal indicates the start of ventricular systole.
Commercial consoles have several modes of triggering: The ECG trigger, where the trigger signal is the R wave of the ECG. This is the most commonly used mode of triggering. Blood pressure trigger, where the trigger signal is the upstroke of the arterial pressure wave. This is used when the ECG signal is too noisy to allow reliable R wave recognition. Pacer trigger, where the trigger signal is the pacing spike of the ECG. This is used when the patient has an implanted cardiac pacemaker. Internal trigger, where the trigger signal is generated internally by the console at a set rate. This is used during cardiac surgery when the heartbeat is temporarily arrested.
TIMING
The safety and efficacy of balloon pumping is dependent upon the correct timing of balloon inflation and deflation during the cardiac cycle. Inflation should occur during the isovolumetric relaxation period of ventricular diastole. Too early inflation is unsafe because it overlaps the ejection period of ventricular systole, impedes ejection and increases the work of the heart. Too late inflation is less effective because it reduces diastolic augmentation.
168 INTRAAORTIC BALLOON PUMP
Safe and effective inflation timing is fairly easy to achieve because the systolic time interval is relatively constant, regardless of heart rate or rhythm. The operator is trained to adjust the time of inflation until it visibly corresponds with the dichrotic notch on the arterial pressure wave display.
Deflation should occur at the end of ventricular diastole or during the isovolumetric contraction period of ventricular systole. Too late deflation is unsafe because it overlaps the ejection period of ventricular systole, impedes ejection and increases the work of the heart. Too early deflation is less effective because it reduces diastolic augmentation.
Safe and effective deflation timing is more difficult to achieve because the length of diastole is variable, depending on the heart rate and rhythm. The operator is trained to adjust the time of deflation until it visibly reduces the EDP and PSP on the arterial pressure wave display. Commercial consoles have two modes of timing:
Conventional Timing
Under conventional timing, the balloon is inflated and deflated at set time intervals after the R wave is detected (called manual timing). This copes badly with alterations in heart rate of >10 bpm. The problem is that when the heart rate increases, the diastolic time interval shortens and the balloon now deflates too late. Conversely, when the heart rate decreases, the diastolic time interval lengthens and the balloon deflates too early.
Conventional timing can be improved by predicting the duration of the current cardiac cycle by averaging the R–R interval of the previous 5–20 heartbeats. The balloon is then deflated at a set time interval before the next R wave is predicted to arrive (called predictive timing). This copes fairly well with alterations in heart rate and is the most commonly used mode of timing.
Both manual and predictive timing cope badly with alterations in heart rhythm, when the length of diastole can vary from beat to beat in an entirely unpredictable way. Unfortunately, cardiac arrhythmias such as atrial fibrillation and frequent ectopic beats are common in these patients making optimal timing difficult to achieve.
Real Timing
Under real timing (also called R wave deflation), the balloon is deflated when the R wave is detected and inflated a set time interval later. This copes very well with alterations in heart rate and rhythm but it tends to cause too late deflation. The problem is that when the R wave is detected there may be insufficient time to fully deflate the balloon before overlapping the ejection period.
The R wave deflation is usually used as a safety mechanism in conjunction with conventional timing. It ensures that the balloon is deflated if an R wave arrives unexpectedly due to a sudden change in heart rate or rhythm.
OPTIMIZATION
As was seen above the standard timing strategies both suffer from problems in certain scenarios and thus control
of IABPs are not efficient in providing the best patient treatment. A natural solution to this is to develop timing strategies that optimize the balloon inflation regime according to the current patient condition. Several teams have reported work in this area.
Jaron et al. in 1979 (32) developed a multielement mathematical model of the canine circulation and the IABP. They expressed inflation and deflation times in terms of the total duration of inflation (DUR) and the time from the R wave to the middle of pump systole (TMPS). Duration of inflation and TMPS were expressed in terms of percentages of the duration of the cardiac cycle.
The model was validated by comparison with anesthetized dogs. They varied DUR and TMPS and measured the effects on EDP, MDP, and CO. Each of the three dependent variables (z axis) were plotted against the two independent variables (x and y axes) to create a three-dimensional (3D) urface. In general, there was considerable similarity between the surfaces obtained from the model and from the dogs. In particular, the similarity was closer for measurements of pressure (EDP, MDP) than for measurements of flow (CO).
Their results indicated that the locations of the desired optima for EDP (75% DUR, 45% TMPS) & CO (55% DUR, 75% TMPS) did not coincide. Furthermore, some combinations of DUR and TMPS within the range used clinically produced detrimental effects. Because not all variables could be optimised at same time, they suggested that the choice of timing settings involved balancing the clinical needs of the patient.
Jaron et al. in 1983 (33) subsequently developed a lumped model of the canine circulation and the IABP. It was validated by comparison with their previous model. They varied the timing of inflation and deflation, the speed of inflation and deflation and the volume of the balloon. The speed was either fast or slow, taking 7% or 33% of the duration of the cardiac cycle, respectively. The fast speed represented the ideal console with near instantaneous balloon inflation and deflation. The slow speed represented commercial consoles with significant inflation and deflation delay due to the movement of the shuttle gas. They measured the effects on EDP, SV, and coronary blood flow.
Inflation at end systole maximized SV and coronary blood flow for fast and slow speeds. Deflation at end diastole minimized EDP for fast speeds. At slow speed, deflation timing involved a trade-off between decreased EDP with early deflation and increased SV and coronary blood flow with late deflation. The overall benefit of the IABP was greater with fast speeds than slow speeds. It was also proportional to balloon volume.
In later experiments (34), they classified dependent variables as either internal, reflecting myocardial oxygen demand, or external, reflecting myocardial oxygen supply. Internal variables measured were TTI and EDP. External variable measured were SV and MDP. They showed that early deflation minimizes internal variables while late deflation maximizes external variables.
Niederer and Schilt in 1988(35) used a mechanical mock circulation and a mathematical model to investigate then influence of timing of inflation and deflation, speed of inflation and deflation and balloon volume on the efficacy
of the IABP. Timing was again expressed in terms of percentage of cardiac cycle duration. The default settings of the model were fast inflation at 30% time, fast deflation at 90% time and a volume of 40 cm3. These were found to produce an increase in SV of 25%, a decrease in left ventricular systolic pressure of 10% and an increase in aortic diastolic pressure of 50%.
The time of inflation was varied between 20% and 50%. This had little effect on SV when the speed was fast, but inflation after 30% caused a slight decrease in SV compared to default when the speed was slow. A time of deflation before 80% caused a slight decrease in SV compared to default. Fast inflation and deflation speeds caused opening and closing shock waves that could be harmful were they to occur in humans. Balloon volume was varied between 10 and 50 mL. There was a nonlinear relationship with SV, but 40 mL was adequate for optimal performance in the mock circulation.
Barnea et al. in 1990 (36) developed a sophisticated computer simulation of the normal, failing and IABPassisted failing canine circulation. It included simple physiological reflexes involved in the regulation of the cardiovascular system. The failing heart was simulated by reducing the contractility of the normal heart. Myocardial oxygen supply and demand were calculated from the model. They were balanced in the normal circulation and imbalanced in the failing circulation. IABP assistance of the failing circulation was shown to restore the balance.
Sakamoto et al. in 1995 (37) investigated the effect of deflation timing on the efficiency of the IABP in anaesthetized dogs. They compared a deflation time before the R wave (during late diastole) with deflation times after the R wave (during isovolumetric contraction). Deflation during the middle of isovolumetric contraction was the most effective in obtaining optimal systolic unloading.
Morrow and Weller (38) successfully used genetic algorithms and the fitness function proposed by Kane et al.(39) to evolve a fuzzy controller that optimized cardiac assistance in a computer simulation of the IABP-assisted failing heart. The inputs were MDP and PSP and the output was deflation time.
Automatic Control
Kane et al. in 1971 (39) proposed a performance index or fitness function that reflected the overall benefit of IABP assistance at different timing combinations. Inflation and deflation times were expressed in terms of the delay before inflation after the R wave and the duration of inflation. The function included weighted MDP, MSP, and EDP.
Fitness ¼ k1MDP þ k2MSP þ k4dðk3 EDPÞ2
where; k1 ¼ |
|
100 |
; |
k2 ¼ |
100 |
; |
k3 |
¼ EDP0 |
; |
|||
|
|
|||||||||||
MDP0 |
MDP0 |
|||||||||||
|
1 |
|
2 |
d |
¼ |
1 |
ifðk3 EDPÞ < 0 |
|
||||
k4 ¼ 500 k3 |
|
; |
|
|
||||||||
|
0 |
otherwise |
|
|
||||||||
MDP0 ¼ unassisted MDP; EDP0 ¼ unassisted EDP
It was tested in a mechanical mock circulation and fitness was found to be a unimodal function of delay and
INTRAAORTIC BALLOON PUMP |
169 |
duration. An automatic controller was developed that used a gradient descent search algorithm to improve the fitness by adjusting the delay and duration at each heartbeat. The performance of the controller was compared with the performance of R wave deflation in simulated cases of heart failure. The controller was considerably better in moderate heart failure and marginally better in severe failure. In severe failure the trade-off between systolic unloading or diastolic augmentation was particularly apparent. In moderate failure, the fitness function emphasized systolic unloading (early deflation) while in severe failure it adapted to emphasize diastolic augmentation (late deflation). Thus, in severe failure the controller tended to simulate R wave deflation.
Martin and Jaron in 1978 (40) developed a manual controller for the IABP that allowed DUR and TMPS to be adjusted. It was tested successfully on anesthetized dogs and was capable of linking to a computer for automatic control.
Jaron et al. in 1985 (34) suggested that SV and TTI index were suitable choices for a fitness function for the fine adjustment of inflation time. Both MDP and EDP were suitable choices for the adjustment of deflation time. However, later work showed that PSP correlated better with myocardial oxygen demand than EDP.
Barnea (41,42), Smith (43) and their co-workers in 1989 proposed a fitness function for optimal control of deflation time. It included weighted MDP and PSP. The permitted interval for deflation time was 200 ms to þ100 ms relative to the predicted arrival of the next R wave. An automatic controller was developed that used a search and approximation algorithm to converge upon the optimum fitness after a number of heartbeats. It was tested successfully on computer simulations and anaesthetised dogs. It was able to follow a moving optimum, both within the same patient over time and between different patients.
Zelano et al. in 1990 (44) developed an automatic controller for the IABP that used different trigger signals. Balloon inflation occurred either upon detection of S2 or at a set time prior to the predicted time of the next S2. Balloon deflation occurred either during the P–R interval at a set time after the P wave or after the R wave. The advantage of using the P wave, R wave and S2 for triggering is that all can be detected in real time. This allows the controller to follow changes in heart rate and rhythm. It was tested successfully in a semiautomatic open loop operation in anaesthetised dogs with a coronary artery tied to simulate a myocardial infarction. They proposed a fitness function for automatic closed loop control. It used weighted MSP and MDP.
Kantrowitz et al. in 1992 (45) reported a clinical trial of automatic closed loop control of the IABP. They used a rulebased algorithm to adjust the time of inflation and deflation. Its safety was verified in anaesthetized dogs and it was then tested on 10 human patients. Their aims were for inflation to occur at dichrotic notch and for deflation to overlap the first half of ventricular ejection. They were successful in 99 and 100% of recordings respectively. Eight of the patients survived. Neither of the two deaths was attributed to the controller.
170 INTRAAORTIC BALLOON PUMP
Sakamoto et al. in 1995 (46) developed a new algorithm to cope with atrial fibrillation, the most unpredictable cardiac arrhythmia sometimes described as irregularly irregular. The aim was for inflation to occur at the dichrotic notch. They were able to predict the time of arrival of the dichrotic notch from mathematical analysis of the R–R interval from the previous 60 heartbeats. Deflation occurred at the R wave. It was tested on ECG recordings from real patients and performed better than conventional timing.
FUTURE DEVELOPMENTS
The use of IABP therapy for preoperative support and as an adjunct to coronary angioplasty or bypass and off-bypass cardiac surgery is likely to increase although larger studies are required to identify which patients will benefit most. The role of the IABP in left ventricular failure is likely to decrease with the increasing use of left ventricular assist devices.
Manufacturers recent research and development has focused on: Improved automatic control algorithms that better cope with alterations in heart rate and rhythm and adjust inflation and deflation times to optimize cardiac assistance. Better catheter designs that cause fewer vascular complications and permit more rapid movement of the shuttle gas.
BIBLIOGRAPHY
1.Harken DE. Presentation at the International College of Cardiology, Brussels; 1958.
2.Clauss RH, et al. Assisted circulation. I. The arterial counterpulsator. J Thorac Cardiovasc Surg 1961;41:447.
3.Kantrowitz A, McKinnen WMP. Experimental use of diaphragm as experimental myocardium. Surg Forum 1958;9:266.
4.Moulopoulos SD, Topaz S, Kolff WJ. Diastolic balloon pumping (with carbon dioxide) in the aorta. A mechanical assistance to the failing circulation. Am Heart J 1962;63:669.
5.Clauss RH, Missier P, Reed GE, Tice D. Assisted circulation by counterpulsation with intra-aortic balloon: Methods and effects. Proceeding of the 4th ACEMB; 1962.
6.Kantrowitz A, et al. Initial clinical experience with intraaortic balloon pumping in cardiogenic shock. J Am Med Ass 1968;203:113.
7.Dennis C, Moreno JR, Hall DP. Studies on external counterpulsation as a potential measure for acute left heart failure. Trans Am Soc Artif Intern Organs 1963;9:186.
8.Kantrowitz A, et al. Initial clinical experience with a new permanent mechanical auxiliary ventricle: The dynamic aortic patch. Trans Am Soc Artif Intern Organs 1972;18(0):159–167, 179.
9.Kantrowitz A, et al. Jr. Initial clinical experience with intraaortic balloon pumping in cardiogenic shock. JAMA 1968;203(2):113–118.
10.Kantrowitz A. Origins of intraaortic balloon pumping. Ann Thoracic Surg 1990;50(4):672–674.
11.Freed PS, Wasfie T, Zado B, Kantrowitz A. Intraaortic balloon pumping for prolonged circulatory support. Am J Cardiol 1988;61(8):554–557.
12.Lund O, et al. Intraaortic balloon pumping in the treatment of low cardiac output following open heart surgery–immediate results and long-term prognosis. Thoracic Cardiovascular Surg 1988;36(6):332–337.
13.Meharwal ZS, Trehan N.Vascular complications of intra-aor- tic balloon insertion in patients undergoing coronary reavscularization: Analysis of 911 cases.[See comment]. Eur J CardioThoracic Surg 2002;21(4):741–747.
14.Ferguson JJ. 3rd, et al. The current practice of intra-aortic balloon counterpulsation: Results from the benchmark registry. J Am College Cardiol 2001;38(5):1456–1462.
15.Dietl CA, et al. Efficacy and cost-effectiveness of preoperative iabp in patients with ejection fraction of 0.25 Or less. Ann Thorac Sur 1996;62(2):401–408.
16.Christenson JT, Simonet F, Badel P, Schmuziger M. Evaluation of preoperative intra-aortic balloon pump support in high risk coronary patients. Eur J Cardio-Thoracic Sur 1997;11(6): 1097–1103.
17.Suzuki T, et al. Usefulness of preoperative intraaortic balloon pump therapy during off-pump coronary artery bypass grafting in high-risk patients. Ann Thoracic Surg 2004;77 (6):2056–2059.
18.Brodie BR, Stuckey TD, Hansen C, Muncy D. Intra-aortic balloon counterpulsation before primary percutaneous transluminal coronary angioplasty reduces catheterization laboratory events in high-risk patients with acute myocardial infarction. Am J Cardiol 1999;84(1):18–23.
19.Ishihara M, Sato H, Tateishi H, Uchida T, Dote K. Intraaortic
balloon pumping as the postangioplasty strategy in acute myocardial infarction. Am Heart J 1991;122(2):385– 389.
20.Ohman EM, et al. Use of aortic counterpulsation to improve sustained coronary artery patency during acute myocardial infarction. Results of a randomized trial. The randomized iabp study group Circulation 1994;90(2):792–799.
21.Stone GW, et al. A prospective, randomized evaluation of prophylactic intraaortic balloon counterpulsation in high risk patients with acute myocardial infarction treated with primary angioplasty. Second primary angioplasty in myocardial infarction (pami-ii) trial investigators. J Am College Cardiol 1997;29(7):1459–1467.
22.van’t Hof AW, et al. A randomized comparison of intra-aortic balloon pumping after primary coronary angioplasty in high risk patients with acute myocardial infarction. [See comment]. Eur Heart J 1999;20(9):659–665.
23.Sanborn TA, et al. Impact of thrombolysis, intra-aortic balloon pump counterpulsation, and their combination in cardiogenic shock complicating acute myocardial infarction: A report from the shock trial registry. Should we emergently revascularize occluded coronaries for cardiogenic shock? J Am College Cardiol 2000;36(3 Suppl. A):1123–1129.
24.Minich LL, et al. Intra-aortic balloon pumping in children with dilated cardiomyopathy as a bridge to transplantation. J Heart Lung Transplant 2001;20(7):750–754.
25.Pantalos GM, et al. Estimation of timing errors for the intraaortic balloon pump use in pediatric patients. ASAIO Journal 1999;45(3):166–671.
26.Akomea-Agyin C, et al. Intraaortic balloon pumping in children. Ann Thoracic Surg 1999;67(5):1415–1420.
27.Pinkney KA, et al. Current results with intraaortic balloon pumping in infants and children. Ann Thoracic Surg 2002;73(3):887–891.
28.Kantrowitz A, et al. Intraaortic balloon pumping 1967 through 1982: analysis of complications in 733 patients. Am J Cardiol 1986;57(11):976–983.
29.Miller JS, Dodson TF, Salam AA, Smith RB3rd. Vascular complications following intra-aortic balloon pump insertion. Am Surg 1992;58(4):232–238.
30.Macoviak J, et al. The intraaortic balloon pump: an analysis of five years’ experience. Ann Thoracic Surg 1980;29(5):451– 458.