

- •VOLUME 4
- •CONTRIBUTOR LIST
- •PREFACE
- •LIST OF ARTICLES
- •ABBREVIATIONS AND ACRONYMS
- •CONVERSION FACTORS AND UNIT SYMBOLS
- •HYDROCEPHALUS, TOOLS FOR DIAGNOSIS AND TREATMENT OF
- •HYPERALIMENTATION.
- •HYPERBARIC MEDICINE
- •HYPERBARIC OXYGENATION
- •HYPERTENSION.
- •HYPERTHERMIA, INTERSTITIAL
- •HYPERTHERMIA, SYSTEMIC
- •HYPERTHERMIA, ULTRASONIC
- •HYPOTHERMIA.
- •IABP.
- •IMAGE INTENSIFIERS AND FLUOROSCOPY
- •IMAGING, CELLULAR.
- •IMAGING DEVICES
- •IMMUNOLOGICALLY SENSITIVE FIELD–EFFECT TRANSISTORS
- •IMMUNOTHERAPY
- •IMPEDANCE PLETHYSMOGRAPHY
- •IMPEDANCE SPECTROSCOPY
- •IMPLANT, COCHLEAR.
- •INCUBATORS, INFANTS
- •INFANT INCUBATORS.
- •INFUSION PUMPS.
- •INTEGRATED CIRCUIT TEMPERATURE SENSOR
- •INTERFERONS.
- •INTERSTITIAL HYPERTHERMIA.
- •INTRAAORTIC BALLOON PUMP
- •INTRACRANIAL PRESSURE MONITORING.
- •INTRAOCULAR LENSES.
- •INTRAOPERATIVE RADIOTHERAPY.
- •INTRAUTERINE DEVICES (IUDS).
- •INTRAUTERINE SURGICAL TECHNIQUES
- •ION-EXCHANGE CHROMATOGRAPHY.
- •IONIZING RADIATION, BIOLOGICAL EFFECTS OF
- •ION-PAIR CHROMATOGRAPHY.
- •ION–SENSITIVE FIELD-EFFECT TRANSISTORS
- •ISFET.
- •JOINTS, BIOMECHANICS OF
- •JOINT REPLACEMENT.
- •LAPARASCOPIC SURGERY.
- •LARYNGEAL PROSTHETIC DEVICES
- •LASER SURGERY.
- •LASERS, IN MEDICINE.
- •LENSES, CONTACT.
- •LENSES, INTRAOCULAR
- •LIFE SUPPORT.
- •LIGAMENT AND TENDON, PROPERTIES OF
- •LINEAR VARIABLE DIFFERENTIAL TRANSFORMERS
- •LITERATURE, MEDICAL PHYSICS.
- •LITHOTRIPSY
- •LIVER TRANSPLANTATION
- •LONG BONE FRACTURE.
- •LUNG MECHANICS.
- •LUNG PHYSIOLOGY.
- •LUNG SOUNDS
- •LVDT.
- •MAGNETIC RESONANCE IMAGING
- •MAGNETOCARDIOGRAPHY.
- •MANOMETRY, ANORECTAL.
- •MANOMETRY, ESOPHAGEAL.
- •MAMMOGRAPHY
- •MATERIALS, BIOCOMPATIBILITY OF.
- •MATERIALS, PHANTOM, IN RADIOLOGY.
- •MATERIALS, POLYMERIC.
- •MATERIALS, POROUS.
- •MEDICAL EDUCATION, COMPUTERS IN
- •MEDICAL ENGINEERING SOCIETIES AND ORGANIZATIONS
- •MEDICAL GAS ANALYZERS
- •MEDICAL PHOTOGRAPHY.
- •MEDICAL PHYSICS LITERATURE
- •MEDICAL RECORDS, COMPUTERS IN
- •MICROARRAYS
- •MICROBIAL DETECTION SYSTEMS
- •MICROBIOREACTORS
- •MICRODIALYSIS SAMPLING
- •MICROFLUIDICS
- •MICROPOWER FOR MEDICAL APPLICATIONS
- •MICROSCOPY AND SPECTROSCOPY, NEAR-FIELD
- •MICROSCOPY, CONFOCAL
- •MICROSCOPY, ELECTRON
- •MICROSCOPY, FLUORESCENCE
- •MICROSCOPY, SCANNING FORCE
- •MICROSCOPY, SCANNING TUNNELING
- •MICROSURGERY
- •MINIMALLY INVASIVE SURGICAL TECHNOLOGY
- •MOBILITY AIDS
- •MODELS, KINETIC.
- •MONITORING IN ANESTHESIA
- •MONITORING, AMBULATORY.
- •MONITORING, FETAL.
- •MONITORING, HEMODYNAMIC
- •MONITORING, INTRACRANIAL PRESSURE
- •MONITORING, NEONATAL.
- •MONITORING, UMBILICAL ARTERY AND VEIN
- •MONOCLONAL ANTIBODIES
- •MOSFET.
- •MUSCLE ELECTRICAL ACTIVITY.
- •MUSCLE TESTING, REHABILITATION AND.
- •MUSCULOSKELETAL DISABILITIES.
CONCLUSION
The utility of fluorescence microscopy lies in its ability to study biological structure and function In vivo. The exquisite sensitivity and image contrast of fluorescence microscopy allow biological structures to be imaged on the submicron length scale. The greatest power of fluorescence microscopy lies in its ability to determine biochemical functions using assays based on fluorescence spectroscopy. With the availability of more versatile instruments, more fluorophores unit greater molecular and environmental specificity, the impact of fluorescence microscopy technology on biomedical science will only increase.
BIBLIOGRAPHY
1.Wang XF, Herman B. Fluorescence Imaging Spectroscopy and Microscopy. New York: Wiley; 1996.
2.Inoue´ S, Spring KR. Video Microscopy: the Fundamentals. New York: Plenum Press; 1997.
3.Herman B. Fluorescence Microscopy. Oxford: Bios Scientific Publishers / Springer in Association with the Royal Microscopy Society; 1998.
4.Cantor CR, Schimmel PR. Biophysical Chemistry. San Francisco: Freeman; 1980.
5.Valeur B. Molecular Fluorescence: Principles and Applications. Weinheim; New York: Wiley-VCH; 2002.
6.Lakowicz JR. NetLibrary Inc. Topics in Fluorescence Spectroscopy. Kluwer Academic; 2002.
7.Klein MV, Furtak TE. Optics. New York: Wiley; 1986.
8.Hecht E. Optics. Reading, (MA): Addison-Wesley; 2002.
9.Gu M. Advanced Optical Imaging Theory. Berlin: New York: Springer; 2000.
10.Born M,Wolf E. Principles of Optics: Electromagnetic Theory of Propagation, Interference and Diffraction of Light. Cambridge: New York: Cambridge University Press; 1999.
11.Rizzuto R, Carrington W, Tuft RA. Digital imaging microscopy of living cells. Trends Cell Biol 1998;8:288–292.
12.Agard DA, Hiraoka Y, Shaw P, Sedat JW. Fluorescence microscopy in three dimensions. Methods Cell Biol 1989;30:353–377.
13.Carrington WA, et al. Superresolution three-dimensional images of fluorescence in cells with minimal light exposure. Science 1995;268:1483–1487.
14.Krishnamurthi V, Liu YH, Bhattacharyya S, Turner JN, Holmes TJ. Blind Deconvolution Of Fluorescence Micrographs By Maximum-Likelihood-Estimation. Appl Opt 1995;34:6633–6647.
15.Wilson T, Sheppard CJR. Theory and Practice of Scanning Optical Microscopy. New York: Academic; 1984.
16.Pawley JB. Handbook of Confocal Microscopy. New York: Plenum; 1995.
17.Gu M. Principles of Three-Dimensional Imaging in Confocal Microscopy. Singapore: World Scientific; 1996.
18.MastersBR. Selected Papers on Multiphoton Excitation Microscopy. Bellingham: SPIE Optical Engineering Press; 2003.
19.Amos WB, White JG. How the confocal laser scanning microscope entered biological research. Biol Cell 2003;95:335–342.
20.Denk W, Strickler JH, Webb WW. Two-photon laser scanning fluorescence microscopy. Science 1990;248:73–76.
21.Kleinfeld D, Mitra PP, Helmchen F, Denk W. Fluctuations and stimulusinduced changes in blood flow observed in individual capillaries in layers 2 through 4 of rat neocortex. Proc Natl Acad Sci U. S. A. 1998;95:15741–15746.
22.Axelrod D. Total internal reflection fluorescence. Ann Rev Biophys Bioeng 1984;13:247–268.
MICROSCOPY, SCANNING FORCE |
503 |
23.Axelrod D. Total internal reflection fluorescence microscopy in cell biology. Traffic 2001;2:764–774.
24.Axelrod D. Selective imaging of surface fluorescence with very high aperture microscope objectives. J Biomed Opt 2001;6:6–13.
25.Mason WT. Fluorescent and Luminescent Probes for Biological Activity: a Practical Guide to Technology for Quantitative Real-time Analysis. San Diego: Academic; 1999.
26.Slavic J. Fluorescence Microscopy and Fluorescent Probes. New York: Plenum Press; 1996.
27.Tsien RY. Fluorescent probes of cell signaling. Annu Rev Neurosci 1989;12:227–253.
28.Tsien RY. Fluorescent indicators of ion concentrations. Methods Cell Biol 1989;30:127–156.
29.Bruchez Jr M, Moronne M, Gin P, Weiss S, Alivisatos AP. Semiconductor nanocrystals as fluorescent biological labels. Science 1998;281:2013–2016.
30.Chan WC, et al. Luminescent quantum dots for multiplexed biological detection and imaging. Curr Opin Biotechnol 2002;13:40–46.
31.Michalet X, et al. Quantum dots for live cells, in vivo imaging, and diagnostics. Science 2005;307:538–544.
32.Zhang J, Campbell RE, Ting AY, Tsien RY. Creating new fluorescent probes for cell biology. Nat Rev Mol Cell Biol 2002;3:906–918.
33.Chalfie M, et al. Green Fluorescent Protein as a Marker for Gene Expression. Science 1994;263:802–805.
34.Lakadamyali M, Rust MJ, Babcock HP, Zhuang X. Visualizing infection of individual influenza viruses. Proc Natl Acad Sci U. S. A. 2003;100:9280–9285.
35.Gaietta G, et al. Multicolor and electron microscopic imaging of connexin trafficking. Science 2002;296:503–507.
36.Voura EB, Jaiswal JK, Mattoussi H, Simon SM. Tracking metastatic tumor cell extravasation with quantum dot nanocrystals and fluorescence emissionscanning microscopy. Nat Med 2004;10:993–998.
37.Hanson KM, et al. Two-photon fluorescence lifetime imaging of the skin stratum corneum pH gradient. Biophys J 2002;83:1682–1690.
38.Sosa H, Peterman EJ, Moerner WE, Goldstein LS. ADPinduced rocking of the kinesin motor domain revealed by single-molecule fluorescence polarization microscopy. Nat Struct Biol 2001;8:540–544.
39.Stryer L, Haugland RP. Energy Transfer: a spectroscopic ruler. Proc Natl Acad Sci U. S. A. 1967;58:712–726.
40.Verveer PJ, Wouters FS, Reynolds AR, Bastiaens PIH. Quantitative imaging of lateral ErbB1 receptor signal propagation in the plasma membrane. Science 2000;290:1567–1570.
See also FLUORESCENCE MEASUREMENTS; MICROSCOPY, CONFOCAL
MICROSCOPY, SCANNING FORCE
EWA P. WOJCIKIEWICZ
KWANJ JOO KWAK
VINCENT T. MOY
University of Miami
Miami, Florida
INTRODUCTION
Recent advances in technology have allowed us to study our world at molecular, even subatomic, resolution. One of the devices in the forefront of such studies is the atomic force microscope (AFM), which is a relatively complex device
504 MICROSCOPY, SCANNING FORCE
with two major applications. It can be used as an imaging device, which allows for the acquisition of atomic-level images of biological structures as well as to measure forces of interactions between two opposing surfaces down to the single-molecule level.
Imaging AFM
The AFM was originally designed as an imaging tool (1). It was modified from the design of the scanning tunneling microscope (STM). The AFM acquires topographic images by methodically scanning a sample with a flexible probe, called a cantilever, which bends according to the contours of the sample’s surface. The bending of the cantilever is translated into an image map, which reveals the height differences in the surface being scanned. It is possible to image biological samples under physiological conditions as imaging can be done in both air and liquid. The resulting resolution of such maps is at the atomic level (2,3).
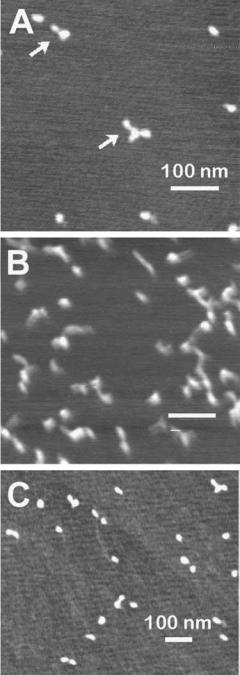
The imaging AFM has been used to image many biological samples ranging from genetic material to cells to bone. A few of these studies will be highlighted. One of the earliest biological materials to be imaged was DNA, which has been imaged in many forms to date, including doubleand single-stranded forms as well as more complex structures. The AFM has also been used for many applications including DNA sizing, previously only achieved using gel electrophoresis, DNA mapping, hybridization studies, and examinations of protein-DNA interactions (4). AFM studies of RNA were also conducted. Unlike DNA, which mainly forms a double-helical structure, RNA has the ability to form more advanced structures that do not rely solely on Watson–Crick base pairing. One example are the so-called kissing-loop structures imaged by Hansma et al.
(4) (Fig. 1). Not only was the AFM used in imaging of such structures, many of them 3D, but also played an important role in designing them (5). Unlike other imaging techniques, AFM sudies can be done under physiological conditions allowing for the imaging of biological processes. Images of transcription complexes have been obtained, for example, E.coli RNA polymerase in complex with DNA. These studies are the only of their kind that can answer certain specific questions as to how the RNA transcription process takes place. One is able to visualize how the DNA does not get entangled in the nascent RNA strands. Such studies detailing the structure-function relationship of the transcription process are key in furthering our understanding of gene expression (6,7).
Also, imaging of cells was conducted to examine the structure of the cellular cortex in detail. The cell cytoskeleton is known to be involved in affecting cell shape as well as movement and other cellular responses to biochemical and biophysical signals. At present, relatively little is known about the mechanical organization of cells at a subcellular level. Pesen et al. (8) studied the cell cortex of bovine pulmonary artery endothelial cells (BPAECs) using AFM and confocal fluorescence microscopy (CFM). They were able to identify a coarse and fine mesh that make up the cortical cytoskeleton. These two types of mesh appear to be intertwined (Fig. 2) (8). Such details are not distinguished in imaging studies using fixed cells.
Figure 1. Kissing-loop RNA structures. (a,c) Kissing-loop RNAs at low concentrations. The three arms of the individual RNAs are visible. (B) Kissing-loop RNAs at a concentration 10-fold higher than in a and c. The individual structures are less well-defined. Scale bars ¼ 100 nm for all images.
Other imaging studies have looked at tendon and bone, both of which are composed of type I tropo-collagen, which was done by acquisition of high resolution AFM images of type I collagen in conjunction with force spectroscopy studies, namely protein unfolding, which is described in the following section. Figure 3 reveals these high resolution collagen type I images. They were acquired using two different concentrations of collagen, which resulted in
Figure 2. AFM Images of the cortical mesh of bovine pulmonary artery endothelial cells (BPAEC). (a–d) High magnification deflection AFM images of the cortical mesh of living BPAECs in a physiological saline. The filamentous mesh appears to be organized on two length scales, with coarse mesh (arrowheads) and fine mesh filaments (arrows). The two meshes are likely to be intertwined, although it is possible that the fine mesh is layered over the coarse mesh. Lateral resolution in these images is125 nm.
slightly different orientations of collagen: random at the lower concentration (Fig. 3a) and oriented unidirectionally in the higher concentration (Fig. 3b). In these studies, the AFM was used to investigate the mechanical properties of this collagenous tissue, which are altered in diseases such as osteoporosis. Being familiar with such properties is important for gaining further understanding as well as preventing and curing bone diseases (9).
Force Spectroscopy
The AFM can also be operated in the force scan mode, which allows for the measurement of adhesion forces
Figure 3. Topographical images (height; tapping mode in air) of type I collagen monomers on a mica substrate. (a) low (1 mg/ml) concentration of collagen, (b) high (10 mg/ml) concentration of collagen.
MICROSCOPY, SCANNING FORCE |
505 |
between receptors and their corresponding binding partners, or ligands. In studies of ligand-receptor forces, the receptor is immobilized on the surface of a flexible AFM cantilever whereas the ligand is attached to a suitable substrate. The deflection of the cantilever during the approach and withdrawal of the cantilever from the substrate allow for the force of the interaction to be measured. These type of experiments provide information simulating the influence of internal and external forces that these receptors would experience in the body, for example, the shear stress experienced by a blood cell attached to the endothelium while blood rushes past it. Such information was previously unavailable when receptor-ligand interactions were examined using more traditional biochemical techniques. AFM has made it possible to acquire measurements that reveal the mechanical properties of biomolecules under applied force. Measurements of the unbinding force of a single ligand-receptor interaction can now be acquired with the AFM (10–12).
The AFM can also be used in adhesion studies involving whole cells (13,14). In these studies, the interaction between a cell expressing a particular receptor of interest and its ligand protein or another cell expressing the ligand is measured. The cell adhesion experiments allow for the acquisition of both single-molecule measurements, like in the above-mentioned studies, as well as multiple-bond interactions. The advantage of using the AFM in cell adhesion studies is the high specificity and wealth of information that is obtained. The AFM force scans provide information about the individual bond strengths as well as the force and work that is required to separate the entire complex. Combining single-molecule and multiple-bond data allows us to describe the thermodynamic model of the separation of a particular complex in addition to the mechanism of its action on the cellular scale (15,16).
The AFM can also serve as a microindenter that probes soft samples, including cells revealing information about their mechanical properties. The mechanical properties of cells play an important role in such essential physiological processes such as cell migration and cell division. Understanding these properties can later help scientists to identify when certain processes may be taking place. The mechanical properties of cells are chiefly determined by their actin cytoskleleton, which is the cell’s ‘‘backbone.’’ This type of information, which cannot be obtained using standard cell biology methods, allows for the estimation of the Young’s modulus of living cells (16). The Young’s modulus is a calculated value, which provides information regarding the compliance or elasticity of a cell. Such experiments may be done with either the imaging AFM or using force spectroscopy. Manfred Radmacher’s group has conducted such measurements with an imaging AFM in force mapping mode. The advantage of such measurements is the wealth of information that they provide. These experiments reveal not only the elastic properties of the cells being examined but also topographical information. They can also be performed in conjunction with video microscopy to further confirm what one is visualizing and that cells are not undergoing damage (17,18). In force spectroscopy experiments, the Young’s modulus is obtained by poking the cell cantilever tip. This type of
506 MICROSCOPY, SCANNING FORCE
information can be correlated with adhesion data to determine whether elasticity changes in response to drugs or other stimulation have an effect on the strength of cell adhesion (19).
Another application allows scientists to study protein folding. Proteins are composed of amino acid chains, which constitute the primary protein structure. These amino acid chains have to undergo folding into tertiary and secondary, 3D structures, which is essential for the proper functioning of these proteins. Recently, advances in AFM have made it possible to study this fascinating biological process and bring new insight into the energy landscapes of protein folding. Proteins involved in mechanical functions are composed of multiple domains, which fold individually. One of these domains is fibronectin. The most common form of fibronectin is fibronectin type III (FN-III), which is found in an estimated 2% of all animal proteins and has thus been studied extensively. FN-III domains are found in the muscle protein titin, which is responsible for the passive elasticity of muscle. These domains have been found to unravel during forced extension. Understanding the forces required in unfolding events as well as the time it takes for unfolding to happen can be critical for the physiological functions of mechanical proteins such as titin (9,20–22).
Now that a brief overview of the potential applications of the AFM has been provided, it is important to understand the principles behind its operation. The following section focuses on the theory of data acquisition using AFM as well as descriptions of the equipment itself. The last section of this article provides a more in-depth evaluation of the technique in addition to discussing the most recent advances in the field.
THEORY AND EXPERIMENTAL APPROACH
This section focuses on the theory and experimental approaches of AFM. The section begins with a description of the imaging AFM as well as its different modes of operation, which allow for its applications in various experimental protocols. Later, force spectroscopy is described. Focus is placed on the force apparatus used in our laboratory, which relies on the same basic principals as the commercially available AFMs. In addition to a description of its operation, this section also discusses the different applications of the force apparatus.
Imaging AFM
Optical Beam Deflection. An AFM has a force sensor called a cantilever to measure the forces between a sharp tip and the surface (23). Unlike the optical microscope that relies on 2D images, the images acquired with the AFM are obtained in three dimensions: the horizontal xy-plane and the vertical z-direction. As shown in Fig. 4, the tip at the end of the cantilever is brought in close proximity to the sample mounted on a piezoelectric element. The AFM can be compared with a record player such as an old stylusbased instrument (1). It combines the principles of a scanning tunneling microscope (STM) and the stylus profiler. However, the probe forces in the AFM are much smaller than those ( 104 N) achieved with a stylus profiler.
Laser |
Photodiode |
|
|
|
Preamp |
|
|
A/D |
|
|
|
|
|
||||
|
|
|
|
|
|
|
Converter |
|
|
|
|
|
|
|
|
|
|
|
|
|
|
|
|
|
|
|
Bimorph actuator


 Cantilever & Tip
Sample
 Computer & Interface
SPM controller
Piezoelectric tube scanner
X, Y, Z signals
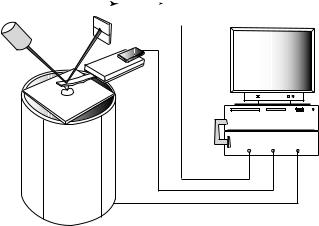
Figure 4. Schematic illustration of an AFM. A force sensor consists of a flexible cantilever with an extremely sharp tip at its end. A ceramic (Si3N4) or semiconductor (Si) tip on the cantilever can be brought into close proximity to a sample surface. As the tip is close to the sample surface, it either continuously touches or periodically vibrates on the surface, and bends or changes in its vibration amplitude and frequency. A laser spot is reflected off the top of the cantilever. When the cantilever bends, the laser light is deflected onto a two-panel photodiode. The detected signals are amplified and transformed by electronic circuits and sent to an SPM controller. The SPM controller, the computer, and their interfaces generate an image.
The AFM belongs to the family of scanning probe microscopes (SPMs). Like all other SPMs, the AFM uses an extremely sharp tip that moves over the sample surface with a raster scan (like the movement of the electron beam on the TV screen). In the first AFM, the bending of the cantilever was detected using an STM, but now a sensitive and simple optical method is used in most AFMs (24). As shown in Fig. 4, a laser beam is reflected off the cantilever onto a two-panel photodiode. As the cantilever bends, the position of the reflected laser light changes. Measurements are obtained as a result of the differences in the signal between the two segments of this photo-detector.
Feedback Operation. The AFM uses a piezoelectric element to position and scan the sample with high resolution. A tube-shaped piezoelectric ceramic that has a high stability is used in most SPMs. Application of voltage results in the stretching or bending of the piezoelectric tube, allowing it to move in all three dimensions and to position the cantilever probe with very high precision. For example, by applying a voltage to one of the two electrodes (xy-axis) the tube scanner expands and tilts away from a center position (xy-origin). A corresponding negative voltage applied to the same electrode causes the tube scanner contract, resulting in movements on the xy-plane relative to the origin. The magnitude of the movement depends on the type of piezoelectric ceramic, the shape of the element, and the applied voltage.
Feedback control is used for many common applications, such as thermostats, which are used to maintain a particular temperature in buildings, and autopilot, commonly used in airplanes. In the AFM, a feedback loop is used to
keep the force acting on the tip in a fixed relationship with the surface while a scan is performed. The feedback loop consists of the piezoelectric tube scanner, the cantilever and tip, the sample, and the feedback circuit. The feedback circuit consists of proportional and integral gain controls and provides an immediate response to scanning parameter changes. A computer program acts as a compensation network that monitors the cantilever deflection and attempts to keep it at a constant level.
Contact Mode (Static Mode). The AFM operates by measuring the intermolecular forces between the tip and sample. The most common method used in imaging AFM is contact mode, where the piezoelectric element slightly touches the tip to the sample. The experimental setup is shown in Fig. 4. As a result of the close contact, the tip and sample remain in the repulsive regime of the tip-sample interaction shown in Fig. 5. Thus, the AFM measures repulsive force between the tip and sample. As the raster scan moves the tip along the sample, the two-panel photodiode measures the vertical deflection of the cantilever, which reveals the local sample height. Each contour of the
Force |
|
|
Contact mode |
Repulsive |
Intermittent contact |
region |
|
Tip-sample distance
Attractive
region 
 Non-contact
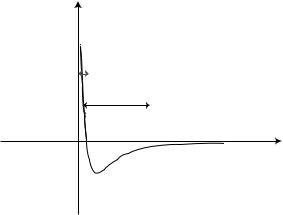
Figure 5. Relationship between the operating modes of AFM and the force regions. The x-axis of the graph is the tip-sample distance and the y-axis is the force or potential. The graph shows the force or potential, as a function of the distance, simply calculated by the Lennard–Jones potential and the DMT approximation. In contact mode AFM, the tip-sample interaction lies in the repulsive region of the curve above the x-axis. As the cantilever is pushed upward, a resulting restoring force occurs, which can be given by Hooke’s Law. The difference between this graph and the measured forcedistance curve occurs when the force measurement is not static but dynamic and is quickly affected by the capillary force in the thin surface water layer. In intermittent contact mode, the cantilever is operated by a vibration of an amplitude of 10 to 100 nm. The tip is still in contact with the surface, but it just contacts or ‘‘taps’’ on the surface for a very small fraction of its oscillation period. In this operation mode, the tip-sample interaction is broad, ranging from the repulsive region of the curve to the attractive region due to the long-range van der Waals force. The tip-sample interaction in noncontact mode is much weaker than the one in contact and intermittent contact mode. The force between the tip and sample is several orders of magnitude weaker than in the contact regime. As the cantilever in noncontact mode is vibrated near its resonance frequency with an amplitude less than 10 nm, the spacing between the tip and sample is on the order of several to tens of nanometers.
MICROSCOPY, SCANNING FORCE |
507 |
surface results in a movement of the tip in the xyz-direction, resulting in a change in the deflection angle of the laser beam. This change is measured through the photodiode and translated finally to an image.
Tip-sample Interaction: The cantilever in the AFM is a critical component (1). The force produced by a spring always tends to restore the spring to its equilibrium position. When the spring is pushed upward by a distance z, it has to be pulled downward. This restoring force is given by Hooke’s Law as:
FðzÞ ¼ k ðz z0Þ |
() |
where k is a spring constant and depends on the material and dimensions of the cantilever, z is the vertical position of the cantilever, and z0 is the equilibrium position. As a cantilever with a spring constant of 0.1 newton/meter (N/ m) is moved by 1 nm, the resulting force is 0.1 nanonewton (nN). The first tip used by the inventors of the AFM was made from diamond glued to a lever of gold foil (1). Microfabricated cantilever tips are now commercially used.
Electromagnetic forces determine the properties of solids, liquids, and gases; the behavior of particles in solution; and the organization of biological structures (25). These forces are also the source of all intermolecular interactions including covalent bonds, Coulomb forces, ionic forces, ion-dipole interaction, and dipole-dipole interaction. In the AFM, the intermolecular interactions between the tip and the sample surface include van der Waals forces, electrostatic forces, water capillary force, and material properties including elasticity. The most common force in the tip-sample interaction is the van der Waals force. The force is calculated using the Lennard–Jones potential, which combines the attractive van der Waals and the repulsive atomic potentials (25). The force depends on the distance between the tip and the sample, as shown in Fig. 5. This calculated force is an estimate of the van der Waals forces and is usually a few nanonewtons in magnitude.
Force-distance Curve: Since the invention of the AFM, many researchers have used it to measure the tip-sample interaction force on the atomic scale. The AFM records the force as the tip is brought in close proximity to the sample surface, even indented into the surface, and then pulled off. The measured force curve is a plot of cantilever deflection versus the extension of the z-piezoelectric scanner (z-piezo). A force-distance curve is a kind of interpretation of the force measurements. It needs a simple relationship between the cantilever deflection and the tip-sample distance. Thus, the force-distance curve describes the tipsample interaction force as a function of the tip-sample distance rather than as a function of the z-piezo position. It is difficult to measure the quantitative forces with this technique because the spring constant of the cantilever and the shape of the tip are not accurately known. However, this technique has been used to study adhesion, elasticity, bond rupture length, and even thickness of adsorbed layers. These studies of the fundamental interactions between the sample surfaces have extended across basic
508 MICROSCOPY, SCANNING FORCE
science, chemistry, biology, and even material science. The interaction force between tip and sample is typically on the order of tens of pN for biomolecular interactions. Force measurements in solution have the advantages of the AFM due to the lower tip-sample interaction.
Constant Force and Constant Height: In contact mode, the tip is scanned across the surface in contact either at a constant force or at a constant height above the sample. Constant force mode is achieved by use of a z-feedback loop from the deflection signal. The feedback circuits serve to maintain a constant force between the tip and the sample while the tip follows the contours of the surface. The piezoelectric tube can respond to any changes in the cantilever deflection. A computer program acts to keep the cantilever deflection at a constant level. Then, the tipsample interaction can be kept at a predetermined restoring force. This technique is used to observe the precise topography of the sample surface. If the z-feedback loop is switched off, then the z-direction of the piezoelectric tube is kept constant, and an image is generated based on the cantilever deflection. Using constant height can be useful for imaging very flat samples.
Lateral Force Microscopy: Lateral force microscopy (LFM) is an extension of contact mode, where an additional detected parameter is the torsion of the cantilever, which changes according to the friction force (26). This lateral force induces a torsion of the cantilever, which, in turn, causes the reflected laser beam to undergo a change in a perpendicular direction to that resulting from the surface corrugation. The LFM uses a photodiode with four segments to measure the torsion of the cantilever. When the cantilever is scanned across the surface in contact, differences in friction between tip and sample cause the tip to stick-slip on the surface. This stick-slip behavior creates a characteristic saw-tooth waveform of atomic level in the friction image (27). The LFM can provide material-sensi- tive contrast because different components of a composite material exert different friction forces. Researchers often call this operation mode friction force microscopy (27,28). Increasing wear with decreasing sliding velocity on the nanometer scale has been observed with this technique. It has been demonstrated with LFM that, on the atomic scale, frictional properties are sensitive to changes in surface properties on chemical modification. The LFM can also be applied to chemical force microscopy (CFM) by a modified tip with chemical functionality (29). It has been demonstrated with CFM that mapping the spatial arrangement of chemical functional groups and their interactions is of significant importance to problems ranging from lubrication and adhesion to recognition in biological systems.
Capillary Force: The thin surface water layer that exists on the sample surface will form a small capillary bridge between the tip and the sample. The capillary force is important when the AFM is operated in air. Examine the effect of surface tension on AFM measurements. At the moment of tip contact with a liquid film on a flat surface, the film surface reshapes producing a ring around the tip. The water layer wets the tip surface because the
water-tip contact (if it is hydrophilic) is energetically advantageous as compared with the water-air contact. If the tip radius is 10 nm and the contact angle is small (i.e., hydrophilic), a capillary force of about 10 nN can result. Thus, the capillary force is the same order of magnitude as the van der Waals interaction. An AFM tip has been used to write alkanethiols with a 30 nm line-width resolution on a gold thin film in a manner analogous to that of a dip pen (30). Recently, this dip-pen nanolithography has also been applied to direct nanoscale patterning of biological materials such as DNA, peptides, and proteins on glass substrates.
Vibration Mode (Dynamic Mode). In dynamic mode, the cantilever is oscillated close to its resonance frequency. This vibration mode operates at a frequency-modulation (FM) mode or the more common amplitude-modulation (AM) mode, which are basically the same as the frequencies used in radio communication. In the FM mode, a z-feedback loop keeps a constant force between the tip and the sample while the tip follows the contours of the surface by maintaining the resonance frequency. In the AM mode, the z- feedback loop keeps the constant tip-sample interaction by maintaining the amplitude of oscillation.
Intermittent Contact Mode: The cantilever in dynamic mode can easily be vibrated by a piezoelectric ceramic called a bimorph actuator. In air, the cantilever is oscillated close to its resonance frequency and positioned above a sample surface. When the vibrating cantilever comes close to the surface, its oscillation amplitude may change and can be used as the control signal. In this AM mode, the tip is still in contact with the surface, but it just contacts or ‘‘taps’’ on the surface for a very small fraction of its oscillation period. This operation mode is best known as tapping mode in commercial AFMs and, more generally, as intermittent contact mode.
As a raster scan moves the tip on the sample, the foursegment photodiode measures the vibration signal of the cantilever. The detected signal can be changed to root meansquare values by an analog-to-digital converter. In constant force mode, the z-feedback loop adjusts so that the averaged amplitude of the cantilever remains nearly constant. Each contour of the surface causes a movement of the tip in the xyz-direction, resulting in a change of the oscillation amplitude of the cantilever. This change is measured through a photodiode and finally translated to an image. In air, friction forces due to the surface water layer are dramatically reduced as the tip scans over the surface. Tapping mode may be a far better choice than contact mode for imaging of biological structures due to their inherent softness. In tapping mode, the cantilever can be vibrated at an amplitude of less than 100 nm. Additionally, changes in the phase of oscillation under tapping mode can be used to discriminate between different types of materials on the surface.
Tip-Sample Interaction: The mechanical resonance of the cantilever plays a major role in the response of the system for an interaction between a tip mounted on a vibrating cantilever and a non-homogeneous external force (23). Although basic equations governing the operation of a
bimorph actuator used to vibrate the cantilever are not introduced here, the position of the bimorph is given by:
u ¼ u0 þ Aex cosðvtþÞ
where u0 is the equilibrium position and the excitation is done with amplitude Aex, a frequency v, and a phase shift f. The fundamental resonance frequency of the cantilever can be approximately calculated from equating its strain energy at the maximum deflection to the kinetic energy at the point of zero deformation. A more accurate method, which takes into consideration all the resonance frequencies of the cantilever together with the modes of vibration, can be obtained by solving the equation of motion subject to the boundary conditions (23). A basic equation to describe the motion of the cantilever is briefly introduced. If the tipsample interaction is uniform and includes dissipative force in Newton’s second law, the vibration system including the cantilever can be described as follows:
FðzÞ ¼ kðz uÞ þ yðdz=dtÞ þ mðd2z=dt2Þ |
() |
where F(z) is the tip-sample interaction force, k is a spring constant of the cantilever, z is the vertical position of the cantilever, u is the motion of the bimorph, g is the dissipation term (i.e., the friction coefficient of the material or the environment), and m is the effective mass of the cantilever. For the constant amplitude mode, we assume that the frictional force g (dz/dt) is compensated for by the driving force Fex ¼ k Aex cos(vt þ f). Then, the equation of motion is reduced to F(z) ¼ k z þ m(d2z/dt2). If a strong tip-sample interaction occurs only at the point of contact, the motion of the cantilever tip can be almost perfect harmonic oscillation, z ¼ zo þ A sin vt.
Resolution and Tip Effects: The resolution obtained by an AFM depends greatly on the sharpness of the cantilever tip. Broadening effects usually develop when imaging biological structures having extremely small surface features like a DNA strand (4). If a tip with a radius of curvature of about 20 nm is used to image DNA on a substrate surface, the observed width is about 20 nm, which is considerably greater than the expected value of 2.4 nm deduced from the van der Waals radii of DNA. When the tip radius is comparable with the size of the feature being imaged, it is important to evaluate the radius of the tip end. As such, the development of sharper tips is currently a major concern for commercial vendors, which is also of interest for biologists whose work would greatly benefit from much faster scanning. Recently, improvement of the scanning speed in AFM is one of the most important topics. The tipsample interaction also tends to distort biological structures because they are relatively soft (31).
Phase Imaging: Phase imaging is an extension of tapping mode based on the measurement of the cantilever phase lag (32). The dependence of phase angles in tapping mode AFM on the magnitude of tip-sample interactions has been demonstrated. The phase images of several hard and soft samples have been recorded as a function of the free amplitude and the reference of the tapping amplitude. It is thought that the elastic deformation associated with the
MICROSCOPY, SCANNING FORCE |
509 |
tip-sample repulsive force can be estimated by the repulsive contact interaction. In many cases, phase imaging complements the LFM and force modulation techniques, often providing additional information along with a topographic image. Phase imaging like LFM can also be applied to CFM by using a modified tip with chemical functionality.
Pulsed Force Mode: Pulsed force mode (PFM) is a nonresonant and intermittent contact mode used in AFM imaging (33). It is similar to tapping mode in that the lateral shear forces between the tip and the sample are also reduced. In contrast to tapping mode, the maximum force applied to the sample surface can be controlled, and it is possible to measure more defined surface properties together with topography. This mode is similar to the force modulation techniques of CFM in that a chemically modified tip is used. A series of pseudo force-distance curves can be achieved at a normal scanning speed and with much lower expenditure in data storage. A differential signal can be amplified for imaging of charged surfaces in terms of an electrical double-layer force.
Noncontact Mode: A reconstructed silicon surface has been imaged in a noncontact mode by AFM with true atomic resolution (34). The operation of the AFM is based on bringing the tip in close proximity to the surface and scanning while controlling the tip-sample distance for the constant interaction force. The tip-sample interaction forces in noncontact mode are much weaker than those in contact mode, as shown in Fig. 5. The cantilever must be oscillated above the sample surface at such a distance as is included in the attractive regime of the intermolecular force. Most surfaces are covered with a layer of water, hydrocarbons, or other contaminants when exposed to air, which makes it very difficult to operate in ambient conditions with noncontact mode. Under ultrahigh vacuum, clean surfaces tend to stick together, especially when the materials are identical. The FM mode used in noncontact mode can keep the constant tip-sample interaction by maintaining the resonance frequency of oscillation through the z-feedback loop. Nearly ten years following the invention of the AFM, a few groups achieved true atomic resolution with a noncontact mode (35). After that, several groups succeeded in obtaining true atomiclevel resolution with noncontact mode on various surfaces. Many important yet unresolved problems, such as determining the tip-sample distance where atomic-level resolution can be achieved, still remain. Experimentally, atomic-level resolution can be achieved only between 0 and 0.4 nm. A stiff cantilever vibrates near resonance frequency (300–400 kHz) with amplitude of less than 10 nm.
In covalently bound materials, the charge distribution of surface atoms reflects their bonding to neighboring atoms (36). These charge distributions have been imaged by noncontact mode with a light-atom probe such as a graphite atom. This process revealed features with a lateral distance of only 77 picometers (pm). However, all of the atomic-scale images have been generated in ultrahigh vacuum, which has limited applications in biology. Recently, several groups have reported obtaining atomic-scale images with FM mode in ambient conditions
510 MICROSCOPY, SCANNING FORCE
and liquid environments. In the near future, true atomiclevel imaging by AFM will be commercially available in various environments.
Force Spectroscopy
Equipment
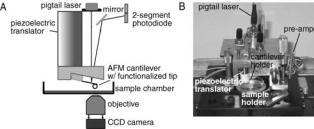
AFM Instrumentation. The AFM that is used in the author’s laboratory is a homemade modification of the standard AFM design that is used for imaging and is shown in Fig. 5 (19). It operates on the same basic principles as a commercial AFM. In the author’s design, improvement of the signal quality by reducing mechanical and electrical noise and improvement of the instrument’s sensitivity by uncoupling the mechanisms for lateral and vertical scans was achieved. The cantilever is moved vertically up and down using a piezoelectric translator (Physik Instrumente, model P-821.10) that expands or contracts in response to applied voltage. The vertical range of the piezo is 0–15 mm. A dish coated with substrate is placed below the cantilever, and the cantilever with a cell or protein attached can be lowered onto that dish using the piezo allowing for the receptor-ligand interaction to take place. During the acquisition of a force scan, the cantilever is bent (Fig. 6) causing the beam of a 3 mW diode laser (Oz Optics; em. 680 nm) that is focused on top of the cantilever to be deflected. A two-segment photodiode (UDT Sensors; model SPOT-2D) monitors these deflections of the laser beam. An 18 bit optically isolated analog-to-digital converter (Instrutech Corp., Port Washington, NY) then digitizes the signal from the photodiode. Custom software is used to control the piezoelectric translator and to time the measurements. The AFM is shielded inside of an acoustic/vibration isolation chamber in order to reduce vibration and aid in keeping a stable temperature. The detection limit of the AFM system is in the range of 20 pN.
Cantilever Calibration. It is necessary to determine the spring constant of the cantilever kC (i.e., F ¼ kCx) in order to translate the deflection of the cantilever x to units of force F. Calibrating the cantilever can be achieved through theoretical techniques that provide an approximation of kC (37) or through empirical methods. Using empirical methods to determine kC involves taking measurements of cantilever deflection with application of a constant known force (38) or measuring the cantilever’s resonant frequency (39). The method the author’s use for calibrating cantilevers is based on Hutter and Bechhoefer (39). The
Figure 6. AFM experimental set-up. (a) Schematic diagram of the AFM. (b) Photograph of the author’s AFM setup. The CCD camera is not in view.
author’s use triangleshaped unsharpened gold-coated sili- con-nitride cantilever tips that have spring constants ranging from 10 mN/m to 50 mN/m for ligand-receptor force measurements (TM Microscopes, Sunnyvale, CA). The cantilever tip can be treated as a simple harmonic oscillator whose power spectrum of thermal fluctuation can be used to derive the spring constant, which can be achieved by raising the cantilever a few microns from the surface of the experimental dish and monitoring its natural vibrational frequency for 2–3 s. Each vibration mode of the cantilever receives the thermal energy commensurated to one degree of freedom, kB T/2. The measured variance of the deflection hxi2, can then be used to calculate the spring constant (i.e., kBT ¼ kChxi2, where kB and T are Boltzmann’s constant and temperature, respectively). To separate deflections belonging to the basic (and predominant) mode of vibration from other deflections or noise in the recording system, the power spectral density of the temperature-induced deflection is determined. The spring constant is estimated using only the spectral component corresponding to the basal mode of vibration. The spring constant can be calibrated in either air or solution using this approach. The calculated spring constant kC can then be used to calculate rupture force F by F ¼ kCCD V. DV is the change in voltage detected by the photodiode just prior to and immediately after the rupture event. C is a calibration constant that relates deflection and photodiode voltage and is determined from the deflection of the cantilever when it is pressed against a rigid surface, such as the bottom of a plastic petri dish (19).
Applications
Receptor-Ligand Adhesion Measurements. Bell Model:
AFM force measurements (Fig. 7) of ligand-receptor interactions can be used to determine the dynamic strength of a complex and characterize the changes in free energy that the particular complex undergoes (i.e., energy landscape) during its breakage. The Bell model can be used to interpret these measurements (40). The Bell model is based on the assumption that the application of an external mechanical force to a receptor-ligand interaction bond will reduce the activation energy that needs to be overcome in order to break this bond. This unbinding force should increase with the logarithm of the rate at which an external mechanical force is applied toward the unbinding of adhesion complexes (i.e., loading rate), which was confirmed by a number of studies. For example, studies using the biomembrane force probe (BFP) (40) and the AFM have shown that increases in loading rate cause an increase in rupture force between individual complexes of streptavidin/biotin (12,15,41).
AFM Measurements of Adhesive Forces: In order to carry out force measurements, a cell is first attached to a cantilever tip and another cell or substrate proteins are plated on a dish. The method employed to attach cells to the cantilever tip works best on nonadherent items. A cell is attached to the AFM cantilever via concanavalin A (con A)- mediated linkages (15). Most cells have receptors for con A on their surface and will attach to the tip. To prepare the con A-functionalized cantilever, the cantilevers are soaked
MICROSCOPY, SCANNING FORCE |
511 |
AFM cantilever
Approach |
3A9 |
|
Immobilized ICAM-1
Contact
Retract
Separation
Figure 7. Steps in the acquisition of an AFM force measurement. The first step is the approach of the cantilever with a cell bound to the substrate, followed by contact between the cell and substrate and retraction of the cantilever, which results in the separation of the cell from the substrate. The cantilever is bent during this process. The arrows indicate the direction of cantilever movement.
in acetone for 5 min, UV irradiated for 30 min, and incubated in biotinamidocaproyl-labeled bovine serum albumin (biotin-BSA, 0.5 mg/ml in 100 mM NaHCO3, pH 8.6; Sigma) overnight. The cantilevers are then rinsed three times with phosphate-buffered saline (PBS, 10 mM PO43 , 150 mM NaCl, pH 7.3) and incubated in streptavidin (0.5 mg/ml in PBS; Pierce, Rockford, IL) for 10 min at room temperature. Following the removal of unbound streptavidin, the cantilevers are incubated in biotinylated Con A (0.2 mg/ml in PBS; Sigma) and then rinsed with PBS.
The actual process of attaching a cell to a cantilever tip is reminiscent of fishing. A cantilever tip is positioned above the center of the cell. The largest triangular cantilever (320 mm long and 22 mm wide) with a spring constant of 0.017 N/m on the cantilever chip is usually used in our measurements. The cell is brought into focus, with the cantilever slightly out of focus. Then, the tip is lowered onto the center of the cell and held there motionless for approximately 1 s. When attached, the cell is positioned right behind the AFM cantilever tip. The force required to dislodge the cell from the tip is greater than 2 nN, which is much greater than the forces measured in the receptorligand studies that were, at most, 300 pN (15).
A piezoelectric translator is used during measurement acquisition to lower the cantilever with an attached cell onto the sample. The interaction between the attached cell and the sample is given by the deflection of the cantilever. This deflection is measured by reflecting a laser beam off the cantilever into a position sensitive two-segment photodiode detector, as described in the instrumentation section above.
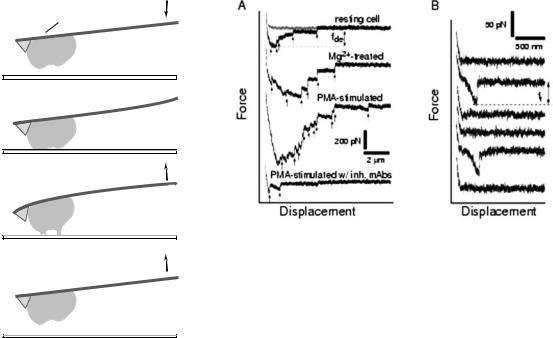
Figure 8. AFM force versus displacement traces of the interaction between cells expressing LFA-1 and immobilized ICAM-1. (a) Multiple-bond measurements acquired with a compression force of 200 pN, 5 s contact, and a cantilever retraction speed of 2 mm/s. The measurements were carried out with a resting, untreated cell (1st trace), a Mg2þ-treated cell (2nd trace), and a PMA-stimulated cell (3rd trace). The 4th trace corresponds to a measurement acquired from a PMA-stimulated cell in the presence of LFA-1 (20 mg/ml FD441.8) and ICAM-1 (20 mg/ml BE29G1) function-blocking monoclonal antibodies (mAbs). Arrows point to breakage of LFA-1/ICAM-1 bond(s). fde is the detachment force, and the shaded area estimates the work of de-adhesion. (b) Single-molecule measurements of LFA-1/ICAM-1 unbinding forces. Traces 2 and 5 show adhesion. Measurements were obtained under conditions that minimized contact between the LFA-1-expressing cell and the ICAM-1-coated surface. The compression force was reduced to 60 pN and the contact time to 50 ms. An adhesion frequency of less than 30% in the force measurements ensured that a > 85% probability exists that the adhesion event is mediated by a single LFA-1/ICAM-1 complex (42,43). The frequency of adhesion in test and control experiments was examined to confirm the specificity of the interaction. The addition of monoclonal antibodies against either LFA-1 or ICAM-1 significantly lowered the frequency of adhesion of both resting cells and activated cells under identical experimental conditions.
As a result of this process, a force scan is obtained. The studies shown in Fig. 8 (42,43) were conducted on cells expressing the adhesion receptor LFA-1 (leukocyte func- tion-associated antigen-1), an integrin expressed on the surface of T-cells, and its ligand ICAM-1 (intercellular adhesion molecule-1), expressed on the surface of APCs. In these experiments, LFA-1-expressing cells and ICAM-1 protein were used. An example of a few force scans from multiple bond cell adhesion studies can be seen in Fig. 8a. The red trace is the approach trace and the black is the retract trace. As the cantilever is lowered and contact is made between the cell and substrate, an initial increase in force occurs. As the cantilever is retracted back up, the force returns to zero and becomes negative as bonds are stretched and begin to break. The jumps in the force scan, which are pointed out by the arrows, represent bonds breaking. Two parameters can be used in such measurements to assess the level of cell adhesion. One is the detachment force, which is the maximum force required to dislodge the cell. Another is the work of deadhesion, which is the amount of work required to pull and stretch
512 MICROSCOPY, SCANNING FORCE
the cell and for the bonds to break. It is derived by integrating the adhesive force over the distance traveled by the cantilever. In this example, Mg2þ and PMA are used, which enhance the adhesion of the cells studied through various mechanisms. It is easily observed that a very pronounced increase occurs in the area under the curve as well as the number of bonds that were broken following the application of these adhesion stimulators (16).
FM Force Measurements of Individual Receptor/Ligand Complexes: A different set of information can be derived from single-molecule adhesion measurements. These type of studies offer insight into the dissociation pathway of a receptor-ligand interaction and the changes in free energy that are associated with this process, which is achieved by measuring single-bond interactions between a receptor and ligand at increasing loading rates (20 pN/s– 50,000 pN/s). In the author’s setup, it translates to using rates of retraction of the cantilever from 0.1 to 15 mm/s.
In order to obtain unbinding forces between a single receptor-ligand pair, the experiments have to be carried out in conditions that minimize contact between the cantilever tip and substrate. A > 85% probability exists that the adhesion event is mediated by a single bond if the frequency of adhesion is maintained below 30% (15,42). An example of such measurements can be seen in Fig. 8b.
Depending on the speed at which the cantilever is retracted during the measurements, the collected data usually needs to be corrected for hydrodynamic drag, which is due to the hydrodynamic force that acts in the opposite direction of cantilever movement, and its magnitude is proportional to the cantilever movement speeds. The hydrodynamic force may be determined based on the method used by Tees et al. and Evans et al. (42,43). In single-bond AFM studies, it is found that the data obtained with cantilever retraction speeds higher than 1 mm/s needed to be corrected by adding the hydrodynamic force.
The damping coefficient can be determined by plotting the hydrodynamic force versus the speed of cantilever movement. The damping coefficient is the slope of the linear fit and was found to be about 2 pN &s/mm in the author’s work (15).
AFM Measurements of Cell Elasticity. The AFM can also be used as a microindenter that probes the mechanical properties of the cell. In these measurements, which enable assesment of cell elasticity, a bare AFM tip is lowered onto the center of the cell surface at a set rate, typically 2 mm/s. Following contact, the AFM tip exerts a force against the cell that is proportional to the deflection of the cantilever. The indentation force used is below 1 nN ( 600 pN) in order to prevent damage to the cell. The deflection of the cantilever is recorded as a function of the piezoelectric translator position during the approach and withdrawal of the AFM tip. The force-indentation curves of the cells are derived from these records using the surface of the tissue culture dish to calibrate the deflection of the cantilever. Then, one can estimate the Young’s modulus, which is a measure of elasticity. Estimates of Young’s modulus are made on the assumptions that the cell is an isotropic elastic
A |
AFM tip |
α |
θ |
3A9 cell |
B |
|
1.0 |
|
PMA |
|
|
|
|
|
|
|
|
|
||
(µm) |
|
|
|
|
|
|
|
|
|
|
|
Resting |
|||
|
Indentation |
|
|
|
|||
|
0.5 |
|
|
Mg |
2+ |
/EGTA |
|
|
|
|
|
||||
|
|
|
|
|
|
||
|
|
0 |
|
|
|
|
|
|
|
0 |
100 |
200 |
300 |
|
|
|
|
|
Force (pN) |
|
|
|
|
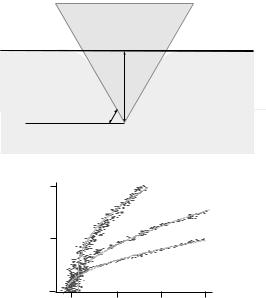
Figure 9. Acquisition of cell compliance measurements. (a) Tip of the AFM cantilever indenting a 3A9 cell. The cell compliance measurements were based on the assumption that the cell is an isotropic elastic solid and the AFM tip is a rigid cone (44–46). According to this model, initially proposed by Love and Hertz, the force (F)-indentation (a) relation (shown) is a function of Young’s modulus of the cell, K, and the angle formed by the indenter and the plane of the surface, u, as in equation (1). The indenter angle, u, is assumed formed by the AFM tip and the 3A9 cell to be 558 and the Poisson ratio n to be 0.5. (b) Force versus indentation traces of resting, PMA-stimulated and Mg2þ-treated 3A9 cells.
solid and the AFM tip is a rigid cone (44–46). According to this model, initially proposed by Hertz, the force (F) indentation (a) relation is a function of Young’s modulus of the cell, K, and the angle formed by the indenter and the plane of the surface, u, as follows:
F ¼ |
|
|
K |
|
|
|
4 |
a2 |
ð1Þ |
2 1 |
|
v2 |
Þ |
|
p tan u |
||||
|
ð |
|
|
|
|
|
|||
Young’s modulus are obtained in the author’s laboratory by least square analysis of the forceindentation curve using routines in the Igor Pro (WaveMetrics, Inc., Lake Oswego, OR) software package. The indenter angle u and Poisson ratio n are assumed to be 558 and 0.5, respectively.
In order to determine the cell’s elasticity, the force versus indentation measurements are fitted to the curves of the Hertz model. Figure 9 (44–46) illustrates an example of such measurements acquired on cells of varying elasticity. Cells with the greatest degree of indentation at a particular applied force will have the lowest Young’s modulus values and will therefore be the ‘‘softest.’’
Protein Folding/Unfolding. The AFM can also be used to study protein unfolding. A cantilever tip is used to pick up proteins attached to a surface, which is followed by retrac-
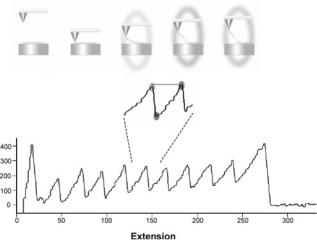
Figure 10. Consecutive unfolding peaks of a titin polyprotein, composed of FNIII domains. The inset demonstrates the corresponding steps of the unfolding process in correlation to the AFM data.
tion of the cantilever, which results in protein unfolding. The length of the unfolded protein can be over ten times its folded length, depending on the protein being studied (9).
This forced protein unfolding generates an opposing force due to the sudden drop in entropy as the protein is unfolded. Although a lower force is required to begin unfolding the protein, the force required to continue the unfolding is increased rapidly as the protein approaches its full, unfolded length. This phenomenon has been described by the worm-like chain model (WLC) of elasticity. The WLC model is based on two parameters, the total or contour length of the polymer being stretched and the persistence length. The persistence length reflects the polymer flexibility and is the length attained when a polymer is bent. A smaller persistence length is an indication of higher entropy and a polymer that is more difficult to unfold (47). When a multidomain protein is extended using the AFM, the first domain is unfolded at a certain pulling force, followed by a return of the cantilever to zero. Further unfolding meets with resistance once again, resulting in a characteristic saw-tooth profile of the unfolding, with each domain that was unfolded being represented by a peak. Figure 10 from Andreas F. Oberhauser illustrates this process. It is the unfolding of a titin polyprotein, which is composed of FNIII domains (22). The protein can also be refolded following unfolding, which is done by bringing the cantilever back down to the substrate and once again retracting it. If force curves representative of unfolding are observed once again, then refolding most likely took place. It is a much slower process (on the order of seconds) than the forced unfolding (48).
EVALUATION
Imaging AFM
The AFM is an exciting novel technology that enables the study of biological structures under physiological conditions. The AFM is probably the only technique of its kind
MICROSCOPY, SCANNING FORCE |
513 |
that enables image dynamic processes taking place in real time. A number of other techniques are currently available in the biological sciences for imaging studies, however, most result in modifications to the biological sample. One such technique is electron microscopy (EM), which, until recently, provided images of the highest resolutions. In recent years, a number of modifications to the AFM have brought the resolution up to par and even surpassed those of EM.
In recent years, many advances have been made in the field of AFM. Significant improvements in resolution have been gained through cantilever tip modification. The currently available cantilevers are relatively ‘‘soft’’ and flexible with spring constants of 0.01–0.5 N/m. Tip deformation is one aspect that limits resolution. Recently, stiffer cantilevers have been designed improving resolution. One example are quartz cantilevers with spring constants on the order of 1 kN/m allowing for possibly subatomic-level resolution (34). Smaller cantilevers have been designed that increase the possible scanning speed of the AFM. Images of 100 100 pixels (240 nm scan size) have been achieved in 80 ms. A sharper, finer tip can also improve resolution, which has been achieved through the use of carbonanotubes, probably the greatest probe improvement to date, which are seamless cylinders composed of sp2-bonded Carbon (49).
Several characteristics exist that make Carbon nanotubes improved AFM tip materials, including small diameter, a high aspect ratio, large Young’s modulus, and mechanical robustness. They are able to elastically buckle under large loads. All these properties translate into higher sample resolution. Chemical vapor deposition has made it easier to grow Carbon nanaotubes on cantilever surfaces, a process that replaces previously more laborious and time-consuming attachment techniques (4,50).
A few techniques also exist worth mentioning that have improved AFM imaging. One such method is cryoAFM. This method addresses the previously mentioned problem of tip and sample flexibility. In this case, samples are imaged at extremely cold temperatures in their cryogenic states, which provides a rigid surface that exhibits a high Young’s modulus, thus reducing cantilever deformation and increasing resolution. CryoAFM images match and surpass EM images. Other improvements address the problem resulting from the vibration induced by the commonly used piezoelectric translator. This vibration is translated to the cantilever holder and the liquid containing the sample being imaged. Magnetic mode (MAC) eliminates the cantilever holder entirely and replaces it with a magnetic cantilever. The cantilever is manipulated via a magnetic field. Photothermal mode (PMOD) uses a bimetallic cantilever that is oscillated via a pulsed diode laser (50,51).
Advances have also been made in single-molecule manipulation with a nanomanipulator. This method relies on a force feedback pen that actually allows the user to touch and manipulate the sample being studied. For example, one can dissect DNA from a chromosome. The interaction forces involved during manipulation of samples can also be studied through oscillating mode imaging. The nanomanipulator can now measure forces in the pN–mN range. For excellent reviews on this technique, see Yang et al. (50) Fotiadis et al. (52).
514 MICROSCOPY, SCANNING FORCE
Progress has also been made in imaging of membrane proteins, which are not ideal candidates for X-ray crystallography, as they do not readily form 3D crystals. Atomiclevel resolution images have been obtained of membrane proteins complexed with lipids using EM. However, AFM images of these proteins offer an improvement in that they can be carried out in near physiological conditions and allow for the acquisition of functional and structural information (50,52).
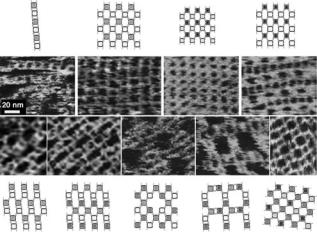
The continued improvements leading to the enhanced imaging capabilities of AFM are reflected in the most recent work being done in the field. We would like to highlight one area where a great deal of progress has been made, which is the filed of DNA and RNA assembly of nanostructures in which the imaging AFM plays a pivotal role. Some of the earlier successes in this area included the construction of 2D DNA arrays, which were assembled in a predictable manner (53). Much progress has also been made with RNA in an attempt to design self-assembling building blocks. The goal of such studies is to generate molecular materials, the geometry of which can be determined for applications in nanobiotechnology (54–56). Chworos et al. were able to form stable RNA structures termed ‘‘tectosquares’’ from RNA helices without the presence of proteins (5). ‘‘TectoRNAs’’ can be thought of as RNA Lego blocks that can be used for the formation of supramolecular structures. In order for these structures to be assembled, the right conditions have to be met in terms of divalent ion concentrations, temperature, as well as the strength, length, and orientation of the RNA. The AFM is an essential tool used in this process as it allows the researcher to obtain detailed images of the assembled tectosquares providing the opportunity to compare predicted structures with those that actually formed. The structures formed by Chworos et al. were in good agreement with the predicted structures. Figure 11 demon-
Figure 11. Diagram and AFM images of tectosquare nanopatterns generated from 22 tectosquares. One micrometer square scale AFM images obtained in solution (clockwise from the upper leftmost image) for the ladder pattern, fish net pattern, striped velvet pattern, basket weave pattern, cross pattern, tartan pattern, polka dot pattern, lace pattern, and diamond pattern. Scale bar, 20 nm.
strates the amazing predictability of assembly of these structures, where nine different types of RNA patterns were created (5). Such DNA and RNA structures may have applications in nanotechnology and the material sciences as they could be used to generate nanochips, nanocircuits, and nanocrystals (57). For an excellent recent review of DNA nanomechanical devices, please see Seeman (58).
Force Spectroscopy
Force spectroscopy allows us to measure interaction forces between receptors and their respective ligands. These studies can be carried out with purified proteins or cells, or a combination of both. Traditionally, adhesion measurements have been conducted using adhesion assays, which involve the attachment of cells to dishes coated with substrate. The cells are later dislodged manually or using a centrifuge, which are older yet still viable techniques that provide basic kinetic information about the interaction of a receptor-ligand pair. More advanced techniques for conducting force measurements include the use of microneedles, optical tweezers, magnetic beads, and the biomembrane force probe. These techniques, much like the AFM, provide more advanced information from which energy landscapes of an interacting receptor-ligand pair may be determined (11).
The AFM is also a powerful tool for determining the mechanical properties of cells, which was traditionally done using micropipettes or the cell poker, which offered much less precision than the AFM. More recently, methods such as the scanning acoustic microscope, optical tweezers, and magnetic tweezers have also been used in addition to the AFM (59).
An important advantage of the AFM over other methods is that it can be used in conjunction with other techniques through relatively simple modifications. Recently, it has been combined with the patch clamp technique to study the mechanically activated ion channels of sensory cells of the inner ear. This strategy allowed the researchers to use the AFM tip to stimulate the mechanosensory hair bundles by exerting force on them and measure the electrical output of the patch clamp simultaneously (9,60). Another example is combining an AFM with a confocal microscope, which could allow one to monitor cellular responses to AFM measurements using fluorescent reporter systems. One could monitor calcium levels, expression of caspases, and so on (61,62). The AFM could also be combined with RICM microsopy as well as FRET.
Other recent advances involve modifications that would allow for more efficient and effective receptor-ligand studies, including the use of more than one cantilever on the same chip simultaneously. In this case, multiple proteins could be attached and their interaction with their ligand could be measured. So far, this approach has been done with two cantilevers, which involves the use of two laser beams. Further modifications could allow for measurements with even more proteins. Improvements can also be mad in plating of the ligands proteins. In the ideal scenario, different proteins could be plated so that interaction between different receptor-ligand pairs cools be
carried out simultaneously. Current improvements also involve finding better ways to attach cells and proteins to the cantilever that would result in covalent attachment to the tip. Another area that requires improvement is data analysis. The currently available analysis program involves days of rather tedious computer time. Automating analysis would greatly reduce the time required to study a particular interaction. Also, some improvements can be made in data acquisition, where still frequent adjustments of cantilever retraction speed and contact time are required throughout the course of the experiment. Automating data acquisition would allow experiments to be carried out during the night, when noise levels are also minimal.
The applications of AFM technology are vast and too numerous to describe in one review article. The author’s have attempted to summarize the technology that was deemed to be of great importance in the developing field of AFM. AFM technology is still limited to a relatively small number of laboratories, which is most likely due to the lack of familiarity with the field, limited expertise in operation, as well as the expense involved in acquiring an AFM. However, it is changing as more and more people are discovering the possibilities that become open to them if they acquire and familiarize themselves with this technology.
BIBLIOGRAPHY
1.Binnig G, Quate CF, Gerber C. Atomic force microscope. Phys Rev Lett 1986;56:930–933.
2.Heinz WF, Hoh JH. Spatially resolved force spectroscopy of biological surfaces using the atomic force microscope. Trends Biotechnol 1999;17(4):143–150.
3.Engel A, Lyubchenko Y, Muller D. Atomic force microscopy: A powerful tool to observe biomolecules at work. Trends Cell Biol 1999;9(2):77–80.
4.Hansma HG. Surface biology of DNA by atomic force microscopy. Annu Rev Phys Chem 2001;52:71–92.
5.Chworos A, et al. Building programmable jigsaw puzzles with RNA. Science 2004;306(5704):2068–2072.
6.Kasas S, et al. Escherichia coli RNA polymerase activity observed using atomic force microscopy. Biochemistry 1997; 36(3):461–468.
7.Rivetti C, et al. Visualizing RNA extrusion and DNA wrapping in transcription elongation complexes of bacterial and eukaryotic RNA polymerases. J Mol Biol 2003;326(5):1413–1426.
8.Pesen D, Hoh JH. Modes of remodeling in the cortical cytoskeleton of vascular endothelial cells. FEBS Lett 2005;579(2): 473–476.
9.Horber JKH. Local probe techniques. Methods Cell Biol 2002;68:1–32.
10.Lee GU, Kidwell DA, Colton RJ. Sensing discrete streptavidinbiotin interactions with AFM. Langmuir 1994;10(2):354–361.
11.Zhang X, Chen A, Wojcikiewicz E, Moy VT. Probing ligandreceptor interactions with atomic force microscopy. In: Protein-Protein Interactions: A Molecular Cloning Manual. Cold Spring Harbor, NY: Cold Spring Harbor Laboratory Press; 2002. p 241–254.
12.Yuan C, et al. Energy landscape of streptavidin-biotin complexes measured by atomic force microscopy. Biochemistry 2000;39(33):10219–10223.
13.Benoit M, et al. Discrete interactions in cell adhesion measured by single molecule force spectroscopy. Nat Cell Biol 2000;2(6):313–317.
MICROSCOPY, SCANNING FORCE |
515 |
14.Benoit M. Cell adhesion measured by force spectroscopy on living cells. Methods Cell Biol 2002;68:91–114.
15.Zhang X, Wojcikiewicz E, Moy VT. Force spectroscopy of the leukocyte function-associated antigen-1/intercellular adhesion molecule-1 interaction. Biophys J 2002;83(4):2270– 2279.
16.Wojcikiewicz EP, et al. Contributions of molecular binding events and cellular compliance to the modulation of leukocyte adhesion. J Cell Sci 2003;116(12):2531–2539.
17.Matzke R, Jacobson K, Radmacher M. Direct, high-resolution measurement of furrow stiffening during division of adherent cells. Nat Cell Biol 2001;3(6):607–610.
18.Hassan AE, et al. Relative microelastic mapping of living cells by atomic force microscopy. Biophys J 1998;74(3):1564– 1578.
19.Wojcikiewicz EP, Zhang X, Moy VT. Force and compliance measurements on living cells using atomic force microscopy (AFM). Biol Proced Online 2004;6:1–9.
20.Rief M, et al. Reversible unfolding of individual titin immunoglobulin domains by AFM [see comments]. Science 1997;276(5315):1109–1112.
21.Oesterhelt F, et al. Unfolding pathways of individual bacteriorhodopsins [see comments]. Science 2000;288(5463):143– 146.
22.Li H, et al. Reverse engineering of the giant muscle protein titin. Nature 2002;418(6901):998–1002.
23.Sarid D. Scanning Force Microscopy. New York: Oxford University Press; 1991.
24.Meyer G, Amer NM. Novel optical approach to AFM. Appl Phys Lett 1988;53:1045–1047.
25.Israelachvili JN. Intermolecular and Surface Forces. 2nd ed. London: Academic Press; 1992.
26.Meyer G, Amer NM. Simultaneous measurement of lateral and normal forces with an optical-beam-deflection AFM. Appl Phys Lett 1990;57(20):2089–2091.
27.Mate CM, et al. Atomic-scale friction of a tungsten tip on a graphite surface. Phys Rev Lett 1987;59(17):1942–1945.
28.Overney RM, et al. Friction measurements on phasesegregated thin films with a modified atomic force microscope. Nature 1992;359:133–135.
29.Frisbie CD, et al. Functional group imaging by chemical force microscopy. Science 1994;265:2071–2074.
30.Piner RD, et al. ‘‘Dip-Pen’’ nanolithography. Science 1999; 283(5402):661–663.
31.Kwak KJ, et al. Topographic effects on adhesive force mapping of stretched DNA molecules by pulsed-force-mode atomic force microscopy. Ultramicroscopy 2004;100(3– 4):179–186.
32.Magonov SN, EV, Whango MH. Phase imaging and stiffness in tapping mode AFM. Surf Sci 1997;375:L385–L391.
33.Miyatani T, Horii M, Rosa A, Fujihira M, Marti O. Mapping of electrical double-layer force between tip and sample surfaces in water with pulsedforcemode atomic force microscopy. Appl Phys Lett 1997;71:2632–2634.
34.Giessibl FJ, et al. Subatomic features on the silicon (111)- (7 7) surface observed by atomic force microscopy. science 2000;289(5478):422–426.
35.Morita SR, Wiesendanger R, Meyer E. Noncontact AFM. New York: Springer; 2002.
36.Hembacher S, Giessibl FJ, MJ. Force microscopy with lightatom probes. Science 2004;305(5682):380–383.
37.Sader JE. Parallel beam approximation for V-shaped atomic force micrscope cantilevers. Rev Sci Instrum 1995;66:4583– 4587.
38.Senden TJ, Ducker WA. Experimental determination of spring constants in atomic force microscopy. Langmuir 1994;10: 1003–1004.