

120 IMPEDANCE PLETHYSMOGRAPHY
57.Morgan RA, et al. High efficiency TCR gene transfer into primary human lymphocytes affords avid recognition of melanoma tumor antigen glycoprotein 100 and does not alter the recognition of autologous melanoma antigens. J Immunol 2003;171:3287–3295.
58.Scholten KB, et al. Preservation and redirection of HPV16E7specific T cell receptors for immunotherapy of cervical cancer. Clin Immunol 2005;114:119–129.
59.Chamoto K, et al. Potentiation of tumor eradication by adoptive immunotherapy with T-cellreceptor gene-transduced T- helper type 1 cells. Can Res 2004;64:386–390.
60.Jeffes EWB, et al. Antiangiogenic drugs synergize with a membrane macrophage colony-stimulating factory-based tumor vaccine to therapeutically treat rats with an established malignant intracranial glioma. J Immunol 2005;174:2533– 2543.
61.Teitz-Tennenbaum S. et al. Radiotherapy potentiates the therapeutic efficacy of intratumoral dendritic cell administration. Can Res 2003;63:8466–8475.
62.Ito F, et al. Anti-CD137 monoclonal antibody administration augments the antitumor efficacy of dendritic cell-based vaccines. Can Res 2004;64:8411.
63.Huang H, Li F, Gordon JR, Xiang J. Synergistic enhancement
of antitumor immunity with adoptively transferred tumorspecific CD4þ and CD8þ T cells and intratumoral lymphotactin transgene expression. Can Res 2002;62:2043.
64.Lou Y, et al. Dendritic cells strongly boost the antitumor activity of adoptively transferred T cells in vivo. Can Res 2004;64:6783.
65.Strome SE. B7-H1 blockade augments adoptive T-cell immunotherapy for squamous cell carcinoma. Can Res 2003;63: 6501.
66.Lyman MA, et al. The fate of low affinity tumor-specific CD8þ T cells in tumor-bearing mice. J Immunol 2005;174:2563– 2572.
See also BORON NEUTRON CAPTURE THERAPY; MONOCLONAL ANTIBODIES.
IMPEDANCE PLETHYSMOGRAPHY
HELMUT HUTTEN
University of Technology
Graz, Australia
INTRODUCTION
Plethysmography is a volumetric method, that is, a method for the assessment of a volume (the Greek words plethys and plethora mean full and fullness, respectively). Impedance plethysmography is based on the measurement of passive electrical properties of biological tissues. Those passive electrical properties are parameters of the so-called bioimpedance. The first publication about impedance plethysmography by Nyboer et al. (1) dates back to 1943. Pioneering contributions to the basic understanding of the relations between the assessment of volumes by impedance plethymosgraphy and the electrical properties of biological tissue have been provided by Schwan et al. (2) already in 1955. But already by the end of the nineteenth century Stewart had used the recording of electrical conductivity to study transit times between different sites of the body after injection of saline into the circulation (3). Blood flow record-
ing is one of the most relevant fields for the clinical application of impedance plethysmography nowadays.
Impedance plethysmography is a volumetric method that aims to assess a volume or changes of a volume. Usually, a volume is the filling volume of a space that is enclosed by geometric boundaries. In this case, volumetry means the determination of the boundaries with subsequent assessment of the volume within the boundaries. Those boundaries can be determined by the impedance method if the electrical properties of the substances on both sides of the boundaries are different.
Impedance plethysmography, however, can also be applied to the assessment of volumes that are not lumped compartments within geometric boundaries, for example, it can be used for the volumetric measurement of a certain component within a mixture. Such components may be cells (e.g., the volume of cells in blood), tissues (e.g., the volume of fat tissue in the body), spaces with different composition (e.g., intraand extracellular spaces), or the volume of the air that is enclosed in the alveoli of lung tissue. In that case, volumetry means the estimation of the space that would be occupied by the respective component if it would be concentrated in one single lumped compartment. Usually, this volume is estimated as a percentage of the whole distribution volume, for example, the volume of cells in blood or the content of water in the whole body. The electrical properties of the respective component must be different from those of all other components. The volumetric assessment does not require a homogeneous distribution of the considered component within the given space if the actual distribution can be taken into account, for example, by a model. Under certain conditions, a tissue can be identified by specific features like morphological structure and/or chemical composition if those features are related with its electrical properties.
The typical application of plethysmography in clinical routine is the diagnosis of those diseases for which the measurement of volumes or changes of volume renders possible the interpretation of functional disorders or functional parameters. The most widely and routinely applied diagnostic examinations are concerned with:
1.Heart: Cardiac mechanical disorders by impedance cardiography (i.e., pumping insufficiency by measuring cardiac stroke volume, including heart rate and other cardiac parameters like ejection period). This application is discussed in another article.
2.Peripheral circulation: Vascular disorders by impedance rheography (i.e., deep venous thrombosis by impedance phlebography, and estimation of blood flow in the brain or other peripheral vessels).
3.Lung: Ventilatory disorders by impedance pneumography (i.e., insufficient ventilation by monitoring the tidal volume and/or respiratory rate).
METHODOLOGY
Impedance plethysmography is a noninvasive method that employs contacting, usually disposable electrodes, in most cases metal-gel electrodes, for example, with Ag/AgCl for
the metal plate. Usually, the electrodes have circular geometry; however, other geometries might be preferable, for example, band-like geometry for segmental measurement at the extremities. It must be considered that the metal plates of electrodes are areas with the same potential, and therefore may affect the electromagnetic field distribution in the considered object. Electrodes with small areas help to reduce that effect, whereas electrodes with large areas render it possible to reach a more homogenous current field in the measured object.
Contacting electrodes can easily be attached to the skin or surface of the measurement object, usually by an adhesive material that is already fixed to the electrode. Only in special cases, for example, for research purposes, does the measurement require invasive application.
Different contactless measurement modes gain increasing attention, for example,
1.Microwave-based methods with antennas as applicators and measurement of the scattered electromagnetic field.
2.Methods based on exploiting the magnetic instead of the electrical properties: inductive plethysmography that uses coils and records the changes in the inductance and magnetic susceptibility plethysmography that employs strong magnetic fields and records the changes in the magnetic flux, for example, by superconducting quantum interference devices (SQUID).
All bioimpedance-based methods are aiming at recording either the effect on the applied electromagnetic field by the measurement object or the response of the measurement object to the application of the electromagnetic field. The directly measured quantities are electrical quantities, for example, voltages or currents. Those quantities are actually imaging electrical coefficients, for example, conductivity, permittivity, or resistivity, which are materialspecific parameters of the tissue impedance and monitor its morphological structure and/or chemical composition. With these material-specific parameters the geometric boundaries are determined and used for the estimation of the volume or volume changes. Relations between the measured electrical parameters and the volume are usually based on models. The employed models can be very simple, for example, described by simple geometric boundaries like cylinders, spheres, or ellipsoids. More complex 3D models may be described by the finite element method (FEM) or similar approaches, which allows simulating the distribution of the electromagnetic field in the measured object, that is, the current pathways and the iso-potential planes. Sophisticated iterative optimization procedures are employed to match the simulated values with the measured ones (4).
Electrical impedance tomography (EIT) is a direct approach for determining the 3D geometry of those compartments with the same material-specific parameters in a biological object like the human torso or an extremity. This technique uses multiple electrodes, usually arranged in a plane. Mapping (or imaging) of the impedance distribution in the examined cross-sectional layer requires the solution of the inverse or back-projection problem. Actually, the
IMPEDANCE PLETHYSMOGRAPHY |
121 |
obtained 2D image is a pseudo-3D image since the current pathways are not constrained to the examined layer. Electrical impedance tomography supplies a comparable nearanatomic cross-sectional image comparable to those of other CT-based procedures [e.g., X-ray CT, NMR, or ultrasound (US)], however, with very poor spatial resolution. Boundaries of compartments with the same material-spe- cific coefficients are found by segmentation. Segmented areas with assumed thickness of the single layers are used for volume estimation. Changes in the volume can be assessed by comparing the volumes obtained in consecutive images.
It is a characteristic feature of all methods that record the electrical bioimpedance that the evoked response depends on the strength of the local electromagnetic field. For this reason, it has to be taken into account that the resulting current density may be inhomogeneous in the considered tissue volume. Causes for such nonhomogeneity may be geometric constraints (e.g., a nonregular shape of the considered volume); the composition of the tissue within the considered volume that may be a mixture of tissues with different electrical properties (e.g., blood with low resistivity, or bone with high resistivity, as compared with skeletal muscle). Those different tissues may electrically be switched in parallel or serial order; and the size and the location of the current-feeding electrodes. The current density is higher in regions near to the feeding electrodes than in distant regions. Consequently, the regions near to the feeding electrodes give the strongest contribution to the measured voltage.
This requires (1) careful selection of the current-feeding site. In the tetrapolar mode also the position of the voltagesensing electrodes must be taken into account; and (2) appropriate consideration of the inhomogeneous distribution of the electrical parameters within the considered tissue volume, that is, the course of blood vessels.
Special electrode arrangements have been developed for certain applications in order to minimize the measurement errors. Concentric multielectrode arrangements with the outer electrodes on a potential different from that of the inner electrode have been proposed with the objective to optimize the current distribution in the measured volume.
The frequency that can be used for the measurement of the passive electrical properties of biological tissue ranges from very low frequencies to some gigahertz. The most popular frequency band for impedance plethysmography is between 1 kHz and 10 MHz. This frequency band encloses the so-called b-dispersion, which is actually a dielectric or structural relaxation process. The b-dispersion is also known as Maxwell–Wagner relaxation. It is characterized by a transition in the magnitude of the electrical parameters with frequency. This transition is caused by the fact that cellular membranes have high impedance below and low impedance above that b-dispersion. For frequencies distinctly below the b-dispersion, the current flow is restricted to the extracellular space. For frequencies distinctly above the b-dispersion, the current can pass through the cellular membrane. Consequently, with frequencies distinctly below the b-dispersion only the volume or volume changes of the extracellular space will be monitored, whereas with frequencies distinctly above the

122 |
IMPEDANCE PLETHYSMOGRAPHY |
|
|
|
|
|
|
|||
Table 1. Compilation of Typical Values of Resistivity (V m) of Various Body Tissuesa |
|
|
|
|||||||
|
|
|
|
|
|
|
Frequency |
|
|
|
|
|
|
|
|
|
|
|
|
|
|
|
|
10 Hz |
100 Hz |
1 kHz |
10 kHz |
100 kHz |
1 MHz |
10 MHz |
100 MHz |
|
|
|
|
|
|
|
|
|
|
||
Muscle, skeletal |
9.6 |
8.8 |
8.1 |
7.6 |
2.0 |
1.8 |
1.6 |
1.4 |
||
Muscle, heart |
9.6 |
9.3 |
8.0 |
6.0 |
2.1 |
2.0 |
1.6 |
1.5 |
||
Liver |
|
10.0 |
8.7 |
8.6 |
7.6 |
4.6 |
2.8 |
2.8 |
1.7 |
|
Kidney |
|
|
|
|
|
|
1.9 |
1.8 |
1.4 |
1.3 |
Brain |
|
|
|
|
6.1 |
|
6.0 |
5.3 |
3.7 |
1.5 |
Fatty tissue |
|
|
|
23.2 |
|
|
|
|
|
|
Blood |
|
|
|
|
1.6 |
1.5 |
1.5 |
1.4 |
0.9 |
0.8 |
aNote that those values must not be assumed to represent exact figures since they do not consider important details like species, preparation of sample, time after excision, temperature, or the procedure and protocol for their measurement. The values are compiled from many different sources and, if necessary transformed to resistivity.
b-dispersion, the total volume (i.e., both extraand intracellular space) or changes of this total volume can be recorded. Using at least one frequency below and another one above the b-dispersion allows determining the ratio of extraand intracellular spaces, and hence also fluid shifts between these spaces.
Special applications of this approach are the monitoring of fluid exchange processes during hemodialysis (5) and orthostatic challenges (6), the control and management of fluid infusion therapy, the detection of lung edema, and the viability surveillance of organs after blood flow has been stopped during surgery or when the organs are preserved for transplantation (7,8). The viability surveillance is based on the fact that oxygen deficiency with the subsequent lack of energy-rich substrates causes a failure of the active transmembraneous ionic transport mechanisms and, as a consequence, leads to an intracellular edema (i.e., an increase of the intracellular volume). This approach has also been investigated for graft rejection monitoring.
The passive electrical properties are specific for each tissue. They are mainly depending on the content of water, the ratio of extraand intracellular space, the concentration of electrolytes, and the shape of the cells and their orientation in the electrical field (e.g., of the fibers of skeletal and cardiac muscle). Table 1 shows a compilation of typical values of resistivity of various body tissues. It must be taken into account, however, that these values do not represent exact figures. Exact figures need detailed information about species, preparation of the sample, time after excision, measurement temperature, the employed method, and the protocol for the measurement. Comprehensive data compilations with the supplement of those details are found in Refs. 9 and 10.
These tissue-specific properties can be used for special applications, such as the analysis of the tissue composition or for tissue characterization by Impedance Spectroscopy. Those methods are the subject of another article and will not be discussed here in detail. A very popular application is the determination of total body water (11) or of whole body composition, for example, the determination of the percentage of body fat in order to support adequate nutrition management or control of physical exercises. Such approaches aim for the estimation of the compartmental volume of a certain tissue (e.g., fat) that is mixed with
another tissue (e.g. fat-free tissue) in a common space (i.e., the body or an extremity).
FUNDAMENTALS OF BIOIMPEDANCE MEASUREMENT
The most important principle for bioimpedance measurements is the adequate modeling of the passive electrical behavior of the tissue by an equivalent electrical circuit. The validity of simple models is restricted to narrow frequency ranges (e.g., the b-dispersion) and/or to simple geometric shapes of the biological object (e.g., cylinders as a model for extremities). The most widely accepted models for the bioimpedance in the frequency range around the b- dispersion are the RC-networks shown in Fig. 1. These models represent the spatially distributed electrical properties by discrete components. Actually, they are only simplified 2D models. The network shown in Fig. 1a is mimicking the biological system and its histological structure. It represents both the extracellular and intracellular space by the resistors Re and Ri, respectively, and the cell membrane by the capacitor Cm. Since the current passes twice the membrane when flowing through the cell, the two capacitors Cm* in series with Ri can equivalently be expressed by one single capacitor Cm in series with Ri. This network is usually replaced by the one shown in Fig. 1b in which Rs is arranged in series with the parallel circuit of Rp and Cp. These components have no relation with real histological structures. The parameter Rs corresponds to the parallel circuitry of Re and Ri as can be demonstrated for high frequencies. The parameter Rs can be considered to be very small as compared with Rp. In many cases, RS may
Figure 1. RC-networks modeling tissue impedance. The model in
(a) mimicks morphological structures, whereas the model in (b) shows the electrically equivalent, but, more usual circuitry.

IMPEDANCE PLETHYSMOGRAPHY |
123 |
(a) |
Sine wave signal |
Measuring |
(b) |
Sine wave signal |
Measuring |
|
generator |
device |
generator |
device |
|||
|
|
|
|
|
Electrode |
FE |
FE |
|
|
SE |
|
Skin |
|
|
Tissue |
|
Current |
Current |
|
pathways |
pathways |
|
|
|
FE...Feeding electrode |
|
|
SE...Sensing electrode |
Figure 2. Bioimpedance measurement set-up. (a) Shows the two-electrode configuration, whereas the four-electrode configuration is depicted in (b).
even be neglected for cases of simplification, that is, the electrical model is simply a parallel circuit of a resistor and a capacitor (e.g., RpkCp).
When using contacting electrodes, different approaches are possible for the measurement of the bioimpedance. The most important feature is the number of employed electrodes, usually two or four electrodes. More than 4 electrodes, up to 128 electrodes, are primarily used for CT-based impedance imaging like EIT. The two-electrode configuration is called the bipolar mode, and the four-electrode configuration is the tetrapolar mode (Fig. 2). The bipolar mode can be compared with the usual method for impedance measurement by feeding a current into the measurement object and recording the voltage or vice versa. In the tetrapolar mode, two electrodes are the feeding electrodes (usually the outer electrodes) and the other two electrodes are the sensing electrodes (usually the inner ones). In the tetrapolar mode, more than two sensing electrodes can be employed, for example, if monitoring of serial segments at the extremities are to be achieved.
The interface between the electrode with the metallic plate on the one side and the electrolyte on the other side is the boundary where a current carried by electrons is transformed into a current carried by ions. The electrolyte may either be contained in the gel of the electrodes or be the electrolytic fluid in the tissue. The basic process of the charge transfer from electrons to ions is a chemical reaction (12). The simplest model of such an interface is again an impedance consisting of a parallel circuit with a resistor RF (the Faraday resistance) and a capacitor CH (the Helmholtz capacitance), i.e., RFkCH (Fig. 3b). Real electrodes show a polarization effect that is caused by a double layer of opposite charges at the interface, actually the Helmholtz capacitance (Fig. 3a). Therefore, the electrode model with RFkCH has to be supplemented with an additional voltage source EP. The steady-state condition is reached if the tendency of metallic ions to enter the electrolyte and leave behind free electrons is balanced by the electrostatic voltage originating from the double layer. After disturbances, for example, by charge transfer forced by an externally applied voltage, another equilibrium for the double-layer voltage is reached with a time constant depending on RF and CH. All these components may have poor stability with time, especially in the period immediately after attaching the electrode on the skin. For surface electrodes, it must also be taken into account that the impedance of the skin, especially the stratum corneum, which is the outmost
epidermal layer, can be much larger than the impedance of the deeper tissue (e.g., skeletal muscle), which is in a complex parallel-serial arrangement with the skin. Sweating underneath the electrode lowers the electrode-tissue transimpedance. For the measurement of the impedance of deeper tissues the adequate preparation of the skin by abrasion, stripping, or puncturing at the site of the electrodes might be necessary in order to diminish the transimpedance. This transimpedance depends on the size of the electrode (i.e., the contacting area) and the measurement frequency, and . . . additionally on the pressure with which the electrode is attached to the skin. For electrodes, a typical value for the transimpedance is 100–200 V cm2.
In the bipolar mode, the two electrode–electrolyte interfaces are in series with the actual bioimpedance of the measured object. Therefore, the recorded impedance is always the sum of at least three impedances. The impedance of the biological sample cannot be calculated as an individual quantity from the recorded impedance value. This is the most serious shortcoming of the bipolar mode.
In the tetrapolar mode, the electrode–electrolyte interface usually can be neglected if the measurement is performed with a device with high input impedance (i.e., with very low current passing across the electrode–tissue inter-
|
+ |
|
Me |
e− |
+ |
e− |
Me |
|
|
e− |
+ |
|
Me |
e− |
+ |
|
Me |
(a) Metal electrode |
Electrolyte |
|
RF |
(b) |
CH |
|
Figure 3. Metal electrode: electrolyte interface. (a) Illustrates the steady-state condition at the boundary. Following the tendency of metallic ions (Meþ) to enter the electrolyte and to leave behind free electrons, the steady state is reached when this tendency is balanced by the electrostatic voltage originating from the double layer. (b) Shows the simplified model with only the passive electrical components, that is, the Faraday resistance RF and the Helmholtz capacitance CH.
124 IMPEDANCE PLETHYSMOGRAPHY
face). A drawback of the tetrapolar mode, however, is that the measured impedance value cannot be exactly assigned with a certain volume of the tissue between the sensing electrodes, even if the sensing electrodes are positioned on a straight line connecting the two feeding electrodes. Band electrodes that are attached at the whole circumference (e.g., at the extremities), yield more valid results. If circular electrodes are applied and both the feeding and the sensing electrodes are placed on the circumference of a cross-section (e.g., around the thorax or the head), it is nearly impossible to assign the actually measured impedance value with a certain volume within that cross-section due to the complex current field. In those cases, the monitored volume consists of a serial-parallel circuitry of different tissue layers with different electrical properties (e.g., skin, subcutaneous soft tissue, bone, deeper tissues). For this reason, the result of ventilation measurements with electrodes, either disk or band electrodes, placed on the thorax may be affected by the higher conductivity of extra-thoracic muscles as compared with the very low conductivity of the rib cage, which prevents the entrance of current into the pulmonary tissue that is actually the object of interest. Sweating may additionally cause another low impedance parallel circuit along the skin and, thus, yield considerable measurement errors. The situation is similar for the measurement of brain parameters, for example, brain–blood flow or brain edema, with electrodes placed on the scalp. Since the conductivity of the extracranial soft tissue (e.g., skin, muscle) is much higher than the conductivity of the bony skull, only few current pathways will pass through the brain.
The different instrumental approaches for measuring the bioimpedance in the frequency range of the b-disper- sion are the impedance bridge (e.g., an extension of the classical Wheatstone bridge); the self-balanced active bridge; the resonance method that is mainly a compensation method; the pulse method that is a time domain procedure and not widely used; the voltage-current method, based either on feeding a constant voltage (i.e., from a generator with low source impedance) and monitoring the resulting current or on feeding a constant current (i.e., from a generator with a sufficiently high source impedance, 100 kV since the load impedance may be up to 1 kV) and monitoring the resulting voltage. If employing the bipolar mode, it would be more correct in this case to use the term transimpedance than impedance for the actually measured quantity between the electrodes.
For the tetrapolar configuration only the voltage-cur- rent method is applicable. Phase angle measurements employ an ohmic resistor in series with the measuring object as reference. Absolute phase angle measurements are questionable even for the bipolar configuration since the measured phase angle always includes the phase shifts that are caused by the two electrode–skin contacts and depend on the actual values of the Faraday resistance and the Helmholtz capacitance. If the Faraday resistance is small and the Helmholtz capacitance is fairly large, the phase shift by the electrode–skin interface may become negligible. This is one of the advantages of electrodes with artificially increased surfaces, for example, electrodes with porous or fractally coated surfaces that might be obtained
by sputtering or chemical processes, as compared with polished surfaces.
Usually, the measurement is performed with a con- stant-voltage generator for technical reasons. The applied feeding signal, whether voltage or current, should be sinusoidal with a very low distortion factor (i.e., with a low content of harmonics) and with high stability both in amplitude and frequency. Any modulation of the feeding signal may provoke an additional response for this undesired modulation frequency that has to be avoided with regard to the frequency dependence of the impedance specific variables. The voltage amplitude is in the range of some volts, the current amplitude is in the range of some microamps to milliamps (mA to mA). The changes in the impedance caused by volume changes can be very small, <0.001%. This means that very small changes in the measured current or voltage have to be processed. Hence, the sensitivity and stability of the input amplifier must be very high in order to detect such small changes in the measured signal.
Independent from the measurement method, careful consideration of measurement errors is necessary. A main source of measurement errors may be parasitic components, such as stray capacitances between neighboring wires leading to the sensing electrodes, or between wires and their shielding, or stray capacitances between metallic components of the measuring system and ground, which become the more effective the higher the measuring frequency.
The risk for undesired stimulation of the heart or peripheral nerves if such electrical voltages or currents are applied for monitoring purposes, is negligible, both with regard to the high frequency and the low current density. Furthermore, heating and heat-induced secondary effects can be neglected.
However, proper attention must be paid for the selection of the equipment and its performance data for the intended application. Furthermore, the employed devices must be safe even in case of technical failure. Patient-near devices are directly connected with the patient whereby the connecting impedance is rather low.
CHARACTERISTICS OF BIOIMPEDANCE
The microscopic electrical properties that describe the interaction of an electromagnetic wave with biological
tissue are the complex conductivity s with the unit V 1 m 1, mho m 1, S m 1, or 1 (V m) 1
s ðvÞ ¼ s0ðvÞ þ js00ðvÞ
and the complex dielectric permittivity e with the unit F/m
e ðvÞ ¼ e0ðvÞ je00ðvÞ
v is radian frequency with the unit hertz. The electrical properties are depending on the frequency with strong dependence in the range of a dispersion.
The relation between these two quantities can be described in accordance with Ref. 13 by
s ðvÞ ¼ jv e ðvÞ
With the conduction current that is related with the basic conductivity s0, that is, the current carried by the mobility of ions in the extracellular space, and the polarization current (sometimes called displacement current) that is related with permittivity, the following equations are obtained
s0 ¼ s0 þ v e00ðvÞ
s00 ¼ v e0ðvÞ ¼ e0 erðvÞ
where e0 is the dielectric permittivity of free space with e0 ¼ 8.85 10 12 F m 1, and er is the relative dielectric permittivity (with er ¼ 1 for the free space and er ¼ 81 for water in the low and medium frequency range).
Instead of the complex conductivity s , the inverse complex resistivity r with the unit V m can be used. The resistivity is usually preferred in the context of impedance plethysmography:
r ðvÞ ¼ r0ðvÞ þ j r00ðvÞ
The complexity of these quantities considers the fact that in the alternating current (ac) range the biological tissue cannot adequately be described by a simple resistance (or its inverse conductance), but needs the extension to a complex quantity, that is, impedance or admittance. Some authors prefer the term Admittance Plethysmography instead of Impedance Plethysmography (14,15). The simplest adequate model for such an impedance is represented by a resistance and a reactance. The resistance causes the loss in power, whereas the reactance causes the delay (or 18 phase shift) between voltage and current. The dominating reactance of bioimpedance in the frequency range of interest is capacitive and becomes more relevant for higher frequencies. Only for very high frequencies that usually are not employed for impedance plethysmography, can the reactance be composed by both a capacitive and an inductive component.
Bioimpedance can be described like any technical impedance in different forms, for example, by its magnitude (or modulus) Z0 and its phase angle (or argument) w, (i.e., the delay between voltage and current):
Z ¼ Z0 e jw
or by its real part (or resistance) Re{Z} and its imaginary part (or reactance) Im{Z}:
Z ¼ RefZg þ j ImfZg
Alternating current voltages and ac currents, too, can be expressed as complex quantities, that is, by their magnitude and phase angle, or by their real and imaginary part although this is rather unusual. The magnitude of the impedance Z0 corresponds to the quotient of the magnitudes of voltage V0 and current I0, that is,
Z0 ¼ V0=I0
Appropriate modeling of the electrical properties of biological tissue by discrete and lumped electrical components renders possible the proper consideration of multilayer or compartmentally composed tissues with different electrical properties of each layer or compartment. Such tissues can
IMPEDANCE PLETHYSMOGRAPHY |
125 |
be modeled as serial, parallel, or serial–parallel equivalent circuits in 2D presentation. More recently, the modeling has been extended to 3D models using the FEM or comparable approaches.
The impedance parameters can be depicted in different modes as a function of frequency (Fig. 4). The presentation of the magnitude (usually in logarithmic scale with regard to its wide range) and the phase angle against the frequency over several decades, and therefore in logarithmic scale is known as the Bode plot. A similar presentation is used for both the real and imaginary part versus the frequency on the x axis. This mode of presentation is sometimes called the spectrum (e.g., modulus spectrum and phase angle spectrum). A different form of presentation is in a plane with the real part along the x axis and the imaginary part along the y axis, both in linear scaling, with the frequency as parameter. This mode of presentation is frequently called the Cole–Cole-plot (but also the Nyquist plot, locus plot, or Wessel graph). The same modes of
Magnitude |
104 |
|
103 |
||
|
||
|
102 |
(a) |
|
|
10−1 |
10−0 |
101 |
102 |
103 |
104 |
105 |
106 |
|
|
(degrees) |
|
|
|
f [Hz] in logarithmic scaling |
|
|
||||
|
|
0 |
|
|
|
|
|
|
|
|
|
|
|
|
|
|
|
|
|
|
|
|
|
|
|
|
−20 |
|
|
|
|
|
|
|
|
|
|
Phase |
−40 |
|
|
|
|
|
|
|
|
|
|
10−1 |
10−0 |
101 |
102 |
103 |
104 |
105 |
106 |
||
|
|
|
−60 |
|
|
|
|
|
|
|
|
|
Re{Z} |
|
|
|
|
f [Hz] in logarithmic scaling |
|
|
|||
|
|
4000 |
|
|
|
|
|
|
|
|
|
|
|
|
6000 |
|
|
|
|
|
|
|
|
|
Part |
|
2000 |
|
|
|
|
|
|
|
|
|
Real |
|
0 |
10−0 |
101 |
102 |
103 |
104 |
105 |
106 |
|
(b) |
|
|
10−1 |
||||||||
|
|
|
|
|
f [Hz] in logarithmic scaling |
|
|
||||
|
{Z} |
|
|
|
|
|
|
||||
|
|
0 |
|
|
|
|
|
|
|
|
|
|
Im |
|
|
|
|
|
|
|
|
|
|
|
|
|
|
|
|
|
|
|
|
|
|
|
Part |
−1000 |
|
|
|
|
|
|
|
|
|
|
|
|
|
|
|
|
|
|
|
||
|
Imaginary |
−2000 |
|
|
|
|
|
|
|
|
|
|
−3000 |
|
|
|
|
|
|
|
|
||
|
|
|
10−1 |
10−0 |
101 |
102 |
103 |
104 |
105 |
106 |
|
|
|
|
|
} = e ″ |
|
f [Hz] in logarithmic scaling |
|
|
|||
|
|
|
|
−3000 |
|
|
|
|
|
||
|
|
|
|
|
|
|
|
|
|
||
(c) |
|
|
|
Im {e |
−2000 |
|
ω |
|
|
|
|
|
|
|
Part |
|
|
|
|
|
|
||
|
|
|
|
−1000 |
|
|
|
|
|||
|
|
|
|
|
|
|
|
|
|||
|
|
|
|
Imaginary |
|
0 |
ω = ∞ |
ω = 0 |
|
|
|
|
|
|
|
|
|
|
|
|
|||
|
|
|
|
|
|
0 |
2000 |
4000 |
|
|
|
Real Part Re {e } = e ′
Figure 4. Different modes for the presentation of impedance quantities. (a) Shows the magnitude (in logarithmic scaling) and the phase angle of impedance as functions of frequency in logarithmic scaleing (Bode plot). (b) Shows the real and imaginary part of impedance depicted versus the frequency in logarithmic scaling. (c) Presents the Cole–Cole plot with the real part at the x axis, the imaginary part at the y axis, and the frequency as parameter along the curve. The results shown are not from biological tissue, but calculated for the circuit of Fig. 1b with Rs ¼ 500 V, Rp ¼ 5 kV, and Cp ¼ 500 nF.
126 IMPEDANCE PLETHYSMOGRAPHY
presentation are possible for the complex quantities s , r , and e .
Usually, impedance plethysmography is accomplished employing only a single measuring frequency or a few discrete measuring frequencies. However, impedance spectroscopy with a multitude of measuring frequencies is gaining interest, especially for the determination of spatially distributed volumes. Typical examples are the determination of body composition, tissue, or organ vitality monitoring in combination with cellular edema as a result of hypoxemia, and monitoring of infusion therapy.
Certain forms of electrotherapy are also utilizing the passive electrical properties of biological tissue. Methodology and technology for these forms of electrotherapy, however, are not discussed here.
MODEL-BASED RELATIONS FOR VOLUME
DETERMINATION
Valid relations between the monitored electrical quantities and the searched volumetric parameters have to be used to calculate a quantitative result that can be expressed in units of volume (e.g., mL or cm3). Most of these relations are based on models. Possibly the first model for the interpretation of bioimpedance measurements has already been developed for a suspension of cells in a fluid by Fricke and Morse in 1925 (16).
The simplest model-based approach for establishing an impedance–volume relationship is a cylindrical volume conductor of radius r0, length L, and resistivity r*. It is assumed that this volume conductor is surrounded by soft material with significantly higher resistivity re* r*, so that it must not be considered as a parallel circuit and its actual radial extension has no impact. This volume conductor may be a blood vessel (e.g., an artery or vein) surrounded by tissue that has higher resistivity than blood. Furthermore, it is assumed that the inflow of the volume DV into that cylinder expands the radius homogeneously by Dr over the total length. It is also assumed that neither the length L nor the resistivity r are affected by the volume injected into the volume conductor. For didactic simplicity, only the real part r0 of the complex resistivity r is considered; that is, only the real part of the impedance is taken into account. However, despite this simplification, the variable is understood as impedance Z. This simplification is generally valid for frequencies much lower than the b-dispersion, since for these frequencies the phase angle is small (< 108). For higher frequencies, the calculation must be performed with proper consideration of the complex quantities.
With these assumptions the following relations for Z and V are valid:
Z0 ¼ r0L=½pr02&
V0 ¼ Lpr02
From these two equations the following equation can easily be calculated
Z0 ¼ r0L2=V0
After the inflow of the volume DV and the increase of the radius by Dr, the following relations are valid:
Z1 ¼ Z0 DZ ¼ r0L=½pðr0 þ DrÞ2&
V1 ¼ V0 þ DV ¼ Lpðr0 þ DrÞ2
with Z1 < Z0 and V1 > V0 for Dr > 0.
With some simple mathematical operations it can be shown that
r0L2Z ¼ ðr0L2 þ DV ZÞ ðZ DZÞ
If the product DV DZ Z is neglected as a product of small quantities, the result becomes:
DV ¼ r0ðL=ZÞ2 DZ
This is the well-known Nyboer equation that relates the volume change DV with the change in impedance DZ as a consequence of the blood inflow into a peripheral artery, for example, into the aorta or carotid artery with each heart beat.
For proper application all included simplifications must carefully be taken into account. Only mathematical simplifications, but no methodological constraints have been mentioned here. Such a constraint may be that a part of the injected volume is already flowing out of the measured vessel segment before the inflow of the whole volume DV into this vessel segment has been completed. This constraint must especially be considered if the segment is short and the vessel wall rather stiff.
With regard to the surrounding tissue, a more realistic model would be an arrangement of two concentric cylinders of length L with different conductivities. The inner cylinder with radius r1 and resistivity r1’ has the impedance Z1 ¼ r01L=½p r21&, whereas the outer cylinder with
radius |
ð |
r2 |
and |
2resistivity r2’ has the impedance Z2 ¼ |
|||||
2 |
½ |
|
2 |
|
r |
1Þ |
& |
. Electrically both cylinders are arranged |
|
r0 |
L= p r |
|
|
|
|
||||
in parallel configuration. Hence, the total impedance is obtained by Z0 ¼ Z1Z2=ðZ1 þ Z2Þ. The inner cylinder shall be a vessel into which blood of volume DV is pumped, causing a homogenous dilation of the vessel radius by Dr1
|
|
|
|
|
|
2 |
|
|
|
|
|
|
|
1 |
¼ |
|
|
|
¼ |
and |
a |
lowering |
of |
its impedance |
to Z |
|
Z1 |
|
DZ1 |
|
|||||||||
1 |
½ |
ð |
1 þ |
|
1Þ & |
|
|
|
|
|
|
|
|
|
|
|
|
||
r0 L= p r |
|
Dr |
0 |
|
. Since Z2 shall not be affected, the total |
||||||||||||||
|
|
|
|
|
¼ |
1 2 |
ð |
1 þ |
Z |
2 |
Þ |
. The following steps |
|||||||
impedance is Z |
|
|
Z Z |
= |
Z |
|
|
||||||||||||
are similar to those leading to the Nyboer equation. Since the resulting equation and its application to measurements are more complicated, they will not be discussed here in detail. Even this model is actually simplified, because in reality the tissue around the vessel will neither be a cylinder nor have a homogeneous resistivity. This last situation may become relevant with a vein or a bone in the vicinity of the artery.
With regard to the constraints of the Nyboer equation, another approach has been used that finally leads to the Kubicek equation (17). The model-based approach starts again with the single-vessel model of length L. However, in contrast to the Nyboer approach the assumption is not made that the inflow of the volume DV into the considered vessel segment is finished before the outflow starts. Here, the basic assumption is that the inflow is constant during
the inflow time Tinf and that the outflow starts with some delay, however, temporal overlap of outflow with inflow
must not be excluded. With this assumption, the change in the intravascular volume and, hence, in the impedance, is maximal when there is only inflow into and no outflow from the segment. This maximal change of the impedance can be expressed by its first time derivative [i.e., by (dZ/dt)max]. The total inflowing volume DV can then be taken into account by multiplying (dZ/dt)max with the inflow time Tinf. With regard to the aorta this inflow time is equivalent with the ejection time of the left ventricle. In many cases even the inflow time can additionally be obtained from the impedance curve. This leads finally to the Kubicek equation:
DV ¼ r0ðL=ZÞ2Tinf ðdZ=dtÞmax
Obviously, the only relevant difference in both approaches is the Nyboer assumption that the total volume change DV has already been injected into the measured vessel segment before the outflow starts against the Kubicek assumption that this volume DV is entering the measured vessel segment with constant rate during the whole inflow period. The Kubicek equation is more realistic for a short vessel segment with a rather stiff wall. For such vessels, the Nyboer equation leads to an underestimation of the real volume change. In contrast, if the inflow is decreasing at the end of the inflow period, for example, at the end of the ventricular ejection period, the Kubicek equation yields an overestimation of the volume change.
All other model-based assumptions are identical or comparable. Both approaches consider only a single vessel with homogeneous dilation over the total length within the measured tissue and neglect the surrounding tissue and its composition with regard to nonhomogeneous resistivity. Blood resistivity is taken as constant although there is some evidence that it depends on the flow velocity.
Although the Kubicek equation has primarily been proposed for the monitoring of cardiac output, both equations have also been applied to the monitoring of pulsatile peripheral blood flow. Both models, however, do not consider that in the peripheral circulation a basic or nonpulsatile blood flow may exist as well.
Different modifications have been suggested in order to overcome relevant drawbacks. Most of these modifications are optimized with regard to the monitored quantity, geometric constraints, modes of application, or positioning and shape of electrodes. They will not be discussed here.
No valid impedance–volume models have been proposed for the quantitative monitoring of ventilation by the application of impedance plethysmography. Statistical models are used for the impedance–volume relationship regarding body composition. Some first approaches have been suggested for the volume changes due to fluid shifts.
INSTRUMENTATION AND APPLICATIONS
The typical basic equipment for impedance plethysmography consists of the signal generator, either a constant voltage generator or a constant current generator; the frequency-selective measuring device, either for current or voltage, in combination with AD conversion. The equipment may be supplied with more than one signal channel
IMPEDANCE PLETHYSMOGRAPHY |
127 |
for certain applications, for example, with two channels for simultaneous and symmetric monitoring at both extremities or one channel for each frequency in multifrequency measurements; the signal processor, for example, for processing the impedance quantities; the processing unit for calculating the volumetric quantities; the monitor and/or data recorder; multiple electrodes and shielded leads; specific auxiliary equipment, for example, venous occlusion machine with cuff and pump.
Devices for impedance plethysmography are small, light, usually portable, and battery powered. The devices for patient-near application are much cheaper than competitive equipment based on nuclear magnetic resonance (NMR), X ray, or US. Also, the running costs are much lower than for the competitive technologies, usually these costs are mainly required by the single-use electrodes.
Peripheral Hemodynamics
The objective is the detection of deficiencies either in the arterial or venous peripheral circulation. The application of impedance plethysmography to peripheral vascular studies has already been in the interest of Nyboer in 1950 (18).
In the peripheral circulation, the most interesting quantity is arterial blood flow or perfusion. Impedance measurement is performed either in the bipolar or, more frequently, in the tetrapolar configuration. The tetrapolar configuration requires a longer segment for measurement in order to place the sensing electrodes in proper distance from the feeding electrodes with the nonhomogenous current field in their vicinity. Electrodes are either of the circular or disk or the band type. Disk electrodes can be placed directly above the monitored vessel and therefore provide high sensitivity, but the magnitude and the reproducibility of the measured signal in repeated measurements are strongly dependent on exact electrode placement (19–21). Band electrodes are preferred for the measurements at extremities because they can be placed around the extremities. In this case, the measured object is the whole segment between the sensing electrodes including the extravascular tissue and may include more than only one vessel. Flow can be estimated by application of the Nyboer, the Kubicek or any modified impedance–volume equation. Competitive methods are utilizing ultrasound Doppler, contrast X-ray angiography, or NMR.
Some diagnostic information about the stiffness of the arterial vessel wall can be obtained by the impedance method from the measurement of the pulse wave propagation velocity, usually executed at two different sites of the same arterial pathway. The pulse that is actually recorded with the impedance method is the intravascular volume pulse, that is, the dilation of the vessel with each heart beat (22). Simple formalistic models are used to relate the pulse wave propagation velocity with the stiffness of the vessel wall. If the intravascular blood pressure is also monitored, then it is possible to calculate the stiffness or its inverse, the compliance as ratio of the volume change and pressure change DV/Dp, directly.
Another problem is the diagnosis of proximal or deep venous thrombosis and of other obstacles for the venous return flow to the heart from the extremities (23). One
128 IMPEDANCE PLETHYSMOGRAPHY
approach is actually a modification of the venous occlusion plethysmography that has already been introduced in 1905 by Brodie and Russel (24). A cuff is placed around the extremity and connected with a pump. The cuff pressure is enhanced abruptly so that it occludes the vein and stops venous outflow without affecting the arterial inflow. The volume increase following venous occlusion allows estimating the arterial inflow. When the occlusion is stopped after20 s, the venous outflow starts again and thereby leads to a reduction in volume. The slope or the time constant of this postocclusion emptying process are used to assess the outflow resistance, for example, the hydrodynamically obstructive impact of deep venous thrombosis, or the venous wall tension. However, other pathological effects must be carefully considered, for example, increased central venous pressure. For this reason, the recording is frequently and simultaneously performed on both extremities, so that the results can be compared with each other. The measurement is usually executed with band electrodes. Competitive methods are ultrasound Doppler, contrast X-ray venography, or NMR.
A similar impedance-based approach is employed to test the performance of the drainage system in extremities. Changes in the hydrostatic pressure are used to shift volume between the trunk and an extremity, for example first by bringing down an arm before raising it above the head. The affected volume shifts can be recorded and render possible the assessment of the performance of the draining system. This approach is frequently used to study fluid shifts caused by tilting experiments, during microgravity experiments, or after long periods of bedrest.
Brain Perfusion and Edema
The most important objectives are monitoring of cerebral bloodflow and the detection of cerebral edema. First publications about rheoencephalography are dating back to 1965 (25,26).
The volume of the brain with its enclosed fluid spaces, for example, the intravascular volume and the cerebrospinal fluid volume, is kept constant by its encapsulation in the bony skull. The expansion of the volume of one compartment, for example, increase of the intravascular volume by augmented arterial blood pressure, the spacedemanding growth of a brain tumor or intracerebral bleeding, can only be compensated by the diminution of the volume of other compartments. If the space-demanding process is of nonvascular origin, the most affected compartment will be the intravascular volume. Due to the compression of blood vessels, the cerebral bloodflow and thus metabolism will be reduced.
Impedance measurements aiming for the brain as organ are difficult because the encapsulating bony skull has a very high resistivity as compared with the soft extracranial tissue of the face and the scalp. If the tetrapolar mode is used, more than two sensing electrodes may be applied. Different electrode arrangements have been described to force the current pathways through the skull into the brain, but also the application of the feeding electrodes to the closed eyelids. However, the measurement of the transcephalic impedance has not become a routinely
applied clinical method with the exception of neonates in which the thickness of the bony skull is very small. Competitive methods based on NMR, X ray, US, and even photoplethysmography have gained more attention in the recent past. Some expectations are related to the development of contactless applications, especially for the continuous monitoring of edema (27). This might allow control treatment by hyperosmolaric infusion therapy.
Ventilation and Lung Performance
Impedance pneumography were among the first applications of impedance plethysmography and had already been described by Geddes et al. in 1962 (28,29).
The objective of impedance pneumography is to record the tidal volume under resting conditions or during exercise. Additionally, the breathing rate can be obtained by the impedance method. The principle is based on the measurement of the transthoracic impedance that increases during inspiration as a consequence of increasing alveolar air filling, and decreases during expiration (30). The conductivity of lung tissue at the end of a normal expiration is 0.10 V 1 m 1 as compared with 0.05 V 1 m 1 at the end of normal inspiration. The application of impedance pneumography is very simple and also applicable for critically ill patients, since it allows continuous recording without requiring a breathing tube. However, the quantitative determination of the tidal volume is difficult and needs calibration by another spirometric method. No realistic model-based interpretation of quantitative assessment is available until now. Some expectations are related with multifrequency measurement (31).
The impedance measurement can be performed with the bior tetrapolar configuration. It is usually performed separately for each side of the lung in order to detect differences. Even with more electrodes, however, the spatial resolution is too poor to allow detection of regional inhomogeneities of alveolar air filling. For that reason, this field is gaining growing interest for the application of EIT
(4). Also, EIT has limited spatial resolution, as compared with other CT-based imaging procedures. Despite this drawback, it has some potential for the detection of regional inhomogeneities in ventilation. Such an approach would be of high relevance for diagnostic purposes and for the efficiency control of artificial ventilation. Serious drawbacks for EIT, however, are the costs of the equipment and the necessity to attach up to 64 or 128 electrodes around the thorax.
Since pulmonary edema is usually a general and not a localized phenomenon, its monitoring might be possible by utilizing the transthoracic impedance measurement. Measurement of extravascular lung water is investigated as a methodological approach to guide the fluid management of patients with noncardiogenic pulmonary edema (32). The conductivity of lung edema fluid is 1 V 1 m 1, and therefore is distinctly different from alveolar tissue filled with more or less air.
The impedance coefficients of tumor tissue are different from normal lung tissue. Hence, cancer detection might be possible by bioimpedance measurement. But with regard to its poor spatial resolution, the bior tetrapolar transthor-
acic impedance measurement is not qualified, but EIT might become useful for some special applications. Other imaging procedures were superior until now, primarily due to the higher spatial resolution as compared with EIT.
Much work has been devoted to comparing impedance pneumography with inductive pneumography. There is some evidence that inductive pneumography is superior concerning ventilation monitoring in newborn infants, especially for risk surveillance with regard to SIDS. An interesting approach tries to utilize inductive pneumography in combination with the evaluation of the signal morphology for the monitoring of airway obstruction (33).
Intercompartmental Fluid Shifts
Intercompartmental fluid shifts occur during dialysis, for example, hemodialysis, but also during infusion therapy and emergence of edema. The assessment of fluid shifts, which are actually changes of volumes, by the measurement of electric variables has been an outstanding objective very early in the scientific research and medical utilization of bioimpedance and dates back to 1951 (34).
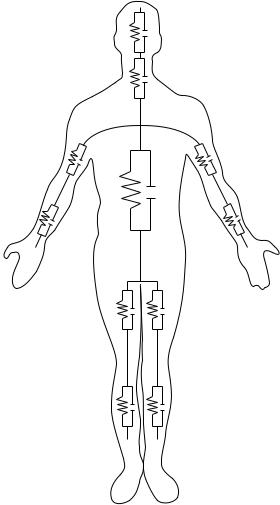
Hemodialysis is a therapeutic procedure that is employed in patients with renal insufficiency. The therapeutic objective is to remove water, electrolytes, urea, and other water-soluble substances in combination with the reestablishment of a normal acid–base status. In a simplified model, the water is first removed from the intravascular volume, (i.e., the blood plasma). This means that the hematocrit, and thereby the viscosity of blood, is increased cousing the work load for the heart is enhanced. Also, the osmotic pressure of the blood is raised, whereas the hydrostatic blood pressure is lowered. Both effects contribute to the refilling of the intravascular space by a fluid shift from the interstitial space (i.e., the extravascular extracellular space). This fluid shift finally causes another fluid shift from the intracellular space into the interstitial space. The dynamics of these fluid shifts is primarily controlled by the hydrostatic and osmotic pressure differences between the different spaces, but also by the substance-specific permeability of the different barriers between the spaces including the dialysis membrane. If removal of water is too fast or changes of ions like sodium, potassium, and calcium are too large, the hemodynamics of the patient or the excitability of tissues like the heart or central nervous system may become disturbed. Impedance plethysmographic methods have some potential for the control of those fluid shifts, that is, may help to avoid critical disequilibrium syndromes like hypotension, headache, and vomiting. The best results of the plethysmographic measurement are achieved if segmental measurement is performed at the extremities instead of whole body measurements (5). Figure 5 shows a schematic presentation of such segmented body. The forearm accounts only for 1% of body weight, but contributes 25% to whole body impedance.
Infusion therapy aims mainly to filling the intravascular volume by utilizing venous access. However, depending on the control variables (e.g., hydrostatic pressure, osmotic pressure, and permeability of the barriers), intercompartmental fluid shift cannot be avoided. Consequently, part of the infused volume will not remain in the intravascular
IMPEDANCE PLETHYSMOGRAPHY |
129 |
Head
Neck
Torso
Upper arm
Lower arm
Upper leg (thigh)
Lower leg (calf)
Figure 5. Schematic presentation of the whole body subdivided into 11 segments that are modeled by RC-networks.
system and help to stabilize blood pressure, but escape to the extravascular space.
A special objective of intravenous infusion therapy with hyperosmolaric fluid is the removal of fluid from the extravascular space in order to avoid the emergence of edemas. In the brain, such infusion may help to lower the intracranial pressure that is caused by edema.
Body Composition
Most frequently this method is called bioelectric impedance analysis (BIA). The interest in this methodological approach has increased with the increased interest in healthy life style in industrialized populations since the first reports at the end of the 1980s (35,36).
The body consists of different tissues, for example, muscle, fat, bones, skin, the nervous system, and connective tissue. All these tissues contain intraand extravascular spaces. The extravascular space can be subdivided into the extracellular or interstitial space and the intracellular space. Chemically, the body consists of water, proteins, carbohydrates, lipids, ions, rare elements, and some other substances. The main objective of body composition analysis
130 IMPEDANCE PLETHYSMOGRAPHY
is the assessment of total body water, of lean or fat free tissue mass, and of fat tissue. Those measurements have clinical relevance, but they are also gaining growing attention in the field of sports, physical fitness, wellness, nutrition, and for life science in aerospace research.
The methodological approaches are different, for example bipolar or tetrapolar mode, single-or multiplefrequency measurement, whole body or segmental measurement. In single-frequency measurements, a sinussoidal current with usually < 1 mA (range 0.02–10 mA) and a frequency with typically 50 kHz (range 20–100 kHz) is employed. The basic assumption is that resistivity of fat tissue is higher than that of the so-called lean tissue that has a higher content of water. In the nonclinical field, the determination of body composition is frequently combined with the measurement of body weight using a scale with two integrated electrodes in the foot platform. In that case, however, only the two legs and the lower part of the trunk will be included into the estimation. In more advanced devices, additional electrodes are available in the form of hand grips. Detailed segmental measurements are more valid since the trunk of the body may contribute 70% to the total body weight and up to 90% to the total body fat, but only 5% to the measured whole body impedance. More sophisticated equipment utilize multifrequency measurement (11).
The applied statistically based predictive equations are of the linear regression type and consider individual parameters like sex, age, height, and weight. They are primarily used to assess the lean muscle mass, the body fat, the fat free mass, the water content, and the body mass index. For physically based segmental calculations, the extremities, the body trunk, and even the head are modeled by cyclindric shape with uniform cross-section over the total length.
Competitive methods include antropometric measures like the girth, simple skin-fold measurements by mechanical calipers, but also highly advanced methods, such as NMR, X ray (dual energy X-ray absorptiometry, or nuclear imaging), and for certain purposes even the hydrostatic weighing in a water tank that is assumed to be the most accurate method.
Laboratory Applications
Blood Cell Counting. The employed methodological principle is frequently called the Coulter principle (37). Blood cells (e.g., erythrocytes, leucocytes) are passing through a capillary (diameter < 100 mm) filled with blood plasma. For frequencies below the b-dispersion the impedance of the cell is higher than that of the surrounding plasma. Consequently, the passage of each cell affects the recorded impedance. Those impedance changes are used for cell counting. In sophisticated devices the impedance changes are quantitatively measured and allow cell volume estimation, which also renders possible the determination of the cell volume distribution function (frequently called the Price – Jones distribution function with the cell diameter as variable). Since the number of leucocytes is very small compared with that of the erythrocytes (usually < 0.1%), leucocytes do not really disturb the counting of erythrocytes. In contrast, however, the erythrocytes must
be destroyed before the leucocytes can be counted. This is usually achieved by chemical hemolysis of the erythrocytes. Furthermore, chemical substances are utilized to render possible the differentiation between the different populations of leucocytes (e.g., granulocytes, monocytes, lymphocytes).
Hematocrit. The objective is the estimation of the intracellular volume of blood. The hematocrit is defined as the ratio of the volume of blood cells to total blood volume, although frequently the hematocrit is taken as a measure for the ratio of only the volume of erythrocytes to total blood volume. However, since the partial volume of all other blood cells (i.e., leucocytes, platelets) is very small compared with that of the erythrocytes, the results are not distinctly different. Determination of the ratio between the extracellular volume and the total blood volume is possible by application of at least one measuring frequency below and another one above the b-disperion. Problems that need further consideration as possible sources of error are the electrolytic conductivity of blood plasma, which is dependent on the actual concentration of ions, and the sedimentation of the cells as a consequence of their higher specific weight that may take place during the measuring period. The measurement requires the withdrawal of a sample of blood from a vein or another blood vessel. Measurement of the hematocrit can be achieved either with the impedance or the dielectric technique (38).
Several modifications of the impedance method for the noninvasive determination of the hematocrit have been proposed. In one approach, impedance measurement is performed at the finger by application of two different frequencies (i.e., 100 kHz and 10 MHz). The hematocrit is determined by an algorithm that uses both the pulsatile and the baseline component of both measuring frequencies (39). In another remarkable methodological approach, the patient puts a finger in a temperature-stabilized bath. A fluid with gradually increasing ionic concentration is pumped through the bath chamber, thus leading to a decrease in the impedance of the bath fluid. The pulsatile volume changes of the finger are recorded by impedance measurement in the bath chamber. These pulsatile impedance fluctuations disappear only if the impedance of the bath fluid is identical with that of the blood in the finger. The conclusion is made from the actual impedance of the bath fluid on the hematocrit (40).
Others
Cell Imaging. Nanotechnology-based on bioimpedance sensing, chip devices have been described that allows us to rapidly detect and image cells with a specific phenotype in a heterogeneous population of cells (41). This might be useful for screening purposes, recognition of cell irregularities, and detection of risk patients like human immunodeficiency virus (HIV)-infected individuals. Cell identification is made possible by administration of marker substances. A promising measurement procedure is electrochemical cyclic voltammetry. When a sinusoidal voltage with constant amplitude and a variable frequency in the range of some kilohertz is applied, the impedance is plotted
in the spectrographic mode. Among other effects, volume changes might be the dominating measured effect if the marker binds with a receptor in the cell membrane, and herewith affects membrane properties like its permeability for water or ions or the transmembraneous active ion transport mechanisms.
Inductive Plethysmography. Inductive plethysmography is employed for respiratory monitoring, so-called respiratory inductance plethysmography (RIP). It is based on the measurement of the thoracic crosssection that is enclosed by coils and includes both the rib cage and abdominal compartments (42–45). In the medium frequency range (30–500 kHz), changes in the volume are monitored by the influenced inductance. In the higher frequency range ( 100 MHz), the inductively provoked signals (i.e., eddy currents depending on the alveolar air filling) are recorded by appropriately arranged coils.
Magnetic Susceptibility Plethysmography. Magnetic susceptibility plethysmography is a contactless method. It is based on the application of a strong magnetic field and monitors the variation of the magnetic flux. The measurement is accomplished with superconduting quantum interference device (SQUID) magnetometers. This approach may primarily be utilized for the assessment of blood volume changes in the thorax, but until now it is not employed for clinical routine (46).
SUMMARY
In comparison with biomedical engineering as a recognized discipline, the research activities in the field of bioimpedance are much older. It can be assumed that Nikola Tesla, a former student of physics in Graz (Austria) and the inventor of the ac technology, already knew about the passive electrical properties of biological tissues when he demonstrated his famous and public performances with the administration of high voltage pulses ‘‘ I demonstrated that powerful electrical discharges of several hundred thousand volts which at that time were considered absolutely deadly, could be passed through the body without inconvenience or hurtful consequences’’ in the 1880s. This knowledge was utilized by d’Arsonval since 1892 for therapeutic purposes, mainly aiming for heat induction in certain parts of the body. In 1913, Rudolf Hoerber, at that time a physiologist at the University of Kiel (Germany), measured the electrical conductance of frog muscle at 7 MHz and found that at this frequency the membrane resistance is short circuited.
Since its beginning, bioimpedance remained to be a challenge to physicists, medical doctors, and of course engineers. The most relevant basic research was performed in the second half of the twentieth century. The progress that has been reached has been and is still utilized both for diagnostic and therapeutic purposes in medicine. Impedance plethysmography is one of the different fields of bioimpedance application. If impedance plethysmography is correctly understood, it does not only mean the determination of a solid volume with well-defined boundaries, but also the volumetric determination of one component contained in a mixture of different components.
IMPEDANCE PLETHYSMOGRAPHY |
131 |
Progress in technology has rendered possible applications that are of great interest for medicine. The most relevant progress is in the field of signal acquisition, including advanced electrode technology, signal processing, and model-based signal interpretation. Not all attempts to utilize the passive electrical properties of biological tissue for diagnostic purposes have been successful. In many cases, other technologies have been shown to be superior. But there is no doubt that the whole potential of impedance plethysmography has not been exhausted. New challenges in the medical field are cellular imaging and possibly even molecular imaging. In all applications, however, impedance plethysmography will have to prove its validity and efficiency.
BIBLIOGRAPHY
1.Nyboer J, Bango S, Nims LF. The Impedance Plethysmograph and Electrical Volume Recorder. CAM Report OSPR 1943; 149.
2.Schwan HP. Electrical properties of body tissues and impedance plethysmography. IRE Trans Biomed Electron 1955; 3:32–46.
3.Stewart GN. Researches on the circulation time in organs and on the influence which affect it. J Physiol 1894;15:1–89.
4.Li J. Multifrequente Impedanztomographie zur Darstellung der elektrischen Impedanzverteilung im menschlichen Thorax. PhD thesis, University of Stuttgart, 2000. Available at http:// elib.uni-stuttgart.de/opus/volltexte/2000/736/pdf/li_diss.pdf.
5.Kanai H, Haeno M, Sakamoto K. Electrical measurement of fluid distribution in legs and arms. Med Prog Technol 1987;12:159–170.
6.Osten H. Impedanz-Plethysmographie im Orthostasetest. Mu¨ nchn Med Wochenschr 1977;119:897–900.
7.Gersing E. Measurement of electrical impedance in organs. Biomed Techn 1991;36:6–11.
8.Dzwonczyk R, et al. Myocardial electrical impedance responds to ischemia in humans. IEEE Trans Biomed Eng 2004;BME-51:2206–2209.
9.Durney CH, Massoudi H, Iskander MF. Radiofrequency Radiation Dosimetry. 4th ed. USAFSAM-TR-85–73; 1985.
10.Gabriel S. 1997. Appendix B: Part 1: Literature Survey. Available at http://niremf.ifac.cnr.it/docs/DIELECTRIC/AppendixB1. html.
11.Segal KR. Estimation of extracellular and total body water by multiple-frequency bioelectrical impedance measurement. Am J Clin Nutr 1991;V54-1:26–29.
12.Neuman MR. Biopotential electrodes. In: Webster JG, editor. Medical Instrumentation—Application and Design. 3rd ed. New York: Wiley; 1998.
13.Rigaud B, Morucci J-P, Chauveau N. Bioimpedance measurement. In: Morucci J-P, et al. edition. Bioelectrical Impedance Techniques in Medicine. Crit. Rev. Biomed. Eng. 1996; 24: 257–351.
14.Yamakoshi KI, Shimazu H, Togawa T, Ito H. Admittance plethysmography for accurate measurement of human limb blood flow. Am J Physiol 1978;235:H821–H829.
15.Shimazu H, et al. Evaluation of the parallel conductor theory for measuring human limb blood flow by electrical admittance plethysmography. IEEE Trans Biomed Eng 1982;BME-29: 1–7.
16.Fricke H, Morse S. The electrical resistance of blood between 800 and 4.5 million cyclces. J Gen Physiol 1925;9: 153–157.