

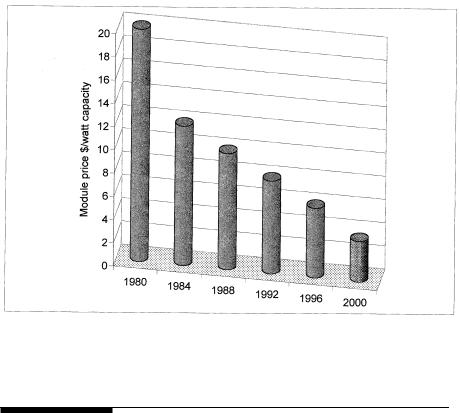
FIGURE 3-2
Photovoltaic module price trend.
3.1Present Status
At present, pv power is extensively used in stand-alone power systems in remote villages, particularly in hybrid with diesel power generators. It is expected that this application will continue to find expanding markets in many countries. The driving force is the energy need in developing countries, and the environmental concern in developed countries. In the United States, city planners are recognizing the favorable overall economics of the pv power for urban applications. Tens of thousands of private, federal, state and commercial pv systems have been installed over the last 20 years. More than 65 cities in 24 states have installed such systems for a variety of needed services. These cities, shown in Figure 3-7, are located in all regions of the country, dispensing the myth that pv systems require a sunbelt climate to work effectively and efficiently.
The U.S. utilities have started programs to develop power plants using the newly available low-cost pv modules. Idaho Power has a pilot program to supply power to selected customers not yet connected to the grid. Other
© 1999 by CRC Press LLC
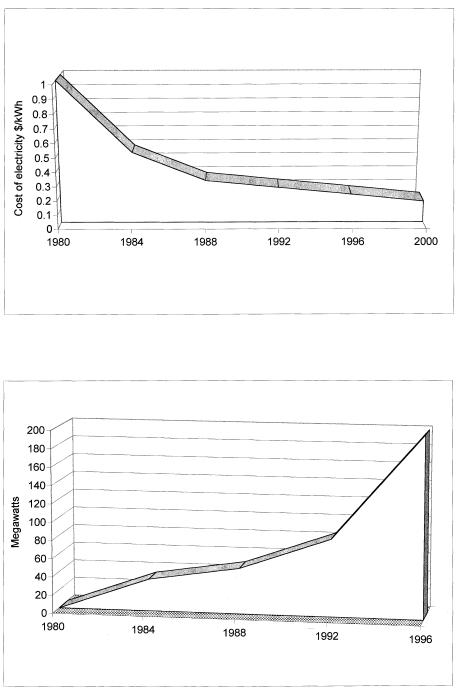
FIGURE 3-3
Photovoltaic energy price trend.
FIGURE 3-4
Cumulative capacity of pv installations in the U.S.A.
© 1999 by CRC Press LLC

FIGURE 3-5
Cumulative capacity of pv installations in the world.
utilities such as Southern California Edison, the municipal utility of Austin, Delmarva Power and Light, and New York Power Authority are installing such systems to meet peak demands. The Pacific Gas and Electric’s utilityscale 500 kW plant at Kerman is designed to deliver power during the local peak demand. It generates 1.1 MWh of energy annually.
The roof of the Aquatic Center in Atlanta (Figure 3-8), venue of the 1996 Olympic swimming competition, is one of the largest grid-connected power plants. It generates 345 kW of electric power, and is tied into the Georgia Power grid lines. Its capacity is enough to power 70 homes connected to the network. It saves 330 tons of CO2, 3.3 tons of SO2 and 1.2 tons of NOx yearly. Installations are under way to install a similar 500 kW grid-connected pv system to power the Olympics Games of 2000 in Sydney, Australia.
In 14 member countries of the International Energy Agency, the pv installations are being added at an average annual growth rate of 27 percent. The total installed capacity increased from 54 MW in 1990 to 176 MW in 1995. The IEA estimates that by the end of 2000, 550 MW of additional capacity will be installed, 64 percent off-grid and 36 percent grid-connected (Figure 3-9).
India is implementing perhaps the most number of pv systems in the world for remote villages. About 30 MW capacity has already been installed, with more being added every year. The country has a total production capacity of 8.5 MW modules per year. The remaining need is met by imports. A
© 1999 by CRC Press LLC
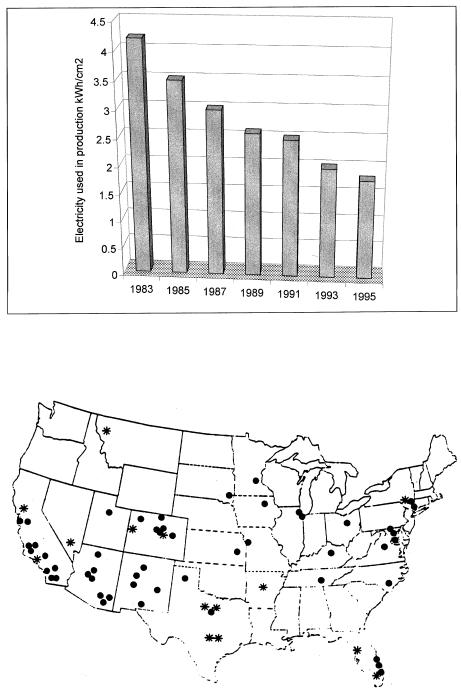
FIGURE 3-6
Energy consumption per cm2 of pv cell manufactured. (Source: U.S. Department of Commerce and Dataquest, Inc.)
FIGURE 3-7
U.S. cities with pv installations. (Source: Department of Energy, 1995.)
© 1999 by CRC Press LLC
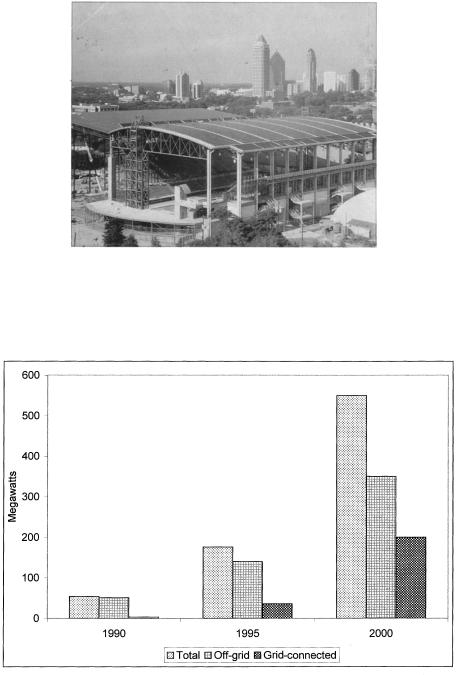
FIGURE 3-8
Roof (pv) of Atlanta’s Aquatic Center with 345 kW grid-connected power system. (Source: Georgia Institute of Technology. With permission.)
FIGURE 3-9
Cumulative pv installations in the IEA countries in 1990, 1995, and projected to 2000. (Source: International Energy Agency.)
© 1999 by CRC Press LLC