


TABLE 3-1
Production Capacities of Various pv Technologies in 1995
PV Technology |
1995 Production |
|
|
|
|
Crystalline Silicon |
55 |
MW |
Amorphous Silicon |
9 |
MW |
Ribbon Si, GaAs, CdTe |
1 |
MW |
TOTAL |
65 MW |
|
(Source: Carlson, D. E., Recent Advances in Photovoltaics, 1995. Proceedings of the Intersociety Engineering Conference on Energy Conversion, 1995.)
TABLE 3-2
Comparison of Crystalline and Amorphous Silicon Technologies
Crystalline Silicon |
Amorphous Silicon |
Present Status |
Workhorse of terrestrial and |
|
space applications |
Thickness |
200-400 µm (.004-.008 inch) |
Raw Material Cost |
High |
Conversion |
16-18 percent |
Efficiency |
|
Module Costs |
$6–8 per watt, expected to fall |
(1995) |
slowly due to the matured |
|
nature of this technology |
New rapidly developing technology, tens of MW yearly production facilities have been built in 1996 to produce low cost cells
2 µm (less then 1 percent of that in crystalline silicon)
About 3 percent of that in crystalline silicon 8-9 percent
$6-8 per watt, expected to fall rapidly to $2 per watt in 2000 due to heavy DOE funding to fully develop this new technology
3.4pv Energy Maps
The solar energy impinging the surface of the earth is depicted in Figure 3-15, where the white areas get more solar radiation per year. The yearly 24-hour average solar flux reaching the horizontal surface of the earth is shown in Figure 3-16, whereas Figure 3-17 depicts that in the month of December. Notice that the 24-hour average decreases in December. This is due to the shorter days and clouds, and not due to the cold temperature. As will be seen later, the pv cell actually converts more solar energy into electricity at low temperatures.
It is the total yearly energy capture potential of the site that determines the economical viability of installing a power plant. Figure 3-18 is useful in this regard, as it gives the annual average solar energy per day impinging on the surface always facing the sun at right angle. Modules mounted on a sun-tracking structure receive this energy. The electric energy produced per day is obtained by multiplying the map number by the photoconversion efficiency of the modules installed at the site.
© 1999 by CRC Press LLC

FIGURE 3-15
Solar radiation by regions of the world (higher energy potential in the white areas).
FIGURE 3-16
Yearly 24-hour average solar radiation in watts/m2 reaching the horizontal surface of the earth. (Source: Profiles in Renewable Energy, DOE/NREL Report No. DE-930000081, August 1994.)
© 1999 by CRC Press LLC
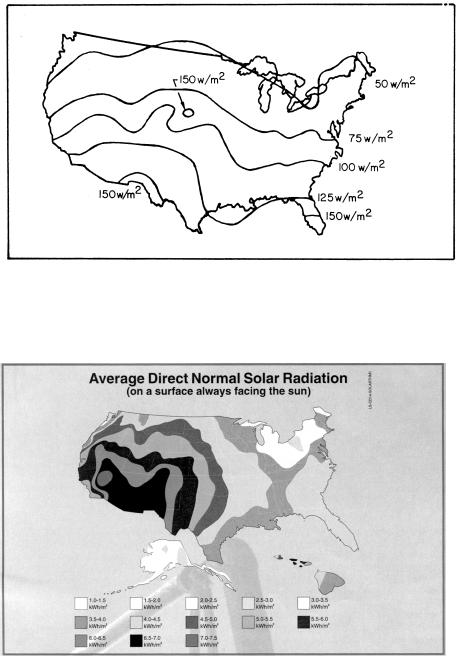
FIGURE 3-17
December 24-hour average solar radiation in watts/m2 reaching the horizontal surface of the earth. (Source: Profiles in Renewable Energy, DOE/NREL Report No. DE-930000081, August 1994.)
FIGURE 3-18
Yearly 24-hour average solar energy in kWh/m2 reaching surface always facing the sun at right angel. (Source: A. Anson, Profiles in Renewable Energy, DOE/NREL Report No. DE-930000081, August 1994.)
© 1999 by CRC Press LLC

References
1.Carlson, D. E. 1995. “Recent Advances in Photovoltaics,” 1995 Proceedings of the Intersociety Engineering Conference on Energy Conversion. 1995, p. 621-626.
© 1999 by CRC Press LLC