


power plants can also benefit small power systems by moving generation near the load, thus reducing voltage drop at the end of a long overloaded line.
In the developing countries like China and India, the demand has been rising at a 10 percent growth rate or more. This growth rate, when viewed with the large population base, makes these two countries rapidly growing electrical power markets for all sources of electrical energy, including the renewables.
1.3.2Emission-Free
In 1995, the U.S.A. produced 3 trillion kWh of electricity, 70 percent of it (2 trillion kWh) from fossil fuels, a majority of that came from coal. The resulting emission is estimated to be 2 billion tons of CO2, 15 million tons of SO2 and 6 million tons of NOx. The health effects of these emissions are of significant concern to the U.S. public. The electromagnetic field emission around the high voltage transmission lines is another concern that has also recently become an environmental issue.
For these benefits, the renewable energy sources are expected to find importance in the energy planning in all countries around the world.
References
1.U.S. Department of Energy. 1997. “International Energy Outlook 1997 with Projections to 2015,” DOE Office of the Integrated Analysis and Forecasting, Report No. DE-97005344, April 1997.
2.Felix, F. 1992. “State of the Nuclear Economy,” IEEE Spectrum, November 1997, p. 29-32.
© 1999 by CRC Press LLC

2
Wind Power
The first use of wind power was to sail ships in the Nile some 5000 years ago. The Europeans used it to grind grains and pump water in the 1700s and 1800s. The first windmill to generate electricity in the rural U.S.A. was installed in 1890. Today, large wind-power plants are competing with electric utilities in supplying economical clean power in many parts of the world.
The average turbine size of the wind installations has been 300 kW until the recent past. The newer machines of 500 to 1,000 kW capacity have been developed and are being installed. Prototypes of a few MW wind turbines are under test operations in several countries, including the U.S.A. Figure 2-1 is a conceptual layout of modern multimegawatt wind tower suitable for utility scale applications.1
Improved turbine designs and plant utilization have contributed to a decline in large-scale wind energy generation costs from 35 cents per kWh in 1980 to less than 5 cents per kWh in 1997 in favorable locations (Figure 2-2). At this price, wind energy has become one of the least-cost power sources. Major factors that have accelerated the wind-power technology development are as follows:
•high-strength fiber composites for constructing large low-cost blades.
•falling prices of the power electronics.
•variable-speed operation of electrical generators to capture maximum energy.
•improved plant operation, pushing the availability up to 95 percent.
•economy of scale, as the turbines and plants are getting larger in size.
•accumulated field experience (the learning curve effect) improving the capacity factor.
2.1Wind in the World
The wind energy stands out to be one of the most promising new sources of electrical power in the near term. Many countries promote the wind-power
© 1999 by CRC Press LLC

FIGURE 2-1
Modern wind turbine for utility scale power generation.
© 1999 by CRC Press LLC
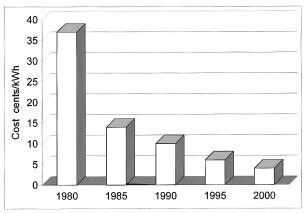
FIGURE 2-2
Declining cost of wind-generated electricity. (Source: AWEA/DOE/IEA.)
technology by national programs and market incentives. The International Energy Agency (IEA), with funding from 14 countries, supports joint research projects and information exchange on wind-power development.2 These countries are Austria, Canada, Denmark, Finland, Germany, Italy, Japan, the Netherlands, New Zealand, Norway, Spain, Sweden, the United Kingdom, and the United States of America. By the beginning of 1995, more than 25,000 grid-connected wind turbines were operating in the IEA-member countries, amounting to a rated power capacity of about 3,500 MW. Collectively, these turbines are producing more than 6 million MWh of energy every year. The annual rate of capacity increase presently is about 600 MW.
According to the AWEA and the IEA, the 1994, 1995, and 1997 installed capacity in countries listed in Table 2-1 were 3,552 MW, 4,776 MW, and 7,308 MW, respectively. The 1995 sales of new plants set a record of 1224 MW ($1.5 billion), boosting the global installed capacity by 35 percent to nearly 4,776 MW. The most explosive growth occurred in Germany installing 500 MW and India adding 383 MW to their wind capacities. New wind plants installed in 1996-97 added another 2,532 MW to that total with an annual growth rate of 24 percent.
Much of the new development around the world can be attributed to government policies to promote the renewables energy sources. For example, the United Kingdom’s nonfossil fuel obligation program will add 500 MW of wind power to the UK’s power grid within this decade.
A 1994 study, commissioned by the American Wind Energy Association (AWEA) with Arthur D. Little Inc., concluded that in the 10 overseas wind farm markets, between 1,935 MW and 3,525 MW of wind capacity would be added by the year 2000 (Table 2-2). This translates to between $2 to $3.5 billion in sales.
© 1999 by CRC Press LLC

TABLE 2-1
Installed Wind Capacity in Selected Countries, 1994, 1995 and 1997
|
|
|
|
Growth |
Annual Growth Rate |
|
1994 |
1995 |
1997 |
1994-1995 |
1995-97 |
Country |
MW |
MW |
MW |
Percent |
Percent |
|
|
|
|
|
|
Germany |
643 |
1136 |
2079 |
76.7 |
35.2 |
United States |
1785 |
1828 |
2000 |
2.4 |
4.7 |
Denmark |
540 |
614 |
1141 |
13.7 |
36.3 |
India |
182 |
565 |
1000 |
210 |
33.0 |
Netherlands |
153 |
259 |
325 |
69 |
12.0 |
United Kingdom |
147 |
193 |
308 |
31 |
26.3 |
Spain |
72 |
145 |
455 |
100 |
77.1 |
China |
30 |
36 |
— |
20 |
— |
TOTAL |
3552 |
4776 |
7308 |
35.4 |
23.7 |
(Source: United States data from Energy Information Administration, Annual Energy Outlook 1997, DOE/EIA Report No. 0383-97, Table A17, Washington, D.C., December 1996. Other countries data from the Amercian Wind Energy Association, Satus Report of International Wind Projects, Washington, D.C., March 1996.)
TABLE 2-2
Projected Wind Capacity Addition in
Megawatts Between 1994 and 2000
|
Addition planned |
Country |
Megawatts |
|
|
United Kingdom |
100–300 |
Spain |
150–250 |
Germany |
200–350 |
India |
700–1200 |
China |
350–600 |
Mexico |
150–300 |
Argentina |
100–150 |
Chile |
100–200 |
Australia |
50–75 |
New Zealand |
50–100 |
Total |
1950–3525 |
(Source: American Wind Energy Association/Arthur D. Little, Inc.)
2.2The U.S.A.
Large-scale wind-power development in the U.S.A. has been going on since the late 1970s. In 1979, a 2 MW experimental machine was installed jointly by the Department of Energy and NASA on the Howard Knob Mountain near Boone, North Carolina. The system was designed and built by the
© 1999 by CRC Press LLC
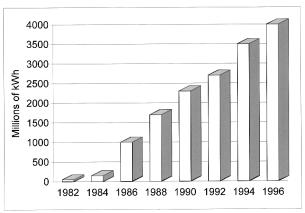
FIGURE 2-3
Electricity generated by U.S. wind-power plants since 1982. (Source: AWEA. With permission.)
General Electric Company using two 61-meter diameter rotor blades from Boeing Aerospace Corporation. It was connected to the local utility grid and operated successfully.
Beginning 1984, the electrical energy derived from the wind and delivered to the paying users is increasing rapidly (Figure 2-3). Until the late 1980s, most wind power plants in the U.S.A. were owned and operated by private investors or cooperatives. In California alone, there was more than 1500 MW of wind generating capacity in operation by the end of 1991. The Southern California Edison Company had over 1,120 MW of wind turbines under contract, with over 900 MW installed and connected to their grid. Major benefits to the Southern California Edison are the elimination of building new generating plant and transmission lines.
The technology development and the resulting price decline have caught the interest of a number of electric utilities outside California that are now actively developing wind energy as one element of the balanced resource mix.3 Projects are being built in Alaska, California, Minnesota, Texas, Vermont, Washington, and Wyoming. During 1994, several new wind-energy projects started, particularly in the Midwest. A 73-turbine 25 MW plant was completed in Minnesota. Iowa and Wyoming producers and utilities plan to add significant wind-power capacity in the near future.4 In 1995, a 35 MW utility-scale wind plant came on-line in Texas, which is expandable to 250 MW capacity, enough to supply 100,000 homes. This plant has a 25-year fixed-price contract to supply Austin City at 5 cents per kWh for generation and 1 cent per kWh for transmission. Nearly 700 MW of additional wind capacity was brought on-line in the U.S.A. by the end of 1996. The current and near-term wind-power capacity plans in the U.S.A. are shown in Figure 2-4.
© 1999 by CRC Press LLC
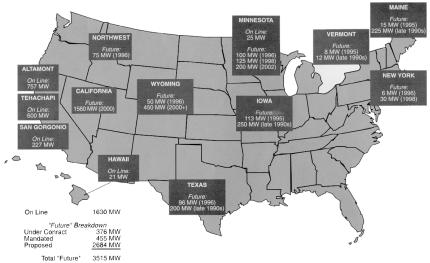
FIGURE 2-4
Wind-power capacity plans in the U.S.A., current and near future. (Source: NREL/IEA Wind Energy Annual Report, 1995.)
About 90 percent of the usable wind resource in the U.S.A. lies in the Great Plains. In Minnesota, Northern States Power Company started installing 100 MW wind-power capacity with a plan to expand to at least 425 MW by 2002. Several contractors working with the National Renewable Energy Laboratory are negotiating power purchase agreements with utilities for 4,200 MW of wind capacity at an estimated $2 billion capital investment.
The Energy Information Administration estimates that the U.S. wind capacity will reach 12,000 MW by 2015. Out of this capacity, utilities and wind-power developers have announced plans for more than 4,200 MW of new capacity in 15 states by 2006. The 1.5 cents per kWh federal tax credit that took effect January 1, 1994, is certainly helping the renewables.
State legislators in Minnesota have encouraged the wind power development by mandating that Northern States Power Company acquire 425 MW of wind generation by 2002. After commissioning a 25 MW wind plant in the Buffalo Ridge Lake Benton area in southwestern Minnesota near Holland, the Northern States Power is now committed to develop up to 100 MW of wind capacity over the next few years in the same area. This area has good steady wind and is accessible to the transmission lines. To support this program, the state has funded the “Wind Smith” education program at junior colleges to properly train the work force with required skills in installing, operating, and repairing the wind power plants.
© 1999 by CRC Press LLC