

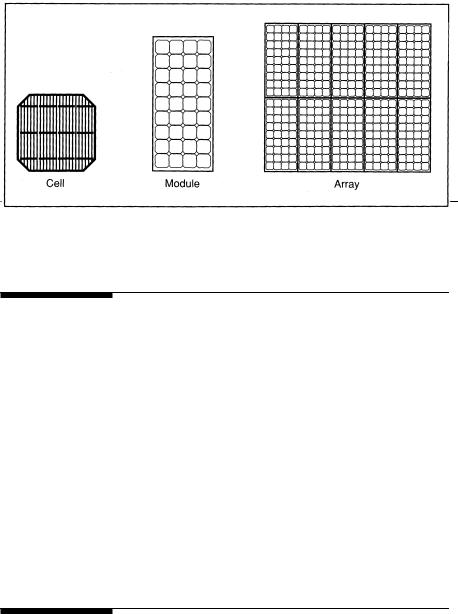
FIGURE 8-3
Several pv cells make a module and several modules make an array.
8.2Module and Array
The solar cell described above is the basic building block of the pv power system. Typically, it is a few square inches in size and produces about one watt of power. For obtaining high power, numerous such cells are connected in series and parallel circuits on a panel (module) area of several square feet (Figure 8-3). The solar array or panel is defined as a group of several modules electrically connected in series-parallel combinations to generate the required current and voltage. Figure 8-4 shows the actual construction of a module in a frame that can be mounted on a structure.
Mounting of the modules can be in various configurations as seen in Figure 8-5. In the roof mounting, the modules are in the form that can be laid directly on the roof. In the newly developed amorphous silicon technology, the pv sheets are made in shingles that can replace the traditional roof shingles on one-to-one basis, providing a better economy in the material and labor.
8.3Equivalent Electrical Circuit
The complex physics of the pv cell can be represented by the equivalent electrical circuit shown in Figure 8-6. The circuit parameters are as follows.
© 1999 by CRC Press LLC
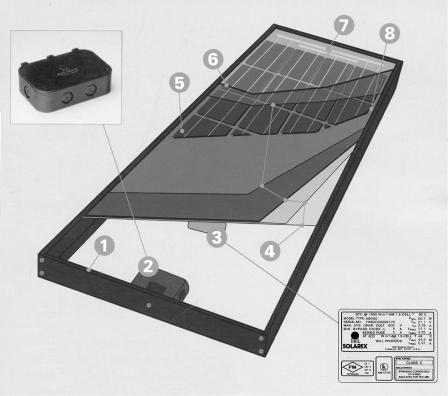
FIGURE 8-4
Construction of pv module: 1) frame, 2) weatherproof junction box, 3) rating plate, 4) weather protection for 30-year life, 5) pv cell, 6) tempered high transmissivity coverglass, 7) outside electrical bus, 8) frame clearance. (Source: Solarex Corporation, Frederick, Maryland, With permission.)
The output-terminal current I is equal to the light-generated current IL , less the diode-current Id and the shunt-leakage current Ish. The series resistance Rs represents the internal resistance to the current flow, and depends on the p-n junction depth, the impurities and the contact resistance. The shunt resistance Rsh is inversely related with leakage current to the ground. In an ideal pv cell, Rs = 0 (no series loss), and Rsh = ∞ (no leakage to ground). In a typical high quality one square inch silicon cell, Rs = 0.05 to 0.10 ohm and Rsh = 200 to 300 ohms. The pv conversion efficiency is sensitive to small variations in Rs, but is insensitive to variations in Rsh. A small increase in Rs can decrease the pv output significantly.
In the equivalent circuit, the current delivered to the external load equals the current IL generated by the illumination, less the diode current Id and the ground-shunt current Ish. The open circuit voltage Voc of the cell is obtained when the load current is zero, i.e., when I = 0, and is given by the following:
© 1999 by CRC Press LLC
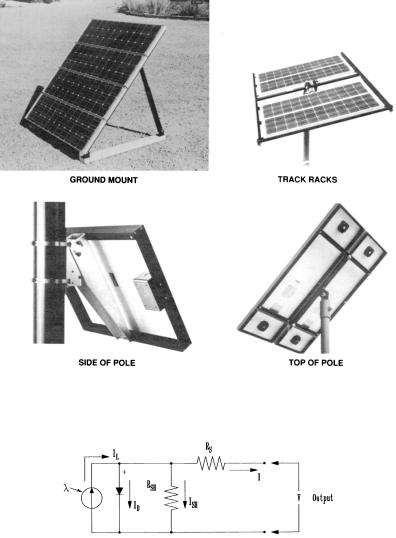
FIGURE 8-5
pv module mounting methods.
FIGURE 8-6
Equivalent electrical circuit of pv module, showing the diode and ground leakage currents.
Voc = V + I Rsh |
(8-1) |
The diode current is given by the classical diode current expression:
I |
d |
= I |
|
QVoc |
− 1 |
(8-2) |
|
||||||
|
|
D |
|
|
||
|
|
|
AKT |
|
|
|
© 1999 by CRC Press LLC

where ID = the saturation current of the diode
Q = electron charge = 1.6 · 10–19 Coulombs A = curve fitting constant
K = Boltzmann constant = 1.38 · 10–23 Joule/°K T = temperature on absolute scale °K
The load current is therefore given by the expression:
|
|
|
|
|
QVoc |
|
|
Voc |
|
|
I = I |
|
− I |
|
e AKT |
− 1 |
− |
(8-3) |
|||
L |
D |
Rsh |
||||||||
|
|
|
|
|
|
|
||||
The last term, the ground-leakage current, in practical cells is small compared to IL and ID, and can be ignored. The diode-saturation current can, therefore, be determined experimentally by applying voltage Voc in the dark and measuring the current going into the cell. This current is often called the dark current or the reverse diode-saturation current.
8.4Open Circuit Voltage and Short Circuit Current
The two most important parameters widely used for describing the cell electrical performance is the open-circuit voltage Voc and the short-circuit current Isc. The short-circuit current is measured by shorting the output terminals, and measuring the terminal current under full illumination. Ignoring the small diode and the ground-leakage currents under zero-terminal voltage, the short-circuit current under this condition is the photocurrent IL.
The maximum photovoltage is produced under the open-circuit voltage. Again, by ignoring the ground-leakage current, Equation 8-3 with I = 0 gives the open-circuit voltage as the following:
|
AKT |
|
|
IL |
|
|
|
V = |
Log |
n |
+ 1 |
(8-4) |
|||
|
|
||||||
oc |
Q |
|
|
|
|
||
|
|
ID |
|
|
|||
The constant KT/Q is the absolute temperature expressed in voltage (300°K = 0.026 volt). In practical photocells, the photocurrent is several orders of magnitude greater than the reverse saturation current. Therefore, the open-circuit voltage is many times the KT/Q value. Under condition of constant illumination, IL/ID is a sufficiently strong function of the cell temperature, and the solar cell ordinarily shows a negative temperature coefficient of the open-circuit voltage.
© 1999 by CRC Press LLC
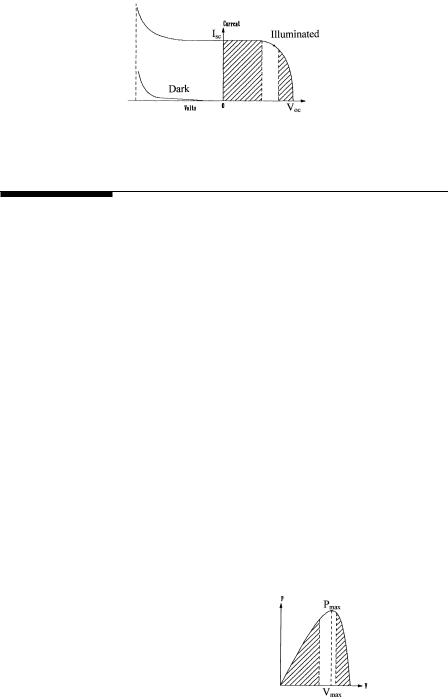
FIGURE 8-7
Current versus voltage (i-v) characteristics of the pv module in sunlight and in dark.
8.5i-v and p-v Curves
The electrical characteristic of the pv cell is generally represented by the current versus voltage (i-v) curve. Figure 8-7 shows the i-v characteristic of a pv module under two conditions, in sunlight and in dark. In the first quadrant, the top left of the i-v curve at zero voltage is called the shortcircuit current. This is the current we would measure with the output terminals shorted (zero voltage). The bottom right of the curve at zero current is called the open-circuit voltage. This is the voltage we would measure with the output terminals open (zero current). In the left shaded region, the cell works like a constant current source, generating voltage to match with the load resistance. In the shaded region on the right, the current drops rapidly with a small rise in voltage. In this region, the cell works like a constant voltage source with an internal resistance. Somewhere in the middle of the two shaded regions, the curve has a knee point.
If the voltage is externally applied in the reverse direction, say during a system fault transient, the current remains flat and the power is absorbed by the cell. However, beyond a certain negative voltage, the junction breaks down as in a diode, and the current rises to a high value. In the dark, the current is zero for voltage up to the breakdown voltage which is the same as in the illuminated condition.
The power output of the panel is the product of the voltage and the current outputs. In Figure 8-8, the power is plotted against the voltage. Notice that
FIGURE 8-8
Power versus voltage (p-v) characteristics of the pv module in sunlight.
© 1999 by CRC Press LLC