


FIGURE 7-10
Design choices in generator drive systems.
7.3Drive Selection
The variable-speed operation can capture theoretically about one-third more energy per year than the fixed-speed system.2 The actual improvement reported by the variable-speed systems operators in the field is lower, around 20 to 35 percent. However, the improvement of even 15 to 20 percent in the annual energy yield by variable-speed operation can make the systems commercially viable in low wind region. This can open a whole new market for the wind-power installations, and this is happening at present in many countries. Therefore the newer installations are more likely to use the vari- able-speed systems.
As of 1997, the distribution of the system design is 35 percent one fixedspeed, 45 percent two fixed-speed and 20 percent variable-speed power electronics systems (Figure 7-10). The market share of the variable-speed systems, however, is increasing every year.3
7.4Cut-Out Speed Selection
In any case, it is important that the machine is operated below its speed and power limits. Exceeding either one above the design limit can damage and even destroy the machine.
© 1999 by CRC Press LLC
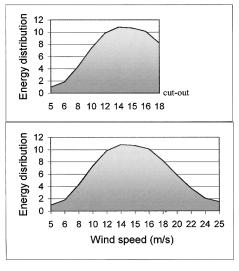
FIGURE 7-11
Probability distribution of annual energy production at various cut out speeds.
In designing the variable-speed system, important decision must be made on the upper limit of the operating speed. For the energy distribution shown in Figure 7-11, if the wind plant is designed to operate at fixed speed V1 , it can capture energy E1 over the year. On the other hand, if it is designed to operate at a variable speed up to V2 , it can capture energy E2 over the same period. The latter, however, comes with an added cost of designing the wind turbine and the generator to handle high power. The benefit and cost must be traded-off for the given site to arrive at the optimum upper limit on the rotor speed.
On one side of the trade is additional energy (E2 – E1) that can be captured over the year. If the revenue of the generated electricity is valued at p $/kWh, the added benefit per year is p · (E2 – E1) dollars. The present worth P of this yearly benefit over the life of n years at the annual cost of capital i is as follows:
|
|
(1+ i) |
n |
− 1 |
|
|
|
P = p (E − E ) |
|
|
(7-2) |
||||
i (1+ i)n |
|||||||
2 1 |
|
|
|
||||
|
|
|
|
|
|
|
|
If the variable-speed system requires additional capital cost of C, then the variable-speed system will be financially beneficial if C < P.
© 1999 by CRC Press LLC
References
1.Chalmers, B. J. and Spooner, E. 1998. “Axial flux permanent magnet generator for gearless wind energy systems,” IEEE Paper No. PE-P13-EC-02, July 1998.
2.Zinger, D. S., Muljadi, E. 1997. “Annualized wind energy improvement using variable-speed,” IEEE Transactions on Industry Applications, Vol. 33-6, p. 1444-47, 1997.
3.Gardner, P. 1997. “Wind turbine generator and drive systems,” Wind Directions, Magazine of the European Wind Energy Association, London, October, 1997.
© 1999 by CRC Press LLC

8
Solar Photovoltaic Power System
The photovoltaic effect is the electrical potential developed between two dissimilar materials when their common junction is illuminated with radiation of photons. The photovoltaic cell, thus, converts light directly into electricity. The pv effect was discovered in 1839 by French physicist Becquerel. It remained in the laboratory until 1954, when Bell Laboratories produced the first silicon solar cell. It soon found application in the U.S. space programs for its high power capacity per unit weight. Since then it has been an important source of power for satellites. Having developed maturity in the space applications, the pv technology is now spreading into the terrestrial applications ranging from powering remote sites to feeding the utility lines.
8.1The pv Cell
The physics of the pv cell is very similar to the classical p-n junction diode (Figure 8-1). When light is absorbed by the junction, the energy of the absorbed photons is transferred to the electron system of the material, resulting in the creation of charge carriers that are separated at the junction. The charge carriers may be electron-ion pairs in a liquid electrolyte, or electronhole pairs in a solid semiconducting material. The charge carriers in the junction region create a potential gradient, get accelerated under the electric field and circulate as the current through an external circuit. The current squared times the resistance of the circuit is the power converted into electricity. The remaining power of the photon elevates the temperature of the cell.
The origin of the photovoltaic potential is the difference in the chemical potential, called the Fermi level, of the electrons in the two isolated materials. When they are joined, the junction approaches a new thermodynamic equilibrium. Such equilibrium can be achieved only when the Fermi level is equal in the two materials. This occurs by the flow of electrons from one material to the other until a voltage difference is established between the two materials which have the potential just equal to the initial difference of the Fermi level. This potential drives the photocurrent.
© 1999 by CRC Press LLC
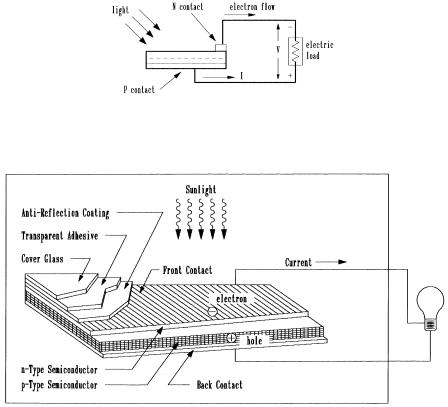
FIGURE 8-1
Photovoltaic effect converts the photon energy into voltage across the p-n junction.
FIGURE 8-2
Basic construction of pv cell with performance enhancing features (current collecting mesh, anti-reflective coating and cover glass protection).
Figure 8-2 shows the basic cell construction.1 For collecting the photocurrent, the metallic contacts are provided on both sides of the junction to collect electrical current induced by the impinging photons on one side. Conducting foil (solder) contact is provided over the bottom (dark) surface and on one edge of the top (illuminated) surface. Thin conducting mesh on the remaining top surface collects the current and lets the light through. The spacing of the conducting fibers in the mesh is a matter of compromise between maximizing the electrical conductance and minimizing the blockage of the light. In addition to the basic elements, several enhancement features are also included in the construction. For example, the front face of the cell has anti-reflective coating to absorb as much light as possible by minimizing the reflection. The mechanical protection is provided by the coverglass applied with a transparent adhesive.
© 1999 by CRC Press LLC