

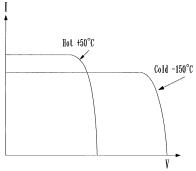
FIGURE 8-15
Effect of temperature on the i-v characteristic. The cell produces less current but greater voltage, with net gain in the power output at cold temperature.
8.6.4Temperature Effect
With increasing temperature, the short-circuit current of the cell increases, whereas the open-circuit voltage decreases (Figure 8-15). The effect of temperature on the power is quantitatively evaluated by examining the effects on the current and the voltage separately. Say Io and Vo are the short-circuit current and the open-circuit voltage at the reference temperature T, and α and β are their respective temperature coefficients. If the operating temperature is increased by ∆Τ, then the new current and voltage are given by the following:
Isc = Io (1+ α ∆T) and Voc = Vo (1− β ∆T) |
(8-6) |
Since the operating current and the voltage change approximately in the same proportion as the short-circuit current and open-circuit voltage, respectively, the new power is as follows:
P = V I = Io (1+ α ∆T) Vo (1− β ∆T) |
(8-7) |
This can be simplified in the following expression by ignoring a small term:
P = Po [1+ (α − β) ∆T] |
(8-8) |
For typical single crystal silicon cells, α is 500 µu per °C and β is 5 mu per
°C. The power is therefore: |
|
P = Po [1+ (500µu − 5mu) ∆T] or Po [1− .0045∆T] |
(8-9) |
© 1999 by CRC Press LLC
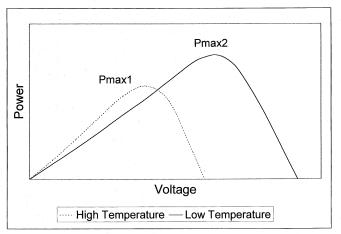
FIGURE 8-16
Effect of temperature on the p-v characteristic. The cell produces more power at cold temperature.
This expression indicates that for every °C rise in the operating temperature above the reference temperature, the silicon cell power output decreases by 0.45 percent. Since the increase in the current is much less than the decrease in the voltage, the net effect is the decrease in power at high operating temperatures.
The effect of varying temperature on the power output is shown in the power versus voltage characteristics at two operating temperatures in Figure 8-16. The figure shows that the maximum power available at lower temperature is higher than that at higher temperature. Thus, cold temperature is actually better for the pv cell, as it generates more power. However,
the two Pmax points are not at the same voltage. In order to extract maximum power at all temperatures, the pv system must be designed such that the
module output voltage can increase to V2 for capturing Pmax2 at lower temperature and can decrease to V1 for capturing Pmax1 at higher temperature.
8.6.5Effect of Climate
On a partly cloudy day, the pv module can produce up to 80 percent of their full sun power. Even on an extremely overcast day, it can produce about 30 percent power. Snow does not usually collect on the modules, because they are angled to catch the sun. If snow does collect, it quickly melts. Mechanically, modules are designed to withstand golf ball size hail.
8.6.6Electrical Load Matching
The operating point of any power system is the intersection of the source line and the load line. If the pv source having the i-v and p-v characteristics
© 1999 by CRC Press LLC
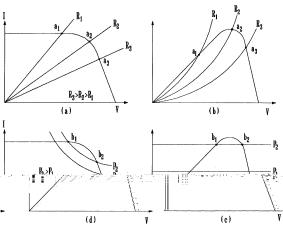
FIGURE 8-17
Operating stability and electrical load matching with resistive load and constant power load.
shown in Figure 8-17 (a) is supplying the power to the resistive load R1, it will operate at point A1. If the load resistance increases to R2 or R3, the operating point moves to A2 or A3 , respectively. The maximum power is extracted from the module when the load resistance is R2 (Figure 8-17b). Such load matching with the source is always necessary for maximum power extraction from the pv module.
The operation with constant power loads is shown in Figure 8-17(c) and
(d). The constant power load line has two points of intersection with the source line, denoted by B1 and B2. Only point B2 is stable, as any perturbation from it will generate a restoring power to take the operation back to B2. Therefore, the system will operate at B2.
The necessary condition for the electrical operating stability of the solar array is as follows:
dP |
dP |
|
||||
|
|
|
> |
|
|
(8-10) |
|
|
|||||
dV load |
dV source |
|
||||
Some loads such as heaters have constant resistance, with power varying with the voltage squared. On the other hand, some loads such as induction motors behave more like constant power loads, drawing more current at lower voltage. In most large systems with mix loads, the power varies approximately in linear proportion with voltage.
8.6.7Sun Tracking
More energy is collected by the end of the day if the pv module is installed on a tracker, with an actuator that follows the sun like a sunflower. There are two types of sun trackers:
© 1999 by CRC Press LLC
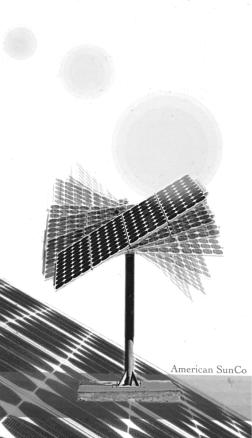
FIGURE 8-18
Dual-axis suntracker follows the sun like a sunflower around the year. (Source: American Sun Company, Blue Hill, Maine. With permission.)
•one-axis tracker, which follows the sun from east to west during the day.
•two-axis tracker tracks the sun from east to west during the day, and from north to south during the seasons of the year (Figure 8-18). A sun tracking design can increase the energy yield up to 40 percent over the year compared to the fixed-array design. The dual-axis tracking is done by two linear actuator motors, which aim the sun within one degree of accuracy (Figure 8-19). During the day, it tracks the sun east to west. At night it turns east to position itself for the next morning sun. Old trackers did this after the sunset using a small nickel-cadmium battery. The new designs eliminate the battery requirement by doing it in the weak light of the dusk and/or dawn. The Kelley cosine presented in Table 8-1 is useful to assess, accurately, the power available from sun at the evening angles.
©1999 by CRC Press LLC
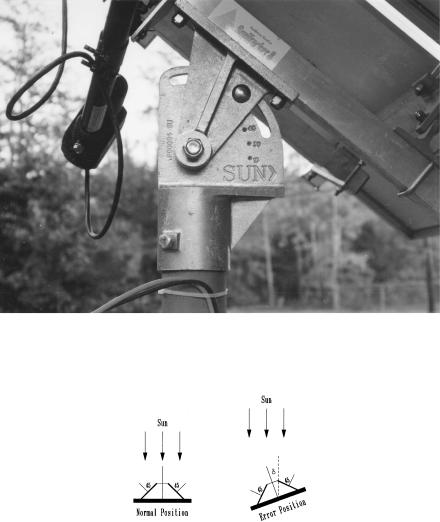
FIGURE 8-19
Actuator motor of the suntracker. (Source: American Sun Company, Blue Hill, Maine. With permission.)
FIGURE 8-20
Sun tracking actuator principle. The two differentially connected sensors at 45° generate signal proportional to the pointing error.
When the sun is obscured by a dark cloud, the tracker may aim at the next brightest object, which is generally the edge of the cloud. When the cloud is gone, the tracker aims at the sun once again. Such sun-hunting is eliminated in newer suntracker design.
One method of designing the suntracker is to use two pv cells mounted on two 45° wedges (Figure 8-20), and connecting them differentially in series through an actuator motor. When the sun is perfectly normal, the current on both cells are equal to Io · cos 45°. Since they are connected in series opposition, the net current in the motor is zero, and the array stays put. On
© 1999 by CRC Press LLC