

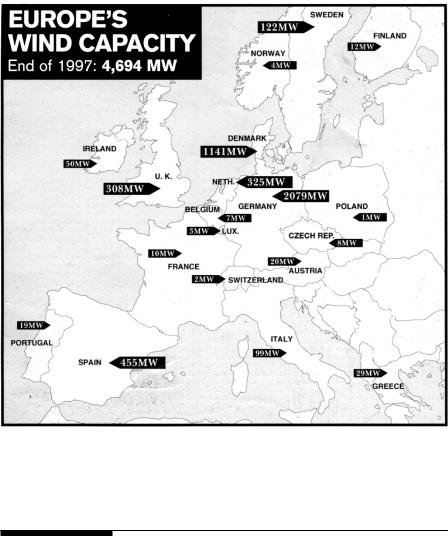
FIGURE 2-5
Installed wind capacity in European countries as of December 1997. (Source: Wind Directions, Magazine of the European Wind Energy Association, London, January 1998. With permission.)
2.3Europe
The wind-power picture in Europe is rapidly growing. The 1995 projections on the expected wind capacity in 2000 have been met in 1997, in approximately one-half of the time. Figure 2-5 depicts the wind capacity installed in the European countries at the end of 1997. The total capacity installed was 4,694 MW. The new targets adopted by the European Wind Energy Association are 40,000 MW capacity by 2010 and 100,000 MW by 2020. These targets form part of a series of policy objectives agreed by the association in November
© 1999 by CRC Press LLC

1997. Germany and Denmark lead Europe in the wind power. Both have achieved phenomenal growth through guaranteed tariff based on the domestic electricity prices. Germany has a 35-fold increase between 1990 and 1996. With 2,079 MW installed capacity, Germany is now the world leader. The former global leader, the U.S.A., has seen only a small increase during this period, from 1,500 MW in 1990 to approximately 2,000 MW in 1997.
2.4India
India has 9 million square kilometers land area with a population over 900 million, of which 75 percent live in agrarian rural areas. The total power generating capacity has grown from 1,300 MW in 1950 to about 100,000 MW in 1998 at an annual growth rate of about nine percent. At this rate, India needs to add 10,000 MW capacity every year. The electricity network reaches over 500,000 villages and powers 11 million agricultural water-pumping stations. Coal is the primary source of energy. However, coal mines are concentrated in certain areas, and transporting coal to other parts of the country is not easy. One-third of the total electricity is used in the rural areas, where three-fourths of the population lives. The transmission and distribution loss in the electrical network is relatively high at 25 percent. The environment in a heavily-populated area is more of a concern in India than in other countries. For these reasons, the distributed power system, such as wind plants near the load centers, are of great interest to the state-owned electricity boards. The country has adopted aggressive plans for developing these renewables. As a result, India today has the largest growth rate of the wind capacity and is one of the largest producers of wind energy in the world.5 In 1995, it had 565 MW of wind capacity, and some 1,800 MW additional capacity is in various stages of planning. The government has identified 77 sites for economically feasible wind-power generation, with a generating capacity of 4,000 MW of grid-quality power.
It is estimated that India has about 20,000 MW of wind power potential, out of which 1,000 MW has been installed as of 1997. With this, India now ranks in the first five countries in the world in wind-power generation, and provides attractive incentives to local and foreign investors. The Tata Energy Research Institute’s office in Washington, D.C., provides a link between the investors in India and in the U.S.A.
2.5Mexico
Mexico has over a decade of experience with renewable power systems. The two federally-owned utilities provide power to 95 percent of Mexico’s
© 1999 by CRC Press LLC
population. However, there are still 90,000 hard-to-access villages with fewer than 1,000 inhabitants without electricity. These villages are being powered by renewable systems with deep cycle lead-acid batteries for energy storage. The wind resource has been thoroughly mapped in collaboration with the U.S. National Renewable Energy Laboratory.6
2.6Ongoing Research and Development
The total government research and development funding in the International Energy Agency member countries in 1995 was about $200 million. The U.S. Department of Energy funded about $50 million worth of research and development in 1995. The goal of these programs is to further reduce the wind electricity-generation cost to less than 4 cents per kWh by the year 2000. The Department of Energy and the U.S. national laboratories also have a number of programs to promote the wind-hybrid power technologies throughout the developing world, with particular emphasis on Latin America and the Pacific Rim countries.7 These activities include feasibility studies and pilot projects, project financing and supporting renewable energy education efforts.
References
1.U.S. Department of Energy. 1995. “Wind Energy Programs Overview,” NREL Report No. DE-95000288, March 1995.
2.International Energy Agency. 1995. “Wind Energy Annual Report,” International Energy Agency Report by NREL, March 1995.
3.Utility Wind Interest Group. 1995. “Utilities Move Wind Technology Across America,” 1995 Report. November 1995.
4.Anson, S., Sinclair, K., and Swezey, B. 1994. “Profiles in Renewables Energy,”
Case studies of successful utility-sector projects, DOE/NREL Report No. DE930000081, National Renewable Energy Laboratory, Golden, Colorado, August 1994.
5.Gupta, A. K. 1997. “Power Generation from Renewables in India,” Ministry of Non-Conventional Energy Sources, New Delhi, India, 1997.
6.Schwartz, M. N. and Elliott, D. L. 1995. “Mexico’s Wind Resources Assessment Project,” DOE/NREL Report No. DE-AC36-83CH10093, National Renewable Energy Laboratory, Golden, Colorado, May 1995.
7.Hammons, T. J., Ramakumar, R., Fraser, M., Conners, S. R., Davies, M., Holt, E. A., Ellis, M., Boyers, J., and Markard, J. 1997. “Renewable Energy Technology Alternatives for Developing Countries,” IEEE Power Engineering Review, December 1997, p. 10-21.
© 1999 by CRC Press LLC

3
Photovoltaic Power
The photovoltaic (pv) power technology uses semiconductor cells (wafers), generally several square centimeters in size. From the solid-state physics point of view, the cell is basically a large area p-n diode with the junction positioned close to the top surface. The cell converts the sunlight into direct current electricity. Numerous cells are assembled in a module to generate required power (Figure 3-1). Unlike the dynamic wind turbine, the pv installation is static, does not need strong tall towers, produces no vibration or noise, and needs no cooling. Because much of the current pv technology uses crystalline semiconductor material similar to integrated circuit chips, the production costs have been high. However, between 1980 and 1996, the capital cost of pv modules per watt of power capacity has declined from more than $20 per watt to less than $5 per watts (Figure 3-2). During the same period, the cost of pv electricity has declined from almost $1 to about $0.20 per kWh, and is expected to decline to $0.15 per kWh by the year 2000 (Figure 3-3). The installed capacity in the U.S. has risen from nearly zero in 1980 to approximately 200 MW in 1996 (Figure 3-4). The world capacity of pv systems was about 350 MW in 1996, which could increase to almost 1,000 MW by the end of this century (Figure 3-5).
The pv cell manufacturing process is energy intensive. Every square centimeter cell area consumes a few kWh before it faces the sun and produces the first kWh of energy. However, the manufacturing energy consumption is steadily declining with continuous implementation of new production processes (Figure 3-6).
The present pv energy cost is still higher than the price the utility customers pay in most countries. For that reason, the pv applications have been limited to remote locations not connected to the utility lines. With the declining prices, the market of new modules has been growing at more than a 15 percent annual rate during the last five years. The United States, the United Kingdom, Japan, China, India, and other countries have established new programs or have expanded the existing ones. It has been estimated that the potential pv market, with new programs coming in, could be as great as 1,600 MW by 2010. This is a significant growth projection, largely attributed to new manufacturing plants installed in the late 1990s to manufacture low cost pv cells and modules to meet the growing demand.
© 1999 by CRC Press LLC

FIGURE 3-1
Photovoltaic module in sunlight generates direct current electricity. (Source: Solarex Corporation, Frederick, Md. With permission.)
Major advantages of the photovoltaic power are as follows:
•short lead time to design, install, and start up a new plant.
•highly modular, hence, the plant economy is not a strong function of size.
•power output matches very well with peak load demands.
•static structure, no moving parts, hence, no noise.
•high power capability per unit of weight.
•longer life with little maintenance because of no moving parts.
•highly mobile and portable because of light weight.
Almost 40 percent of the pv modules installed in the world are produced in the United States of America. Approximately 40 MW modules were produced in the U.S.A. in 1995, out of which 19 MW were produced by Siemens Solar Industries and 9.5 MW by Solarex Corporation.
© 1999 by CRC Press LLC