- •Contents at a glance
- •Contents
- •Introduction
- •Who this book is for
- •Assumptions about you
- •Organization of this book
- •Conventions
- •About the companion content
- •Acknowledgments
- •Errata and book support
- •We want to hear from you
- •Stay in touch
- •Chapter 1. Introduction to data modeling
- •Working with a single table
- •Introducing the data model
- •Introducing star schemas
- •Understanding the importance of naming objects
- •Conclusions
- •Chapter 2. Using header/detail tables
- •Introducing header/detail
- •Aggregating values from the header
- •Flattening header/detail
- •Conclusions
- •Chapter 3. Using multiple fact tables
- •Using denormalized fact tables
- •Filtering across dimensions
- •Understanding model ambiguity
- •Using orders and invoices
- •Calculating the total invoiced for the customer
- •Calculating the number of invoices that include the given order of the given customer
- •Calculating the amount of the order, if invoiced
- •Conclusions
- •Chapter 4. Working with date and time
- •Creating a date dimension
- •Understanding automatic time dimensions
- •Automatic time grouping in Excel
- •Automatic time grouping in Power BI Desktop
- •Using multiple date dimensions
- •Handling date and time
- •Time-intelligence calculations
- •Handling fiscal calendars
- •Computing with working days
- •Working days in a single country or region
- •Working with multiple countries or regions
- •Handling special periods of the year
- •Using non-overlapping periods
- •Periods relative to today
- •Using overlapping periods
- •Working with weekly calendars
- •Conclusions
- •Chapter 5. Tracking historical attributes
- •Introducing slowly changing dimensions
- •Using slowly changing dimensions
- •Loading slowly changing dimensions
- •Fixing granularity in the dimension
- •Fixing granularity in the fact table
- •Rapidly changing dimensions
- •Choosing the right modeling technique
- •Conclusions
- •Chapter 6. Using snapshots
- •Using data that you cannot aggregate over time
- •Aggregating snapshots
- •Understanding derived snapshots
- •Understanding the transition matrix
- •Conclusions
- •Chapter 7. Analyzing date and time intervals
- •Introduction to temporal data
- •Aggregating with simple intervals
- •Intervals crossing dates
- •Modeling working shifts and time shifting
- •Analyzing active events
- •Mixing different durations
- •Conclusions
- •Chapter 8. Many-to-many relationships
- •Introducing many-to-many relationships
- •Understanding the bidirectional pattern
- •Understanding non-additivity
- •Cascading many-to-many
- •Temporal many-to-many
- •Reallocating factors and percentages
- •Materializing many-to-many
- •Using the fact tables as a bridge
- •Performance considerations
- •Conclusions
- •Chapter 9. Working with different granularity
- •Introduction to granularity
- •Relationships at different granularity
- •Analyzing budget data
- •Using DAX code to move filters
- •Filtering through relationships
- •Hiding values at the wrong granularity
- •Allocating values at a higher granularity
- •Conclusions
- •Chapter 10. Segmentation data models
- •Computing multiple-column relationships
- •Computing static segmentation
- •Using dynamic segmentation
- •Understanding the power of calculated columns: ABC analysis
- •Conclusions
- •Chapter 11. Working with multiple currencies
- •Understanding different scenarios
- •Multiple source currencies, single reporting currency
- •Single source currency, multiple reporting currencies
- •Multiple source currencies, multiple reporting currencies
- •Conclusions
- •Appendix A. Data modeling 101
- •Tables
- •Data types
- •Relationships
- •Filtering and cross-filtering
- •Different types of models
- •Star schema
- •Snowflake schema
- •Models with bridge tables
- •Measures and additivity
- •Additive measures
- •Non-additive measures
- •Semi-additive measures
- •Index
- •Code Snippets
many relationship.
Measures and additivity
When you define a measure, an important concept is whether the measure is additive or not against a specific dimension.
Additive measures
A measure is said to be additive when it aggregates by using a simple sum. For example, the amount sold is additive against products, meaning that the total sold results from the sum of sales of individual products. As another example, Sales is additive against all dimensions because the total sold over a year results from the sum of the sales of individual days.
Non-additive measures
There is another category of calculations that is known as non-additive. Distinct count, for example, is a non-additive calculation. If you perform a distinct count of the product sold, then the distinct count over one year is not the sum of the distinct counts over individual months. The same applies to customers, countries, and any other dimension (apart from the product). Whenever you need to compute a nonadditive measure, you must perform a full scan of the table for each level of the hierarchy that you are browsing because you cannot aggregate values from their children.
Semi-additive measures
The third category of calculations is semi-additive. Semi-additive measures are the most complex measures because they are additive against some dimensions and non-additive against others. Typically, the dimension that acts as an exception is time. For example, a Year-to-Date calculation is non-additive because the value you show for one month (for example, March) is not the sum of the individual days. Instead it is the value of the last day of the month. Figure A-15 shows an example of these three kinds of measures.
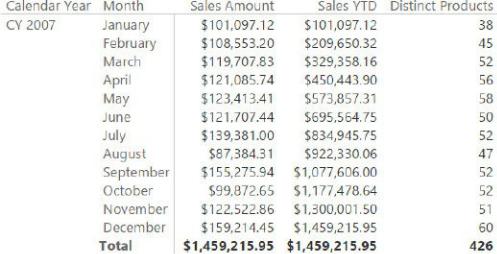
Figure A-15 The report shows the three types of additivity: additive, semiadditive, and nonadditive.
DAX offers a set of functions to handle semi-additivity over time. Functions like DATESYTD, TOTALYTD, LASTDATE, and CLOSINGBALANCEQUARTER help you author semi-additive measures when time is the non-additive dimension. Handling semi-additivity over different dimensions requires more complex FILTER functions because there is no predefined function to handle nonadditivity on dimensions that are not related to time.