

RateToUsd = LOOKUPVALUE (
ExchangeRate[AverageRate], ExchangeRate[CurrencyKey], Sales[CurrencyKey], ExchangeRate[DateKey], CALCULATE (
MAX ( 'ExchangeRate'[DateKey] ), 'ExchangeRate'[DateKey] <= EARLIER ( Sales[O ExchangeRate[CurrencyKey] = EARLIER ( Sales[ ALL ( ExchangeRate )
)
)
With the new RateToUsd in place, the report shows meaningful values, as shown in Figure 11-6.
FIGURE 11-6 With the new calculated column, conversion happens smoothly for all the periods.
Single source currency, multiple reporting currencies
Now that you learned about converting multiple currencies into a single currency, we can go further and analyze a different scenario, where you have a single currency in the source data and you want to be able to produce reports in a different currency.
As with the previous scenario, you must make some decisions in this case, too. For example, if you collected an order in USD on the first of January 2005 and you prepare a report in December 2006, what exchange rate should you use? You can choose between the exchange rate that was active at the moment of the order
or the latest available exchange rate. The model, in both cases, is the same, even if the DAX code to compute the values is different. Thus, you have the option to develop both calculations in the same model. The model is shown in Figure 11-7.
FIGURE 11-7 This is the data model to convert a single currency in multiple reported currencies.
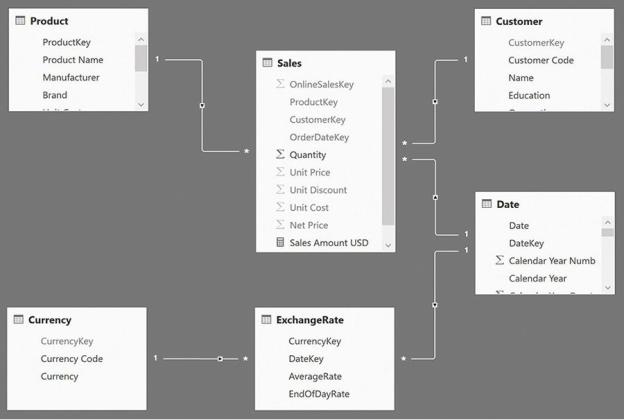
The model looks very similar to the one shown in Figure 11-1, but there are some important differences. First, there are no longer any relationships between Sales and Currency. This is because all the sales are now recorded in USD. (We decided to use this currency for this demo, but it might be any other currency.) Thus, the currency does not filter Sales. This time, the Currency table is used to define the reporting currency. In other words, even if the sales are stored in USD, by choosing a different currency, the user should be able to see the values in any other currency.
You want to compute the value in a dynamic way. That is, you want the user to be able to select the currency at report time. You cannot leverage on a calculated column, however. Instead you must author some more complex DAX code in a measure. The named measure needs to do the following:
1. Check that a single currency is selected to avoid the grand-total issue we
encountered in the previous section. As you might recall, the grand total for a report with multiple currencies is not accurate, and we do not want to display it.
2. Iterate on each date in the current selection; compute the value of sales and the currency rate for each date; and make the conversion in the desired currency. This iteration is necessary because the exchange rate changes every day. You cannot compute the conversion until you fix the day, which is what the iteration does.
The second point is further complicated by the fact that, on some days, the exchange rate might not be available. Thus, you will need to search for the latest exchange rate every day. Most of the time, this process will lead you to the exchange rate of that day. On some days, however, you will need to use a prior date. The following code, although somewhat complex, accomplishes all these steps:
Click here to view code image
Sales Converted = IF (
HASONEVALUE ( 'Currency'[Currency] ), SUMX (
VALUES ( 'Date'[Date] ),
VAR CurrentDate = 'Date'[Date] VAR LastDateAvailable =
CALCULATE (
MAX ( 'ExchangeRate'[DateKey] ), 'ExchangeRate'[DateKey] <= CurrentDa ALL ( 'Date' )
)
VAR Rate = CALCULATE (
VALUES ( ExchangeRate[AverageRate] )
ExchangeRate[DateKey] = LastDateAvai ALL ( 'Date' )
)
RETURN
[Sales Amount USD] * Rate
)
)
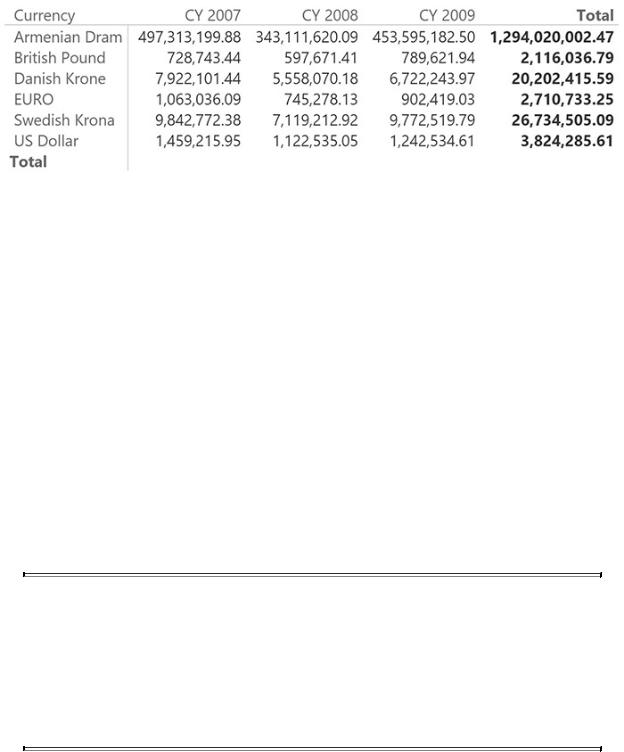
Using this measure, you can build reports that, starting from a single USD currency, generate results in many different currencies, as shown in Figure 11-8.
FIGURE 11-8 In this report, the value in the Currency column is the reporting currency. All orders are converted to the given currency.
Unfortunately, the formula is far from being simple and readable. This is problematic for several reasons, not least being the fact that you might need the same code snippet in other measures to (for example) convert the cost or the revenues in a similar way.
The most complex part is the search for the correct exchange rate. As is often the case, your best option here is to work at the data-model level. This time, instead of changing the model, you can build a new ExchangeRate table that provides an exchange rate for any date in the Sales table by searching for the latest exchange rate for that date, the same way you do in the measure. In doing so, you do not completely remove the complexity from the model. Instead you isolate the complexity in a calculated table to be able to use it whenever needed. In addition, isolating this calculation in a calculated table greatly improves the measure behavior because the slow process in the formula is the search for the correct exchange rate.
 Note
Note
This option is available only if you are working with SQL Server Analysis Services 2016 or Power BI because it makes use of calculated tables. If you are using a version of DAX that does not support calculated tables, then you need to perform a similar operation in the ETL process.
The following code generates the ExchangeRateFull table, which contains the exchange rate for every pair of date and currency:
Click here to view code image
ExchangeRateFull = ADDCOLUMNS (
CROSSJOIN ( SELECTCOLUMNS (
CALCULATETABLE ( DISTINCT ( 'Date'[Date] "DateKey", 'Date'[Date]
),
CALCULATETABLE ( DISTINCT ( Currency[Currenc
),
"AverageRate",
VAR CurrentDate = [DateKey]
VAR CurrentCurrency = [CurrencyKey] VAR LastDateAvailable =
CALCULATE (
MAX ( 'ExchangeRate'[DateKey] ), 'ExchangeRate'[DateKey] <= CurrentDate, ALLNOBLANKROW ( ExchangeRate[DateKey] )
)
RETURN CALCULATE (
DISTINCT ( ExchangeRate[AverageRate] ), ExchangeRate[CurrencyKey] = CurrentCurre ExchangeRate[DateKey] = LastDateAvailabl
)
)
With this new calculated table in place, the model is very similar to the previous one, as shown in Figure 11-9.
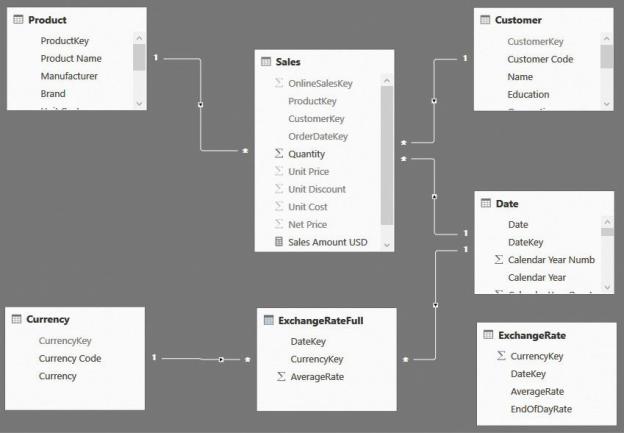
FIGURE 11-9 The new ExchangeRateFull table took the place of the previous ExchangeRate table.
Moreover, the code of the measure becomes much simpler to write, as you can see in the following measure definition:
Click here to view code image
Sales Converted = IF (
HASONEVALUE ( 'Currency'[Currency] ), SUMX (
VALUES ( 'Date'[Date] ),
[Sales Amount USD] * CALCULATE ( VALUES ( Ex
)
)
As mentioned, the complexity is not gone. We only moved it into a calculated table, thus isolating it from the measures. The advantage of this approach is that you will spend less time debugging and writing the measures (and you might have