

plenty of them). Moreover, because the calculated table is computed at data refresh time and stored in the model, the overall performance will be much better.
In this case, we simplified the code not by changing the model structure; the last model is identical to the previous one. Instead, we changed the content of the table, which forced the relationship to be at the correct granularity.
Multiple source currencies, multiple reporting currencies
If your model stores orders in multiple currencies and you want to be able to report in any currency, then you face the most complex scenario. In reality, however, it is not much more complex than the one with multiple reporting currencies. This is because, as you might expect, complexity comes from the need to perform a currency conversion at query time by using measures and precomputed tables. Moreover, in the case of multiple currencies on both sides (storage and reporting), the exchange rate table needs to contain many more rows (one row for each pair of currencies for every day), or you will need to compute the exchange rate in a dynamic way.
Let us start by looking at the data model shown in Figure 11-10.
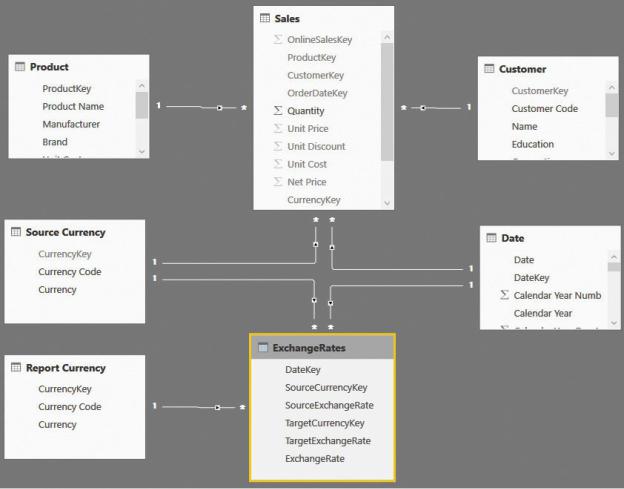
FIGURE 11-10 The data model includes multiple source and target currencies.
Note the following things about this model:
 There are two currency tables: Source Currency and Report Currency. Source Currency is used to slice the currency that records the sales, whereas Report Currency is used to slice the currency used in the report.
 The ExchangeRates table now contains both the source and the target currency because it lets you convert any currency into any other currency. It is worth noting that the ExchangeRates table can be computed (through DAX code) from the original table that converted every currency to USD.
The following code generates the ExchangeRates table:
Click here to view code image
ExchangeRates = SELECTCOLUMNS (
GENERATE (
ExchangeRateFull,
VAR SourceCurrencyKey = ExchangeRateFull VAR SourceDateKey = ExchangeRateFull[Dat VAR SourceAverageRate = ExchangeRateFull RETURN
SELECTCOLUMNS ( CALCULATETABLE (
ExchangeRateFull, ExchangeRateFull[DateKey] = ALL ( ExchangeRateFull )
),
"TargetCurrencyKey", ExchangeRat
"TargetExchangeRate", ExchangeRa
)
),
"DateKey", ExchangeRateFull[DateKey], "SourceCurrencyKey", ExchangeRateFull[Curren "SourceExchangeRate", ExchangeRateFull[Avera "TargetCurrencyKey", [TargetCurrencyKey], "TargetExchangeRate", [TargetExchangeRate], "ExchangeRate", ExchangeRateFull[AverageRate
)
This basically performs a cross-join of the ExchangeRateFull table with itself. First, it gathers the exchange rate to USD of both currencies, on the same date. Then it multiplies the exchange rates to obtain the correct exchange rate of any currency with any other one.
This table is much larger than the original one (we grew from 25,166 rows in ExchangeRateFull to 624,133 rows in the final table), but it lets us create relationships in an easy way. The code can be written even without the creation of this table, but it is utterly complicated.
When it comes to writing the code that computes the amount sold, you basically mix the two previous scenarios into a single one. You must slice sales by date and currency to obtain a set of sales that share the same exchange rate. Then you need to search, in a dynamic way, for the current exchange rate, taking into account the selected report currency, as in the following expression:
Click here to view code image
Sales Amount Converted =
IF (
HASONEVALUE ( 'Report Currency'[Currency] ), SUMX (
SUMMARIZE ( Sales, 'Date'[Date], 'Source Cur [Sales Amount] * CALCULATE ( VALUES ( Exchan
)
)
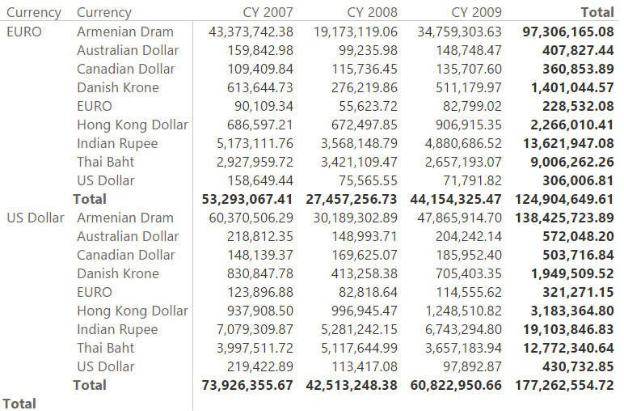
Using this model, you can, for example, report orders in different currencies in both EUR and USD with a currency conversion on the fly. In the report shown in Figure 11-11, for example, currency conversion happens at the date of the order.
FIGURE 11-11 The values are converted in EUR and USD from the original currency.
Conclusions
Currency conversion requires models of increasing complexity depending on the requirements. The following main points were made in this chapter:
 You can achieve simple conversion from multiple currencies to a single currency (or a very small number of different currencies) through simple
calculated columns.
 Converting to multiple reporting currencies requires a bit more complex DAX code and some adjustments on the data model because you can no longer leverage a calculated column. The conversion needs to happen in a more dynamic way.
 The dynamic conversion code can be made simpler by ensuring that the exchange rate table contains all the needed dates, which you can achieve by using a simple calculated table.
 The most complex scenario is when you have multiple source currencies and multiple reporting currencies. In that case, you need to mix the previous techniques and create two currency tables: one for the source currency and another for the reporting currency.