

You can slice sales either by the current manager or by the historical one. As expected, the numbers show different figures. For example, you can easily see a dramatic drop in sales for the country that is currently managed by Raoul. In 2007, when it was in the hands of Louise, North America performed much better.
Slicing by the current manager might be useful to understand the potential of the customers that are managed by a sales person. And you slice by the historical attribute to evaluate the sales person’s performances over time. In the report, we show both the historical and the current attribute, enabling you to evaluate how sales performed with the different managers.
Using current and historical attributes, you can generate extremely powerful reports. However, they may be visually difficult to read. To mitigate this, it is important to spend time formatting the values and to carefully choose the columns to include in the report. A careful description of the meaning of the numbers also helps.
In these first introductory pages, we have discussed some of the most important considerations about SCDs:
 Both the current and the historical value are important. You will use both, depending on what kind of insight you want to retrieve by querying the model. A good implementation of an SCD should keep both the historical and the current value for each record.
 While the term is slowly changing dimensions, the dimensions themselves do not actually change. Rather, it is one or more of the attributes of the dimensions that change.
Now that you have seen the relevance of handling historical variation and the complexity that comes with using an SCD in a report, it is time to start working on the different kinds of data models you need to build to gracefully handle SCDs.
Using slowly changing dimensions
Having shown you what SCDs are, we will now discuss some considerations with regard to their use. Whenever you use an SCD, some of the calculations become more complex. With standard dimensions, each entity is stored in a row of its table. For example, a customer is always a single line in the customer table. Yet if Customer is instead handled as an SCD, a single customer might be represented with multiple lines in its table if there are multiple versions of him or her. The simple one-to-one relationship of single customer to single row no longer holds. Simple operations, like counting the number of customers, become more complex.
In the example we outlined earlier, we decided to store the country manager as
one attribute of the customer. As a result, there will be multiple versions of the same customer, depending on how many different managers that customer had over time. In fact, in the sample database we use for this book, there are 18,869 customers, but the number of rows in the Customer table is 43,882 due to changes in the managers over time. If you define a simple measure to count customers, as in the following code, the result would be incorrect:
Click here to view code image
NumOfCustomers = COUNTROWS ( Customer )
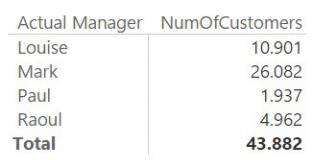
You can see this incorrect result in Figure 5-7, which shows the number of customers sliced by the actual manager.
FIGURE 5-7 Counting the rows does not correctly count the customers, if you are counting from an SCD.
The report is showing the number of versions of customers, which is clearly not the actual number of customers. To correctly count the number of customers, you need to perform a distinct count of the customer codes. Use the following code:
Click here to view code image
NumOfCustomers := DISTINCTCOUNT ( Customer[Customer
Code] )
Using DISTINCTCOUNT, the numbers are now reported in the correct way, as shown in Figure 5-8.
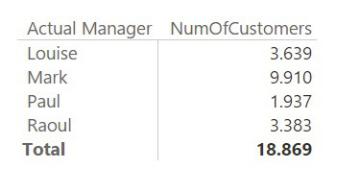
FIGURE 5-8 With DISTINCTCOUNT, the numbers reflect only the unique customer codes and give the correct amounts.
If you want to slice by one of the attributes of the customer, replacing COUNTROWS with DISTINCTCOUNT is a good solution. The issue becomes more complex if you want to slice by a different attribute that does not belong to the customer dimension. One very common calculation is the number of customers who bought some category of products. If you are using a standard customer dimension, and not a slowly changing one, then you can obtain this number by simply performing a distinct count of the customer key in the fact table. In our example, the code would be as follows:
Click here to view code image
NumOfBuyingCustomers := DISTINCTCOUNT (
Sales[CustomerKey] )
If you use this in the model with an SCD, you get a result that appears reasonable but is still incorrect. The result is shown in Figure 5-9.
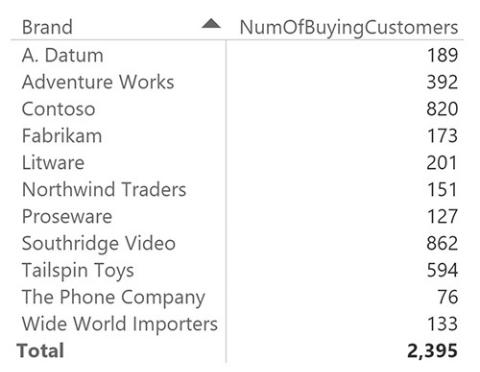
FIGURE 5-9 The number of buying customers, computed using DISTINCTCOUNT, appears correct but it is wrong.
By computing the distinct count of the customer keys, you compute the number of distinct versions of the customer, not the real number of customers. If you need to count the correct value, you must count the number of customer codes in Customer by using a bidirectional pattern. You can do this by either marking the relationship between Customer and Sales as bidirectional, or by modifying the code using the following pattern:
Click here to view code image
NumOfBuyingCustomersCorrect := CALCULATE (
DISTINCTCOUNT ( Customers[Customer Code] ), Sales
)
Figure 5-10 shows the same report as Figure 5-9, but with the new measure. Most of the numbers are identical, and the ones that are different are still somewhat similar. This shows how easy it is to get fooled by the wrong calculation.
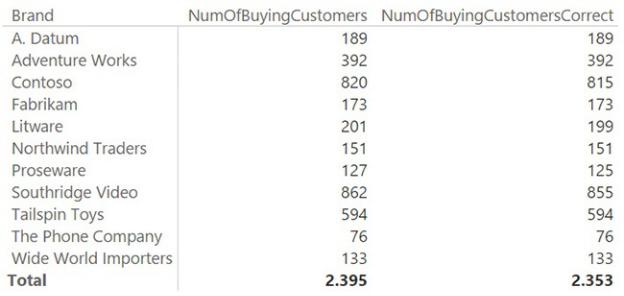
FIGURE 5-10 The two measures side by side show the small difference between the correct and incorrect calculation.
You might have noticed that we used the bidirectional pattern with the Sales table as a filter instead of the way it’s been used more frequently in this book, which involves creating a bidirectional relationship between Sales and Customer. If you only use the bidirectional filtering of the relationship between Sales and Customer here, the grand total will not be correct. In fact, if you write the measure using the following code, the grand total (shown in Figure 5-11) will count all the customers, not only the ones who bought something:
Click here to view code image
NumOfBuyingCustomersCorrectCrossFilter := CALCULATE (
DISTINCTCOUNT ( Customer[Customer Code] ), CROSSFILTER ( Sales[CustomerKey], Customer[Custo
)