

Chapter 5. Tracking historical attributes
Data changes over time. For some models and reports, it is useful to track both the current and the historical value of some attributes. For example, you might need to track the different addresses of a customer over time. Or, you might have a product that changes some specifications, and you want to perform an analysis of the sales and performance with the different characteristics. Or, you may want to track the total sales at different price points if there is a change in the price of a product or service. All these are very common scenarios, and there are some standard ways of handling them.
Whenever it is necessary to manage the changing nature of a value, it becomes a matter of dealing with historical attributes—or, in more technical language, slowly changing dimensions. Slowly changing dimensions are not a difficult topic, but they come with some hidden complexity.
In this chapter, we analyze several models that show why this is an important aspect to consider when building your reporting system. The models also show how to manage different scenarios.
Introducing slowly changing dimensions
You typically need to track attributes of dimensions. For example, you might need to know a customer’s previous addresses so you can analyze his or her purchases in both the old and new locations. Or, you might need to know the previous producer of some part of your products to analyze their quality and reliability. Because these attributes belong to dimensions, and they typically change slowly over time, they are known as slowly changing dimensions (SCDs).
Before diving into more technical details, let us discuss briefly when and why you need to use an SCD. Imagine that each of your customers has a sales person assigned to him. The easiest way to store this information is to add the sales manager‘s name as an attribute of the customer. Over time, this relationship between sales manager and customer can change, such as when an existing customer is assigned to a different sales person. For example, a customer (Nicholas) might have had Paul as a sales manager until last year, but then it changed to Louise. If you simply update the sales manager’s name in the Customer table, then when you analyze the sales of Louise, it will look like Louise is responsible for all the sales, including those that Paul made in the past. Thus, the figures will not be correct. You need a data model that correctly assigns sales to
the manager who oversaw them at the time when the sales happened.
Depending on how you handle variations, SCDs are classified in different categories. Professionals have not yet come to a consensus on a unique taxonomy for the different ways to handle SCDs. Apart from the very basic scenarios, more complex kinds of variations typically require some creativity in their handling, and when somebody finds a new way to handle an SCD, he or she often creates a new name for it. When it comes to naming things, data modelers love to find new names for everything.
In this book, we will try to avoid further confusion on the topic by sticking with the original definition of SCDs:
 Type 1 In type 1 SCDs, the value stored in a dimension is always the current one. If you discover that something changed during the processing of your model, you simply overwrite the old value with the new one. You store only the last value of any column. Therefore, because you do not actually track any variations, type 1 SCDs are not really SCDs.
 Type 2 Type 2 SCDs are real SCDs. With type 2 SCDs, you store the information multiple times, once for each version. If, for example, a customer changes his or her address, then you will store two rows for that customer: one with the old address and one with the new address. The rows in the fact table will point to the right version of the customer. If you slice by customer name, for example, you will see only one row. If, on the other hand, you slice by country, the numbers will be assigned to the country where the customer lived at the time of the event.
 Note
Note
Type 1 SCDs are extremely simple. They do not track any historical information. For this reason, we will discuss only type 2 SCDs in this chapter and refer to type 2 simply as SCD.
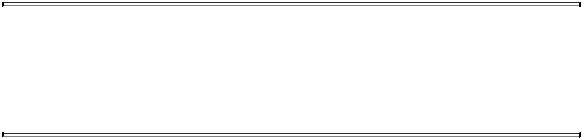
As an example of SCDs, let us consider the scenario with the changing sales manager discussed earlier and see how it is handled in the Contoso database. In Contoso, there are multiple country managers. One manager can handle multiple countries, and the information is stored in a table containing two columns, CountryRegion and Manager, as shown in Figure 5-1.
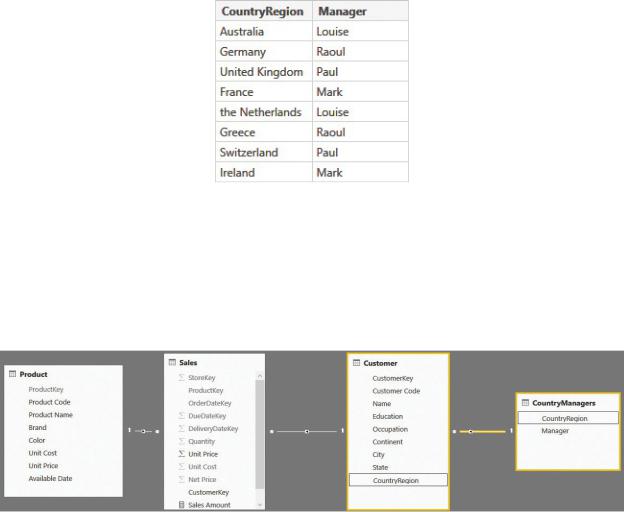
FIGURE 5-1 The CountryManagers table contains the relationship between a country or region and its manager.
With this table, it is easy to set up the model. You can create a relationship between CountryRegion in the Customer table and CountryRegion in the CountryManagers table. With the relationship in place, you obtain the model shown in Figure 5-2.
FIGURE 5-2 You can create a relationship between the Customer and CountryManagers tables.
When the model is finished, you can build a report that shows the sales by manager and continent, as shown in Figure 5-3.
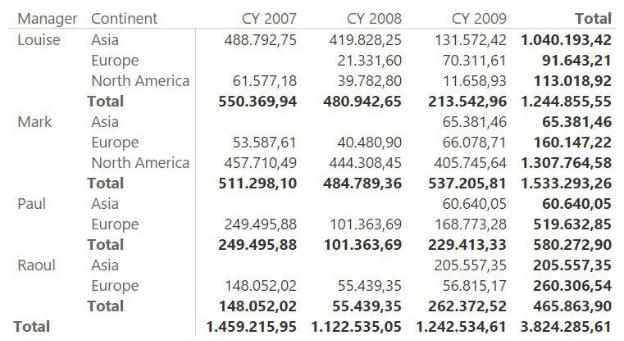
FIGURE 5-3 This report shows the sales divided by manager and continent.
Although the managers of the countries have changed over time, the model we are using right now is not correctly handling this information. For example, Louise oversaw the United States in 2007, in 2008 it was Paul’s responsibility, and in 2009 it became Mark’s job. But the report shows the sales in these different years as if they were all generated by Mark because he is the last listed manager of the country.
Suppose the CountryManagers table, instead of relating the manager to the country, were to make this relationship dependent on time, as shown in Figure 5-4.
FIGURE 5-4 The manager of United States changed over time, as shown in this table.
Each line now stores the start and end year of the relationship. With this new information, you can no longer use the CountryRegion column to create the relationship between customers and managers because CountryRegion is no longer a key in the CountryManagers table. Now the same country or region can appear multiple times, once for each of the managers who was assigned to it.
The scenario suddenly becomes much more complex, but there are multiple ways to manage this. In this chapter, we will show a few of them that help in building an analytical report that can track who the manager was at the time of the sale. Imagine the model has already been created by the IT department managing the data warehouse and submitted to you. If done correctly, the Customer table you receive will contain the following two columns:
 Historical Manager This is the manager of the customer when the event (sale) happened.
 Current Manager This is the current manager of the customer, no matter who was handling the customer at the time of the event.
With this data structure in place, you can create analytical reports like the one shown in Figure 5-5 that report the sales with the historical manager instead of the current one.
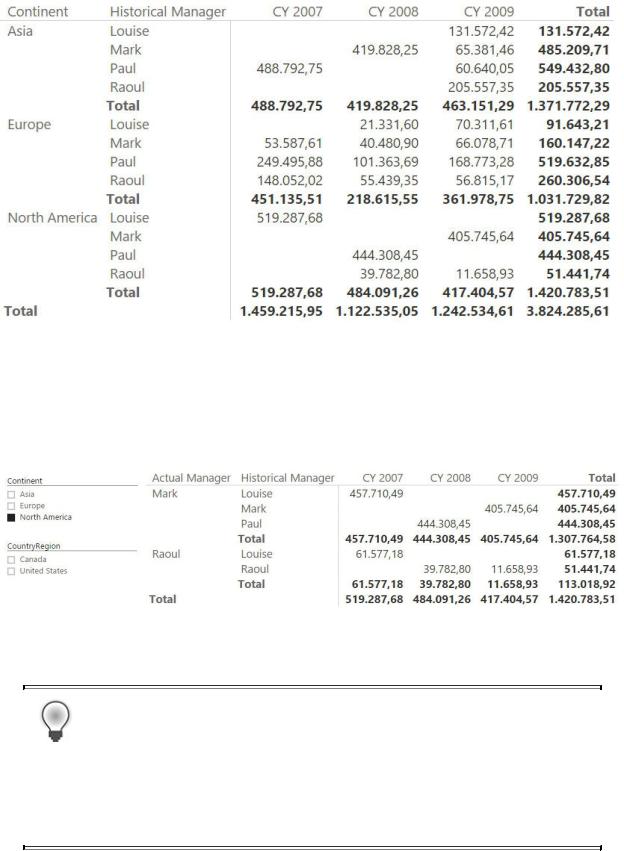
FIGURE 5-5 The sales sliced by historical manager correctly assigns North America to Louise in 2007.
Moreover, you can build reports that show both the current and the historical manager at the same time, as shown in Figure 5-6. This report shows the sales in North America (USA and Canada), with the actual manager and the historical one.
FIGURE 5-6 Using actual and historical attributes, you can produce very detailed reports.
Tip
Using SCDs in reports is not easy. We suggest you look carefully at the previous figures and get a sense of the data you are reading to better understand the numbers that are assigned to the current and historical attributes.