

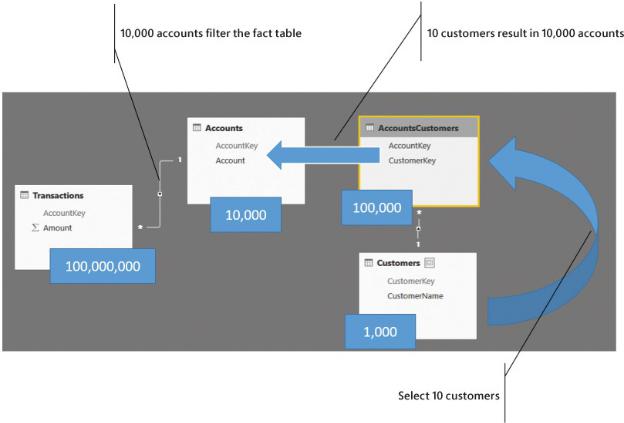
FIGURE 8-23 If the number of accounts filtered is large, performance starts to suffer.
In short, the higher the selectivity of the bridge table, the better the performance. Typically, because bridge tables tend to have a normal selectivity, this translates to a simpler statement: The larger the bridge table, the worse the performance. It is somewhat incorrect to state it this way, but we also understand that it is much easier to remember and apply, and to some extent, it gives you the correct figures.
In our experience, bridge tables up to 1,000,000 rows work just fine, but larger bridge tables require much more attention and some effort in trying to reduce their size. The point to remember here is to not spend time reducing the size of the fact table. Instead, try to work on the bridge table and reduce its size. This will guide you in the right direction in optimizing the many-to-many behavior.
Conclusions
You must learn how to take advantage of many-to-many relationships because they provide incredible power of analysis. That said, learning how to use this type of relationship means understanding the limitations and complexity, both in terms of DAX code and ease of use. Review the following highlights:
 You can manage many-to-many relationships using three main patterns: bidirectional relationships, CROSSFILTER, or table expansion. The choice depends on the version of DAX you are using and the results you want to obtain.
 Basic many-to-many does not require much effort. Once you understand its non-additivity nature and how to set the relationships the correct way, it works just fine.
 Cascading many-to-many relationships and filtered many-to-many relationships are a bit more complex in their handling, especially if you rely on table expansion. In that case, flattening them all in a single bridge might help you write easier code.
 Temporal many-to-many and many-to-many with reallocation factors are complex by their nature. They are powerful but hard to manage.
 If you need to handle very complex many-to-many relationships, your best choice might be to remove the many-to-many altogether. By materializing the relationship in the fact table, you can nearly always get rid of many-to-many relationships, even if this requires you to carefully study the new fact table, increase its number of rows, and probably revise some of the code you wrote earlier.
 When thinking about performance, reducing the size of the bridge is your first goal. You reduce the bridge to increase its selectivity. If your bridge is large, but highly selective when you use it, then you are already on the fast track of DAX.