

John Wiley & Sons - 2004 - Analysis of Genes and Genomes
.pdf148 |
VECTORS 3 |
|
|
The recombinant PACs are maintained as plasmids within the E. coli using kanamycin resistance as a selection marker. Plasmid copy number can be increased more than 25-fold by isopropyl β-D-thiogalactopyranoside (IPTG) induction of a lac promoter controlled high-copy P1 lytic replicon that is present within the recombinant PAC (Pierce et al., 1992). The recombinant DNA molecules are then isolated as plasmids using traditional methods.
Using the P1 DNA packaging system, genomic DNA from 70 to 95 kb can be readily cloned and manipulated. Improvements in vector design have allowed the production of PACs that can accommodate 130 –150 kbp inserts. The major advantages of the P1 DNA packaging method over other genomic cloning methods are
•the large size of the DNA fragments that may be inserted into the vectors,
•no rearrangement or deletion of methylated DNA occurs because of the use of restriction-minus host strains and
•recombinant DNA is easily recovered as plasmids for further screening and manipulation.
3.7.3BACs
Bacterial artificial chromosomes (BACs) are engineered versions of F plasmids (Shizuya et al., 1992). BACs are capable of carrying approximately 200 kbp of inserted DNA sequence, and the F-factor origin of replication (oriS) maintains their level at approximately one copy per cell. In addition to oriS, BACs contain four F-factor genes required for replication and maintenance of copy number, repE, parA, parB and parC. The overall architecture of a typical BAC is shown in Figure 3.20.
In addition to the F-factor genes, pBeloBac11 also contains a selectable antibiotic resistance maker (CAMR) and the lacZ gene harbouring a multiple cloning site for the blue – white screening of BACs containing inserts (Kim et al., 1996b). Additionally, the BAC contains a λ cos site (cosN) and a loxP site. These sites are used for specific cleavage of the insert containing BAC during restriction mapping. The cosN site can be cleaved using λ terminase (Rackwitz et al., 1985), while the loxP site can be cleaved by the Cre protein in the presence of an oligonucleotide to the loxP sequence (Abremski, Hoess and Stanbers, 1983). Additional BACs have been constructed that contain the recognition sites for extremely rare-cutting restriction enzymes. For example, I-SceI is an intron encoded restriction enzyme from the mitochondria of the

3.7 ARTIFICIAL CHROMOSOMES |
149 |
|
|
|
BamHI SalI |
HindIII |
loxP |
lacZ′ |
CAMR |
cos
pBeloBAC11 |
ori S |
7.4 kbp |
|
par C
repE
par B
parA
Figure 3.20. The structure of a BAC vector. See the text for details
yeast Saccharomyces cerevisiae (Monteilhet et al., 1990). Its large recognition sequence (5 -TAGGGATAACAGGGTAAT-3 ) does not occur once in the human genome, and is consequently very useful for linearizing the vector without cleaving the insert DNA fragments.
The DNA inserted into a BAC appears to be very stable. It can survive intact for many hundreds of generations in E. coli cells, and appears to be less prone to rearrangements and deletions when maintained in a recombination defective E. coli host cell. The main drawback of using BAC vectors is that they are present in only one or two copies per cell. This can complicate isolation and screening.
3.7.4HACs
Human artificial chromosomes (HACs) have been constructed that can survive for extended periods in tissue culture cells (Harrington et al., 1997) (Figure 3.21). As we have already seen, three elements are required for the
stability of linear chromosomes – centromeres, telomeres and an origin of replication. The human telomere repeat sequence (5 -TTAGGG-3 ) is well known, but it is distinct from its yeast equivalent and the two are not interchangeable. A YAC will not function as a chromosome in human cells. To aid in the isolation of human centromere and replication origin sequences, HACs have been constructed that can be transfected into and maintained within

150 |
VECTORS 3 |
|
|
Figure 3.21. A human artificial chromosome in tissue culture cells. A synthetic α satellite containing microchromosome formed by transfection of α satellite DNA and telomeric sequences into tissue culture cells. A clonal line was isolated and shown to contain a HAC (denoted by the arrow) derived from transfected DNA and not from truncation of endogenous chromosomes. Reprinted, with permission, from Willard (2000). Copyright (2000) American Association for the Advancement of Science
human cells (Henning et al., 1999). This approach identified multiple repeats of a 171 bp DNA sequence (called an α satellite repeat) contained within a 3 million base pair DNA fragment of the human X chromosome that functions as a centromere (Schueler et al., 2001). The repetitive nature of these sequences makes them difficult to study and makes the identification of the centromere itself extremely hard.
The human genome contains multiple origins of replication. The average human chromosome contains approximately 150 × 106 bp of DNA, while DNA polymerase functions maximally at about 3000 replicated bases per minute. Were replication to begin at a single site, each chromosome would take over a month to be replicated, rather than the hour it actually takes. Multiple replication origins mean that there are many places on the eukaryotic chromosome where replication can begin and that the process of complete replication proceeds at a more rapid rate. The sequence of the human replication origin is very degenerate (Vashee et al., 2001), but the development of HACs should allow a more precise mapping of these regions.
3.7 ARTIFICIAL CHROMOSOMES |
151 |
|
|
HACs have great potential as tools for both basic research and medical therapy. Artificial chromosomes may ultimately lead to gene therapy vectors (see Chapter 13) with some advantages over existing viral based vectors.
•They exist as extrachromsomal elements and so would not result in insertional mutagenesis.
•They should have no size constraint on the amount on DNA that they could carry.
•By virtue of differences between centromere behaviour in mitosis and meiosis, they might be designed not to function in the germ line.
These possibilities remain for the future and will depend on having a much greater understanding of chromosome function than is currently available.


154 |
POLYMERASE CHAIN REACTION 4 |
|
|
5′ |
|
3′ |
3′ |
Denature |
5′ |
|
|
|
5′ |
|
3′ |
3′ |
|
5′ |
|
Anneal primers |
|
5′ |
|
3′ |
|
3′ |
5′ |
5′ |
3′ |
|
3′ |
|
5′ |
|
Extend using |
|
|
DNA polymerase |
|
5′ |
|
3′ |
5′ |
|
5′ |
|
|
|
3′ |
|
5′ |
5′ |
|
3′ |
3′ |
|
5′ |
5′ |
|
3′ |
3′ |
|
5′ |
Repeat
Figure 4.1. The steps of a PCR experiment. The two DNA strands of the target DNA molecule, shown in red and blue to differentiate them, are denatured, or separated, by heating. The boxed regions depict unique sequences within the target DNA to which the oligonucleotide primers will bind. Once the strands are separated, they are then cooled in the presence of oligonucleotides that are complementary to each strand. This results in the annealing of the oligonucleotides to their complementary DNA sequence. The oligonucleotides are designed such that their 3 -ends face each other. The oligonucleotides are then extended using DNA polymerase in the presence of the four deoxynucleotide triphosphates. This cycle of denaturing, annealing and extension is repeated 20–30 times to result in a massive amplification of the DNA in between the two oligonucleotide binding sites
(say, the sense strand), while the other primer is the same sequence as the other DNA strand (the antisense strand). The sense strand primer will bind, through complementary base pairing interactions, to the antisense strand and will initiate DNA synthesis of a new sense strand. Similarly, the antisense primer will bind to the sense strand of the DNA and will initiate the synthesis of a new antisense strand. The PCR reaction is split into three separate stages, each of which is performed at a different temperature (Figure 4.1). The cycle of
POLYMERASE CHAIN REACTION |
155 |
|
|
denaturation –annealing–extension is repeated 20 –30 times in order to achieve satisfactory amplification of a specific DNA sequence. The three steps in each PCR cycle are the following.
•Denaturation. The two strands of the target DNA molecule are separated into its component strands by heating. As we have seen in Chapter 1, DNA
can be reversibly denatured by a cycle of heating and cooling. This step is most often performed at 94 ◦C.
•Annealing. The two target strands are then allowed to cool in the presence of the oligonucleotide primers. One of the primers recognizes and binds to
one of the target DNA strands, and the other primer recognizes and binds to the other strand. The primers are designed such that the free 3 -end of each primer faces the other one, and so DNA synthesis proceeds on both strands through the region between the two primers. The temperature at which annealing of the primers to the template DNA occurs depends upon the length and sequence of the primer, and the level of specificity required in
a particular PCR reaction – in much the same way as we saw for Southern blotting in Chapter 2. Typically a temperature in the range of 45 –60 ◦C would be chosen.
•Extension. A DNA polymerase binds to the free 3 -end of each of the
bound oligonucleotides and uses dNTPs to synthesize a new DNA strand in a 5 to 3 direction. The first PCR experiments utilized the Klenow fragment of DNA polymerase I as the replication enzyme but, because of the heat denaturation step, fresh enzyme had to be added to during each cycle. The breakthrough came with the introduction of Taq DNA polymerase from the thermophilic bacterium Thermus aquaticus (Lawyer
et al., 1989). Taq DNA polymerase is resistant to high temperatures – it can withstand the 94 ◦C denaturing step and still retain full activity. This means that the enzyme does not need to be replenished during the PCR reaction, and that the heating and cooling cycles required for PCR to proceed can be fully automated in specially designed heating blocks. Fur-
thermore, Taq DNA polymerase has a temperature optimum for DNA replication of 72 ◦C. The high temperature at which the extension reaction can be performed means that the specificity of primer annealing is not compromised.
After one round of PCR replication, a newly synthesized copy of each DNA strand is produced, as illustrated in Figure 4.1. The site of initiation of DNA synthesis is dictated by the binding of the oligonucleotide primers to the template DNA. Specific hybridization, through base pair hydrogen bonding, will
156 |
POLYMERASE CHAIN REACTION 4 |
|
|
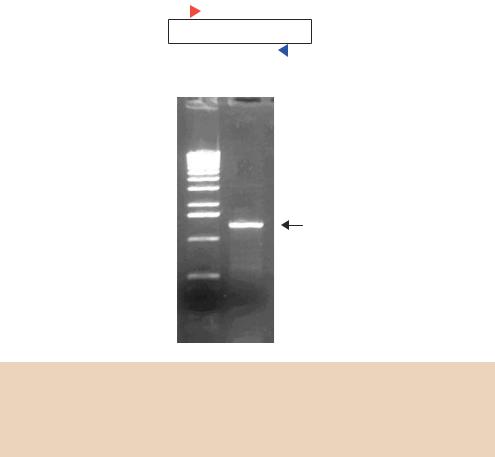
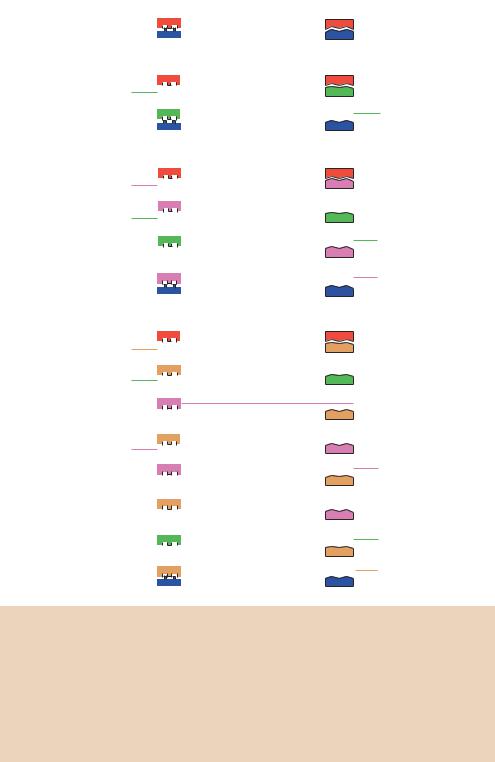
precisely position each oligonucleotide to sequences that are complementary on the template strand. What is not so obvious, however, is how DNA synthesis is terminated. If we inspect the results of a typical specific PCR reaction on an agarose gel (Figure 4.2), we see that a single, discrete band is formed. This suggests that the DNA fragments produced are homogenous and that they begin and end at the same point. To understand how this can occur, we need to look at the DNA fragments produced during several cycles of PCR (Figure 4.3).
During the first PCR cycle, the two target DNA strands are separated and DNA replication initiates at the point of primer binding. The two newly synthesized DNA strands at the end of cycle 1 (shown in green in Figure 4.3) will each have defined 5 -ends, as dictated by the site of primer binding, but ill defined 3 -ends. DNA synthesis will not terminate at a specific point, but will only stop during the heat denaturation step of cycle 2. Each of the DNA strands present at the end of cycle 1 will proceed into the next cycle of PCR,
|
Primer 1 |
|
|
|
||||
5′ |
|
|
|
|
|
|
|
3′ |
|
|
|
|
|
|
|
||
3′ |
|
|
|
Gene |
|
|
|
5′ |
|
|
|
|
|
|
|
||
|
|
|
|
|
|
|
|
|
Primer 2
MPCR
PCR product
Figure 4.2. PCR amplification of a gene from genomic DNA. Two oligonucleotide primers were designed to flank the gene in the human genome. A PCR reaction was performed for 25 cycles, and one-10th of the total reaction was run on an agarose gel adjacent to a series of DNA size standards (M). The gel was stained with ethidium bromide and photographed under UV light
|
|
|
|
|
|
|
|
|
|
|
|
|
|
|
|
|
POLYMERASE CHAIN REACTION |
157 |
||||||||
|
|
|
|
|
|
|
|
|
|
|
|
|
|
|
|
|
|
|
|
|
|
|
|
|
|
|
5′ |
|
|
|
|
|
|
|
|
|
|
|
|
|
|
|
Target DNA |
|
|
|
|
||||||
|
|
|
|
|
|
|
|
|
|
|
|
|
|
|
|
|
|
|
||||||||
|
|
|
|
|
|
|
|
|
|
|
|
|
|
|
|
|
|
|
3′ |
|
||||||
|
|
|
|
|
|
|
|
|
|
|
|
|
|
|
|
|
|
|
|
|
|
|
|
|||
|
|
|
|
|
|
|
|
|
|
|
|
|
|
|
|
|
|
|
|
|
|
|
|
|
||
|
|
|
|
|
|
|
|
|
|
|
|
|
|
|
|
|
|
|
|
|
|
|
|
|
||
|
|
|
|
|
|
|
|
|
|
|
|
|
|
|
|
|
|
|
|
|
|
|
|
|
||
3′ |
|
|
|
|
|
|
|
|
|
|
|
|
|
|
|
|
|
|
|
|
|
|
|
|
5′ |
|
|
|
|
|
|
|
|
|
|
|
|
|
|
|
|
|
|
|
|
|
|
|
|
|
|||
Cycle 1: |
|
|
|
|
|
|
|
|
|
|
|
|
||||||||||||||
5′ |
|
|
|
|
|
|
|
|
|
|
|
|
|
|
|
|
|
|
|
|
3′ |
|
||||
|
|
|
|
|
|
|
|
|
|
|
|
|
|
|
|
|
|
|
|
|
|
|
|
|
||
|
3′ |
|
|
|
|
|
|
|
|
|
|
|
|
|
|
|
|
|
|
5′ |
|
|||||
|
|
|
|
|
|
|
|
+ |
|
|
|
|
|
|
|
|||||||||||
|
|
5′ |
|
|
|
|
|
|
|
|
|
|
|
|
|
|
|
|
|
|
|
3′ |
|
|||
3′ |
|
|
|
|
|
|
|
|
|
|
|
|
|
|
|
|
|
|
|
|
|
|||||
|
|
|
|
|
|
|
|
|||||||||||||||||||
|
|
|
|
|
|
|
|
|
|
|
|
|
|
|
|
|
|
|
|
|
|
|
|
5′ |
|
|
|
|
|
|
|
|
|
|
|
|
|
|
|
|
|
|
|
|
|
|
|
|
|||||
Cycle 2: |
|
|
|
|
|
|
|
|
|
|
|
|
||||||||||||||
5′ |
|
|
|
|
|
|
|
|
|
|
|
|
|
|
|
|
|
|
|
|
|
|
|
3′ |
|
|
|
|
|
|
|
|
|
|
|
|
|
|
|
|
|
|
|
|
|
|
|
|
|
|
|
||
|
|
|
|
|
|
|
|
|
|
|
|
|
|
|
|
|
|
|
|
|
|
|
|
|
||
|
3′ |
|
|
|
|
|
|
|
|
|
|
|
|
|
|
5′ |
|
|||||||||
|
|
|
|
|
+ |
|
|
|
|
|
|
|
||||||||||||||
|
|
5′ |
|
|
|
|
|
|
|
|
|
|
|
3′ |
|
|||||||||||
|
|
|
|
|
|
|
|
|
|
|
|
|
|
|
|
|||||||||||
|
|
|
|
|
|
|
|
|
|
|
|
|
|
|
||||||||||||
|
3′ |
|
|
|
|
|
|
|
|
|
|
|
|
|
5′ |
|
||||||||||
|
|
|
|
|
|
|
|
|
|
|
|
|
|
|
||||||||||||
|
|
|
|
|
+ |
|
|
|
|
|
|
|
||||||||||||||
|
|
5′ |
|
|
|
|
|
|
|
|
|
|
|
|
3′ |
|
||||||||||
|
|
|
|
|
|
|
|
|
|
|
|
|
|
|
|
|
||||||||||
|
|
|
|
|
|
|
|
|
|
|
|
|
|
|
||||||||||||
|
|
3′ |
|
|
|
|
|
|
|
|
|
|
|
|
|
|
5′ |
|
||||||||
|
|
|
|
|
|
|
|
+ |
|
|
|
|
|
|
|
|||||||||||
|
|
5′ |
|
|
|
|
|
|
|
|
|
|
|
|
|
|
|
|
|
|
3′ |
|
||||
3′ |
|
|
|
|
|
|
|
|
|
|
|
|
|
|
|
|
|
|
|
|
|
|||||
|
|
|
|
|
|
|
|
|
||||||||||||||||||
|
|
|
|
|
|
|
|
|
|
|
|
|
|
|
|
|
|
|
|
|
|
|
5′ |
|
||
|
|
|
|
|
|
|
|
|
|
|
|
|
|
|
|
|
|
|
|
|
|
|
|
|
||
Cycle 3: |
|
|
|
|
|
|
|
|
|
|
|
|
||||||||||||||
5′ |
|
|
|
|
|
|
|
|
|
|
|
|
|
|
|
|
|
|
|
|
|
|
|
3′ |
|
|
|
|
|
|
|
|
|
|
|
|
|
|
|
|
|
|
|
|
|
|
|
|
|
|
|
||
|
3′ |
|
|
|
|
|
|
|
|
|
|
|
|
5′ |
|
|||||||||||
|
|
|
|
+ |
|
|
|
|
|
|
||||||||||||||||
|
|
5′ |
|
|
|
|
|
|
|
|
|
|
|
|
|
|
3′ |
|
||||||||
|
|
|
|
|
|
|
|
|
|
|
|
|
||||||||||||||
|
|
|
|
|
|
|
|
|
|
|||||||||||||||||
|
3′ |
|
|
|
|
|
|
|
|
|
|
|
|
|
|
5′ |
|
|||||||||
|
|
|
|
|
+ |
|
|
|
|
|
|
|
||||||||||||||
|
|
|
|
|
|
|
|
|
|
|
|
|
|
|
|
|
|
|
|
|
|
|
|
|
||
|
|
5′ |
|
|
|
|
|
|
|
|
|
|
|
|
|
|
|
|
|
3′ |
|
|
||||
|
|
|
|
|
|
|
|
|
|
|
|
|
|
|
|
|
|
|
||||||||
|
|
3′ |
|
|
|
|
|
|
|
|
|
|
|
|
|
|
|
|
|
5′ |
|
|
||||
|
|
|
|
|
|
|
|
|
|
|
|
|
|
|
||||||||||||
|
|
5′ |
|
|
|
|
|
|
|
|
|
|
|
+ |
|
|
|
|
|
|
3′ |
|
||||
|
3′ |
|
|
|
|
|
|
|
|
|
|
|
|
|
|
|
|
|
5′ |
|
||||||
|
|
|
|
|
|
|
|
|
|
|
|
+ |
|
|
|
|
|
|
|
|||||||
|
|
5′ |
|
|
|
|
|
|
|
|
|
|
|
|
|
|
|
|
3′ |
|
||||||
|
|
3′ |
|
|
|
|
|
|
|
|
|
|
|
|
|
|
|
|
5′ |
|
||||||
|
|
|
|
|
|
|
|
+ |
|
|
|
|
|
|
|
|||||||||||
|
|
|
|
|
|
|
|
|
|
|
|
|
|
|
|
|
|
|
|
|
|
|
|
|
||
|
|
5′ |
|
|
|
|
|
|
|
|
|
|
|
|
3′ |
|
|
|||||||||
|
|
|
|
|
|
|
|
|
|
|
|
|
||||||||||||||
|
|
3′ |
|
|
|
|
|
|
|
|
|
|
|
|
|
|
|
|
5′ |
|
|
|||||
|
|
|
|
|
|
|
|
|
|
|
|
|
|
|
|
|
||||||||||
|
|
5′ |
|
|
|
|
|
|
|
|
|
+ |
|
|
|
|
|
|
|
3′ |
|
|||||
|
|
3′ |
|
|
|
|
|
|
|
|
|
|
|
|
|
|
|
|
5′ |
|
||||||
|
|
|
|
|
|
|
|
|
|
|
+ |
|
|
|
|
|
|
|
||||||||
|
|
5′ |
|
|
|
|
|
|
|
|
|
|
|
|
|
|
|
3′ |
|
|||||||
3′ |
|
|
|
|
|
|
|
|
|
|
|
|
|
|
|
|
|
|
||||||||
|
|
|
|
|
|
|
|
|
||||||||||||||||||
|
|
|
|
|
|
|
|
|
|
|
|
|
|
|
|
|
|
|
|
|
|
|
5′ |
|
||
|
|
|
|
|
|
|
|
|
|
|
|
|
|
|
|
|
|
|
|
|
|
|
|
|||
Figure 4.3. The products formed during the first three cycles of a PCR experiment. The target DNA molecule (depicted in red and blue) contains sequences that are complementary to the two oligonucleotides. The oligonucleotides act as initiation points for DNA replication. The products from each cycle of PCR are all templates for DNA replication in subsequent cycles. Shown here are the products of the first PCR cycle (green), the second cycle (purple) and the third cycle (brown). Completion of the third cycle results in the formation of two double-stranded DNA molecules – boxed – whose 5 - and 3 -ends match exactly to the ends of the oligonucleotide primers. Subsequent cycles will result in the exponential increase of this type of DNA molecule