

Photochemistry_of_Organic
.pdf2
A Crash Course in Photophysics and a ClassiÞcation of Primary Photoreactions
2.1 Photophysical Processes
An authoritative compilation of deÞnitions and concepts is available in the Glossary of Terms Used in Photochemistry, 3rd edition,22 which can be downloaded from the IUPAC webpages or from those of the photochemical societies (http://pages.unibas.ch/epa or http://www.i-aps.org/).
2.1.1State Diagrams
The expression ÔJabłonski diagramÕa,25 is commonly used to designate state diagrams of the kind depicted in Figure 2.1. The French community prefers to name such diagrams after J. Perrin.26 Actually, several authors had used similar state or term diagrams to describe the long-lived emission observed from irradiated solid solutions, but none prior to Lewis, Lipkin and Magel in 194127 had attributed the metastable species to a triplet state of the dissolved organic molecules. Firm evidence that the emitting species were normal organic molecules in a triplet state was soon provided by Terenin in 194328 and by Lewis and Kasha in 1944.23 Irrefutable proof identifying the triplet state of an organic molecule was Þnally obtained in 1958 by Hutchison and Mangum,29 who reported ESR spectra of naphthalene held in a small number of known orientations in a durene crystal.
a Excerpts from a personal communication from Professor M. Kasha, Florida State University, to J. W., 25 July 2008: ÔAlexander Jabłonski intended that his diagram applies to dye molecules. In those the lowest S1ÐT1 separation is relatively small (generally about 1000Ð2000 cm-1). Jabłonski gave a neat kinetic analysis which indicated that thermal excitation from the metastable excited (T) state to the nearby excited (S) state was achievable in general. Note that the T-state designation for the metastable excited state was the result of the 1944 Lewis and Kasha study.23 Jabłonski did not accept this interpretation. A paper I presented at the memorial symposium in Torun, Poland, in honor of Jabłonski,24 was commissioned by the Polish Physical Society and was much admired by the Polish physicists. At the meeting I was informed that in his last year or so Jabłonski Þnally accepted the idea that the ÒmetastableÓ state was really the lowest excited triplet state of the dye.Õ
Photochemistry of Organic Compounds: From Concepts to Practice Petr Klán and Jakob Wirz © 2009 P. Klán and J. Wirz. ISBN: 978-1-405-19088-6
26 |
Photophysics and Classification of Primary Photoreactions |
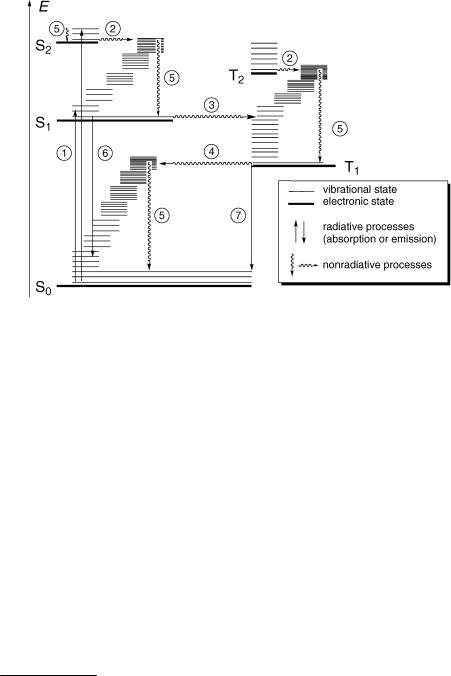
Figure 2.1 State diagram (commonly called Jabłonski diagram) depicting molecular states and photophysical processes. The vertical position of the thick horizontal lines represents the electronic energy minimum. Vibrational energy levels are shown as thin lines. The width of the horizontal lines and their position along the abscissa are chosen merely to avoid congestion in the graphical diagram and have no physical connotation
Molecularb electronic states are represented by thick horizontal lines (—) that are arranged in vertical order to indicate relative energies and are labelled consecutively by increasing energy, beginning with the singlet ground state S0, followed by excited singlet states S1, S2, etc. Vibrational states, represented here by thin lines (Ñ), are usually not shown explicitly. When they are shown as in Figure 2.1, the lowest thin line of each electronic state represents the zero-point energy level (y ¼ 0) of that state. States of a given multiplicity are collected in separate columns.c For molecules with a singlet ground state, the left-hand column collects the electronic singlet states and that to the right the triplet states. The lowest triplet state is labelled T1, followed by T2, T3, and so on.
Photophysical processes are radiative or radiationless transitions by which molecules are promoted from one electronic state to another. No structural change results, although the bond lengths and angles generally differ somewhat in different electronic states. Radiative transitions are associated with the absorption or emission of a photon and are represented as straight arrows (" or #), while radiationless transitions are not associated
bWe use the term molecule to comprise all (meta)stable molecular species including ions and radicals.
cHorizontal displacement does not indicate a change in structure. The energy levels represent minima on the potential energy surfaces of a given electronic state. The corresponding structures will be somewhat different for each state. Such a representation is not meaningful if an excited state has no energy minimum near the structure of the ground state.

Photophysical Processes |
27 |
with absorption or emission and are shown as wavy arrows  . A vibronic transition is a transition between two states that differ in both the electronic and the vibrational quantum numbers of a molecule. The term vibronic is a fusion of vibrational and electronic.
Comments on Figure 2.1:
\ The time scale of electronic absorption is the time during which a molecule interacts strongly with a photon. The wavelengths of near-UV photons are more than two orders of magnitude larger than the size of an average organic molecule. Assume that the ÔlengthÕ of
a photon is on the order of its wavelength, say l ¼ 300 nm. Then the time needed for a photon to traverse a molecule at the speed of light, c ¼ 3 108 m s 1, is t l/c ¼ 10 15 s.
A more tenable derivation of the same is obtained from the Heisenberg uncertainty principle,d for the variables time t and energy E (Equation 2.1).
dEdt h=2 ¼ h=4p
Equation 2.1 Heisenberg uncertainty principle
The ÔuncertaintiesÕ d are deÞned as the standard deviations of simultaneous measurements of time and energy. During an electronic transition of a molecule in the
presence of an electromagnetic Þeld, the indeterminacy dE of the molecular energy is on the order of the photon energy, Ep ¼ hn ¼ hc/l. Hence dt l/(4pc) 1 10 16 s for
l ¼ 300 nm.
Absorption of electromagnetic radiation in the UVÐVIS range always populates an electronically excited state, notwithstanding the high density of vibrationally (and rotationally) excited states in that region. Transitions to high-energy vibrational states by light absorption are ÔforbiddenÕ (not observed); only transitions involving electronic excitation carry appreciable intensity, hence the name electronic spectra. Transitions to the Þrst excited vibrational levels occur in the infrared region of the electromagnetic spectrum and very weak transitions to the second level (overtones) or to states in which two vibrational degrees of freedom are excited (combination bands) are observable in the nearinfrared (0.1 < ~v/mm 1 < 1). Following electronic absorption, the isoenergetic vibrational states come to play in the radiationless transitions `Ј, which are considered next.
` Internal conversion (IC) is an isoenergetic radiationless transition between two electronic states of the same multiplicity.
´, ˆ Intersystem crossing (ISC) is an isoenergetic radiationless transition between two electronic states of different multiplicity. In molecules with a singlet ground state, ISC can take place from a singlet state to a triplet state, process ´, or vice versa, ˆ.
IC and ISC, `Ј, are processes of energy redistribution within the excited molecule by which electronic energy is distributed over many vibrational modes. This takes time, in much the same way as it is difÞcult to get change for a large banknote denominated in a foreign currency on a ßea market (see Section 2.1.5). IC and ISC are essentially irreversible processes, because they are associated with an entropy increase (high density of states in the lower-energy electronic state) and because the following process ˜ is very fast in solution.
d Indeterminacy would be a more adequate translation of Unsch€arfe.

28Photophysics and Classification of Primary Photoreactions
˜Vibrational relaxation (also called vibrational cooling, vibrational deactivation or thermalization) encompasses all processes by which excess vibrational energy that a molecule has acquired by a vibronic transition (absorption, IC or ISC) is transferred to the surrounding medium. It occurs through collisions with other molecules. In solution, the time required to transfer a vibrational quantum to the surrounding medium is on the order of
a vibrational period 1/nvib, which corresponds to the time elapsing between collisions with the solvent (100 fs); thermalization of large molecules ( 10 atoms) usually occurs with a
half-life of a few picoseconds in solution, but may take much longer in poorly conducting rare gas matrices at low temperature. Molecules in high vacuum (isolated molecules) cannot undergo vibrational relaxation by collision with other molecules and the loss of excess vibrational energy by infrared radiation is very slow. However, a hot molecule will still undergo intramolecular vibrational redistribution (IVR) by which the energy that is originally localized in the mode populated by a vibronic transition is distributed among the other vibrational modes, that is, the molecule acts as its own heat bath. IVR occurs on a sub-picosecond time scale in ÔlargeÕ molecules (benzene or larger), but may require much
longer in small molecules with low densities of vibrational states.
¯ Fluorescencee,30 is the spontaneous emission of radiation by an excited molecule,
typically in the Þrst excited singlet state S1, with retention of spin multiplicity.
˘ Phosphorescencef,30 is the spontaneous emission of radiation from an excited molecule, typically in the Þrst excited triplet state T1, involving a change in spin multiplicity.
Primary photochemical processes are processes initiated from an electronically excited state that yield a primary photoproduct that is chemically different from the original reactant. Photochemical processes are always in competition with photophysical processes that eventually restore the reactant in the ground state. Photoreactions leading to new products can be efÞcient only if they are faster than the competing photophysical processes. Therefore, it is essential to have a feeling for the time scales of the latter (Table 2.1, Figure 2.2). Photophysical processes of molecules in solution usually obey a
Table 2.1 Summary of photophysical processes
Process |
Name |
|
Time scale |
Section |
|
|
|
(t ¼ 1/kprocess)/s |
|
\ |
Absorption |
|
10 15 |
2.1.2 |
` |
Internal conversion |
|
10 12–10 6 |
2.1.7, 2.1.5 (Kasha rule) |
´ |
Intersystem crossing (S |
T) |
10 12–10 6 |
2.1.6 (El Sayed rule) |
ˆ |
Intersystem crossing (T |
! S) |
10 9–101 |
2.1.6 |
˜ |
Vibrational relaxation |
! |
10 13–10 12 |
2.1.5 |
¯ |
Fluorescence |
|
10 9–10 7 |
2.1.3 |
˘ |
Phosphorescence |
|
10 6–10 3 |
2.1.6 |
eThe word is derived from the mineral ßuorospar and was coined in 1852 by G. G. Stokes to describe the emission observed when
ßuorospar or a solution of quinine sulfate were exposed to UV radiation that was separated from sunlight by means of a prism. Stokes stated that the emitted light is always of longer wavelength than the exciting light. This statement is now known as Stokes law and the wavelength shift is referred to as the Stokes shift (see Section 2.1.9). Similar experiments were in fact reported earlier by D. Brewster (1833) and E. Becquerel (1842).
fThe term is derived from Greek jw§ ¼ light and jorein ¼ to bear and was used in the Middle Ages for materials that glow in the
dark after exposure to light.

|
|
|
|
|
|
|
|
Photophysical Processes |
|
|
|
29 |
||||||||||||
molecular vibration |
|
|
|
|
|
heartbeat |
|
|
|
|
first humans |
|||||||||||||
periods |
|
|
|
|
|
|
neurotrans- |
|
1 day |
human life |
|
age of |
||||||||||||
|
|
|
|
|
|
|
|
|||||||||||||||||
|
|
|
|
|
|
|
|
|
|
|||||||||||||||
H–H |
|
I–I |
|
|
mission |
|
|
expectancy |
|
universe |
||||||||||||||
|
|
|
|
|
|
|
|
|
|
|
|
|
|
|
|
|
|
|
log(t/s) |
|||||
–15 |
|
–12 |
–9 |
–6 |
–3 |
0 |
3 |
6 |
9 |
12 |
15 |
|
|
|||||||||||
|
|
|||||||||||||||||||||||
|
|
|
|
|||||||||||||||||||||
|
|
|
|
|
|
|
|
|
|
|
|
|
|
|
|
|
|
|
|
|
|
|||
absorp- |
vibrational |
fluo- |
phosphorescence |
age |
at PhD |
|
|
|
|
|
||||||||||||||
tion |
relaxation |
rescence |
|
|
|
|
promotion |
|
|
|
|
|
||||||||||||
|
|
|
|
|
|
|
|
|
|
|
|
|
|
|
|
|
|
|
|
|||||
|
|
|
|
|
IVR |
|
|
radiative lifetimes |
|
|
|
|
|
|
|
|
|
|
|
|||||
|
|
|
|
|
|
|
|
|
|
Figure 2.2 |
Time scales |
|
|
|
|
|
|
|||||||
Þrst-order rate law. When several processes contribute to the decay of a large number of molecules in an excited state M that was generated by absorption of a short light pulse at time t ¼ 0, the decay of the initial concentration cM (0) will be given by Equation 2.2:
cM*ðtÞ ¼ cM*ð0Þe ðSkÞt
Equation 2.2 First-order rate law
The lifetime of M , t(M ), is deÞned as the time in which the initial concentration cM (0) is reduced to cM (0)e 1 0.368cM (0), that is, t(M ) ¼ 1/Sk, where Sk is the sum of the rate constants of all processes contributing to the decay of M . More detailed rules for estimating the rate constants of photophysical processes for individual molecules will be given in the following sections.
The difference between photophysical and photochemical processes is not always clear cut. For example, the E–Z isomerization of alkenes represents a photochemical process by the above deÞnition, yet the same process might be seen as photophysical in terminal alkenes, where geometric isomers are indistinguishable in the absence of isotopic labels.
The term luminescence denotes the spontaneous emission of radiation from an electronically excited species and comprises ßuorescence and phosphorescence, and also chemiluminescence (Section 5.6).
2.1.2Beer–Lambert Law
The absorbance A(l) of a sample is deÞned by Equation 2.3:g,10,22
AðlÞ ¼ logðP0l=Ptrl Þ ¼ log½TðlÞ&; TðlÞ ¼ 10 AðlÞ
Equation 2.3
where P0l and Ptrl are the incident and transmitted spectral radiant power, respectively, and TðlÞ ¼ Ptrl =P0l is the internal transmittance of the sample at the given wavelength l. For
g Radiant power, P, is the radiant energy, Q, emitted, transferred or received at all wavelengths per unit time, P ¼ dQ/dt. If the radiant energy Q is constant over the time interval considered, P ¼ Q/t. The SI unit of radiant power is watt, [P] ¼ W. The spectral radiant power is a differential, Pl ¼ dP(l)/dl, representing the radiant power P per wavelength interval. Spectral radiant power
expressed in wavenumbers, Pn~ ¼ dPðn~Þ=dn~, is equal to Pl/n~2, because |dl/dn~| ¼ 1/n~2. The factor 1/n~2 cancels in the ratio T(l) ¼ Pl0/Pltr ¼ Pn~ 0/Pn~tr. The units of spectral radiant power are [Pl] ¼ W m 1 and [Pn~ ] ¼ W m. The intensity or irradiance,
symbol I, is the radiant power received at a surface, [I] ¼ W m 2. The ratios P0/Ptr and I0/Itr are equal. The expression ÔintensityÕ has traditionally been used indiscriminately for photon ßux, irradiance or radiant power. When considering an object exposed to radiation, it should therefore be used only for qualitative descriptions.
30 |
Photophysics and Classification of Primary Photoreactions |
absorbance and transmittance, the wavelength l can be replaced by the corresponding wavenumber, n~ ¼ 1/l, A(l) ¼ A(n~) and T(l) ¼ T(n~). The terms Ôoptical densityÕ (OD) for A(l) and ÔtransmissionÕ for T(l) should no longer be used and the term ÔextinctionÕ should be reserved for the total effect of absorption, scattering and luminescence. The accepted term for the quantity 1 T(l) is absorptance, symbol a.
The Beer–Lambert law (Equation 2.4) holds only for absorbing species that do not exhibit any concentration-dependent aggregation (Lambert law).
AðlÞ ¼ «ðlÞcl
Equation 2.4 Beer–Lambert law for a single absorbing compound
Equation 2.5 is the extension of this law for solutions containing a mixture of n absorbing species Bi, i ¼ 1, 2, . . . n. When there are no speciÞc interactions between these species, the contributions of the individual components to the total absorbance, that is, the partial absorbances Ai(l) ¼ «i(l)cil, are additive. The proportionality constants «i(l) are
called molar (decadic) absorption coefficients of |
|
species Bi at wavelength l; again, |
|||||||||||||
« |
i(l) ¼ «i(n~). |
The pathlength |
l |
is |
commonly |
measured in centimetres and the |
|||||||||
|
|
|
|
|
|
|
3 |
|
|
|
|
||||
concentrations c |
|
in molarity, M |
mol dm |
, so that the unit of the molar absorption |
|||||||||||
|
|
|
i |
|
3¼ |
|
|
1 |
cm |
1 |
|
1 |
cm |
1 |
. |
coefÞcient becomes [«(l)] ¼ dm |
mol |
|
|
¼ M |
|
||||||||||
|
|
|
|
|
|
|
n |
|
|
|
|
n |
|
|
|
XX
AðlÞ ¼ |
AiðlÞ ¼ l «iðlÞci |
i¼1 |
i¼1 |
Equation 2.5 Beer–Lambert law for a mixture of absorbing compounds
2.1.3Calculation of Fluorescence Rate Constants from Absorption Spectra
In addition to the spontaneous emission of excited molecules, ßuorescence and phosphorescence (Section 2.1.1), the interaction of electromagnetic radiation with excited molecules gives rise to stimulated emission, the microscopic counterpart of (stimulated) absorption. Albert Einstein derived the existence of a close relationship between the rates of absorption and emission in 1917, before the advent of quantum mechanics (see Special Topic 2.1).
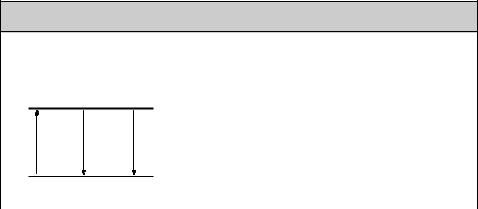
Special Topic 2.1: Einstein coefficients of absorption and emission
Consider a gas of molecules with two electronic states, an excited state m and the ground state n (Figure 2.3), in equilibrium with an electromagnetic Þeld of radiant energy density r emanating from a black-body light source such as the Sun.
m
|
|
|
Bnm: Einstein's coefficient of (stimulated) absorption |
||
Bnm |
Bmn |
Amn |
B |
mn |
: Einstein's coefficient of stimulated emission |
|
|
|
|
|
|
|
|
|
Amn: Einstein's coefficient of spontaneous emission |
||
|
|
|
n |
|
|
Figure 2.3 Two-level scheme with radiative processes

Photophysical Processes |
31 |
The frequency distribution rn ¼ dr/dn of a black-body radiator is given by Planck s law (Equation 2.6):
8phn~3
rn ¼ ehn=kBT 1
Equation 2.6 Planck distribution of a black-body radiator
where T is the temperature of the black body.
Once the gas has reached equilibrium with the radiation Þeld, the populations of its energy levels m and n, Nm and Nn, must be constant, dNm/dt ¼ dNn/dt ¼ 0. With the Einstein coefÞcients deÞned in Figure 2.3 one obtains Equation 2.7:
dNm=dt ¼ BnmNnrn Nm½Amn þ Bmnrn& ¼ 0
Equation 2.7
Solving for rn yields Equation 2.8:
Amn=Bnm
rn ¼ Nn=Nm Bmn=Bnm
Equation 2.8
The ratio of equilibrium populations Nn/Nm in the denominator of Equation 2.8 must obey Boltzmann s equation (Equation 2.9):
Nn=Nm ¼ eDE=kBT ¼ ehn=kBT
Equation 2.9 Boltzmann s law
where DE ¼ hn is the energy difference between two molecular states m and n. Equation 2.8 has the same form as Equation 2.6 if and only if Bmn ¼ Bnm ¼ B, i.e.
Bmn/Bnm ¼ 1. Combining Equation 2.8 with Equation 2.6, we obtain the Þnal relation Equation 2.10, where we have dropped the now superßuous indices m and n:
A ¼ 8phn~3B
Equation 2.10
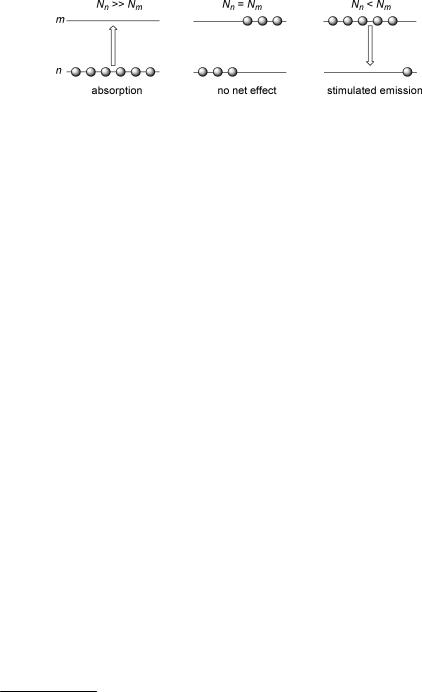
The probability of stimulated emission by an excited molecule, Brn, is the same as that of the reverse process, absorption by the ground-state molecule. This is a consequence of the law of microscopic reversibility: if the number of excited molecules Nm is equal to the number of ground-state molecules Nn, then the rates of stimulated absorption and emission must be equal. If by some means a population inversion can be produced, Nm > Nn, the net effect of interaction with electromagnetic radiation of frequency n will be stimulated emission (Figure 2.4). This is the operating principle of the laser. LASER is an acronym for light ampliÞcation by stimulated emission of radiation (Section 3.1).
Polyatomic molecules have broad absorption and emission bands due to the contributions of vibronic transitions. Einstein s equation (Equation 2.10) relates the coefÞcients of absorption and emission in a two-level system. Several extensions of
32 |
Photophysics and Classification of Primary Photoreactions |
Figure 2.4 Net effects of interaction with electromagnetic radiation
Equation 2.10, which permit the determination of ßuorescence rate constants kf from the broad absorption spectra of molecules, have been derived. The best known is that of Strickler and Berg.31 A simpler version that is easier to use (Equation 2.11)32 is sufÞcient for most practical purposes:
s f1 |
|
2900n2 |
|
|
|
|
|
2 |
ð |
|
|
1 cm |
|
|
|
|
|
¼ |
m |
m |
1 |
|
M |
|
1 |
m |
m |
1 |
|||||||
|
|
|
|
|
|
|
|
|
|
|
|||||||
k |
|
|
|
n~max |
|
|
|
|
|
« |
|
|
|
dn~ |
|
||
absorption band
Equation 2.11 Determination of fluorescence rate constants from absorption spectra
where n is the refractive index of the solvent, « is the molar absorption coefficient, and n~max is the wavenumber of the absorption band s maximum. However, overlap of absorption bands frequently hampers integration over a single absorption band. It may be helpful in this respect to assume a mirror-image relationship (Section 2.1.9) between the Þrst absorption band and ßuorescence. In general, ßuorescence rate constants kf determined from lifetime measurements (Equation 3.33) are in satisfactory agreement ( 20%) with those calculated from the absorption spectrum (Equation 2.11). Even quick- and-dirty estimates will give the right order of magnitude for kf, which may be quite useful. In some cases, however, experimental values of kf (determined from kf ¼ Ff/tf; see Section 3.9.7, Equation 3.33) are found to be much smaller than those calculated by Equation 2.11. This indicates that the electronic transition to the lowest excited state S1 may be hidden under an absorption band of stronger intensity. Such an observation led to the important identiÞcation of a ÔforbiddenÕ state in linear polyenes (see Section 4.7).
2.1.4Dipole and Transition Moments, Selection Rules
An electric dipole can be represented by two equal but opposite charges, þ q and q, that are held at a distance r. The dipole moment m is a vector pointing from the negative to the positive charge.h The magnitude of m, m ¼ qr, is commonly measured in the non-SI unit debye, 1 D ¼ 3.336 10 30 C m. Thus, for an electron held at a distance of 100 pm from a proton, m ¼ 4.8 D. In quantum mechanics, the dipole moment m of a molecule in the ground state is obtained from the ground-state wavefunction C0 as the expectation value of
h Confusingly, the chemical symbol for a dative bond as in H3N ! BH3 indicates the direction of electron donation and, accordingly, the dipole moment vector points from þ towards in many chemistry textbooks. However, IUPAC deÞnes the direction of the dipole moment as pointing from the negative to the positive charge.
Photophysical Processes |
33 |
|
m (υ' = 2) |
|
|
∆E = hν |
∆E ≠ hν |
|
n (υ = 0)
Figure 2.5 The resonance condition for absorption of light with frequency n
the dipole moment operator (Equation 2.12). The vectors ri ¼ (xi, yi, zi) deÞne the positions of the electrons i, rm ¼ (xm, ym, zm) those of the nuclei m, Zm are the charges of the nuclei, and e is the elementary charge. The three components of m, mx, my and mz, are obtained by inserting the respective components of the vectors r.
^ |
^ |
M ¼ eðSri SZmrmÞ; |
m ¼ hC0jMjC0i |
Equation 2.12
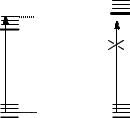
For a quantum mechanical treatment of light absorption, the dual nature of light must be taken into account. Light can be absorbed only if the excitation energy matches the photon energy, DE ¼ hn that is, if the absorption of a photon by the molecule leads to one of the discrete excited states of the molecule (Figure 2.5).
When the Bohr resonance condition is met, the probability of light absorption may be calculated from the interaction of the electric vector of the light wave of frequency n with the electrons and nuclei in the molecule. Molecules being much smaller than the wavelengths of UVÐVIS radiation (Figure 1.6), the electromagnetic radiation Þeld acting on a molecule is treated as a linear electric Þeld and magnetic interactions are neglected. We assume that the molecule is initially in the lowest vibrational level (y ¼ 0) of the electronic ground state n and reaches some vibrational level of the excited state m, for example, y0 ¼ 2 as shown in Figure 2.5. Conversely, for emission, one would assume that y0 ¼ 0 and y could take any value. The transition moment for a single vibronic absorption band Mn,0 ! m,y0, is then given by Equation 2.13.
n;0 ! m;y0 e Cn;0 ^ Cm;y0
M ¼ h jMj i
Equation 2.13 Transition moment
Like the dipole moment m, the vector Mn,0 ! m,y0 has a magnitude, measured in debye, and a direction relative to the Cartesian coordinate system of the molecule. Computer programs make use of Equations 2.12 and Equation 2.13 to calculate dipole and transition moments, respectively, from the appropriate wavefunctions Cn,0 and Cm,y0. The comparison of calculated and experimental (Section 3.6) transition moments is an essential test to validate simpliÞed models of electronic excitation (Section 4.4). Note that the dipole and transition moments of a molecule are not related; in fact, they may well be orthogonal to each other.
To calculate the transition moment Mn,0 ! m,y0, we use the approximate wavefunctions that are factored into the product of an electronic function Cel, a vibrational wavefunction

34 |
Photophysics and Classification of Primary Photoreactions |
|||||||||||||||
|
|
|
|
|
|
|
|
|
|
|
|
|
|
|
|
^ |
x and a spin function s (Equation 1.10). The dipole moment operator M is a multiplicative |
||||||||||||||||
^ |
^ |
|
|
|
|
|
|
|
|
|
|
|
|
|
|
|
operator, MC ¼ CM, and does not affect the spin functions, so that Equation 2.13 can be |
||||||||||||||||
factored into a product of integrals, Equation 2.14: |
|
|
|
|||||||||||||
|
Mn;0 |
! |
|
0 |
¼ |
|
hC |
|
x |
|
j |
^ |
jC |
ih j |
sm |
i |
|
m;y |
e |
el;n |
|
0 |
M |
||||||||||
|
|
|
|
|
|
|
el;mxy0 |
sn |
|
|||||||
Equation 2.14
The spin functions are orthonormal: The integral hsn|smi equals unity if sn ¼ sm and it vanishes otherwise, so that the transition moment vanishes for singletÐtriplet and tripletÐsinglet transitions (or doubletÐquartet transitions in radicals). This is our Þrst selection rule: Electronic transitions between states of different multiplicity are forbidden
(the transition moment is zero). Note that selection rules, of which we will encounter several more in Chapter 4, do not hold strictly; they are broken like all rules in real life. They hold only within the limited view of some approximations, in the present case the neglect of magnetic interactions. The multiplicity selection rule is a strong one in the absence of heavy atoms, because magnetic interactions in most organic molecules are very weak. As we have seen in Section 2.1.1, absorption coefÞcients of singletÐtriplet transitions and rate constants of phosphorescence, which are directly related to the absorption coefÞcients (see Special Topic 2.1 in Section 2.1.3), are orders of magnitude smaller than those for the corresponding spin-allowed transitions, singletÐsinglet absorption and ßuorescence.
Using the deÞnition of ^ (Equation 2.12), the Þrst integral of Equation 2.14 can be
M
expanded as follows:
Cel;n |
x |
0 |
|
^ |
|
|
j |
M Cel;mxy0i ¼ hCel;njSrijCel;mihx0jxy0 i hCel;njCel;mihx0jSZmrmjxy0 i |
|||
h |
|
|
|
j |
|
|
|
|
|
|
Equation 2.15 |
Note the factorization of the two terms; the vibrational wavefunctions x can be separated because they do not depend on the electronic positions ri and the electronic wavefunctions can be separated if we disregard their parametric dependence on the precise nuclear positions.i The second term then vanishes due to the orthogonality of the electronic wavefunctions Cel,n and Cel,m, so that the transition dipole moment of a spin-allowed transition becomes
Mn;0 ! m;y0 ¼ ehCel;njSrijCel;mihx0jxy0 i ¼ Mel;n ! mhx0jxy0 i
Equation 2.16
Equation 2.16 represents the transition moment for a single vibronic transition from the zeroth vibrational level of the ground state to a single vibrational level y0 of the electronically excited state. The vibrational overlap integrals hx0jxy0i are called Franck–Condon integrals; they will generally be different from zero, because the two vibrational wavefunctions refer to different electronic potential energy surfaces (vibrational wavefunctions calculated from a single harmonic potential are orthonormal). The transition moment of a single vibronic band is thus determined by the product of two factors, the electronic transition moment (Equation 2.17) and the FranckÐCondon integral
i This approximation must be dropped for forbidden electronic transitions, i.e. when hCel,njSrijCel,mi ¼ 0 (symmetry-forbidden transitions, Section 4.4).