

Photochemistry_of_Organic
.pdf186 |
Photochemical Reaction Mechanisms and Reaction Intermediates |
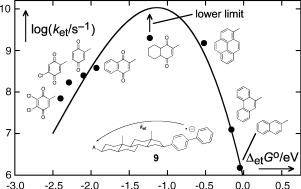
Figure 5.1 Rehm–Weller plot; Equation 5.5 was fitted to the data. The dotted line shows a fit of the Marcus Equation 5.7 to the data DetG 50 kJ mol 1 344
charge-transfer complexes of tetracyanoethylene with methylated benzenes cover the
entire visible region; the maxima are red shifted with increasing methyl substitution, from n~max ¼ 2:6 mm 1 for benzene to n~max ¼ 1:9 mm 1 for hexamethylbenzene.343 Such
solutions can be useful as filters to attenuate the maximum in the spectrum of xenon arcs to produce a more evenly distributed white light source for spectral analysis.
Electron transfer from or to an excited molecule results in fluorescence quenching. In the absence of EDA complex formation, bimolecular rate constants of electron transfer quenching can be determined from the slope of a Stern–Volmer plot of fluorescence quenching combined with measurements of the fluorescence lifetime of M (Section 3.9.8, Equation 3.36). In a seminal paper, Rehm and Weller344 reported fluorescence quenching rate constants kq for four excited aromatic compounds (3,4-benzacridine, anthracene, 1,2-benzanthracene and 1,12benzperylene) by a series of aminoand methoxy-substituted benzene derivatives as donor molecules in acetonitrile solution. When log(kq/M 1 s 1) was plotted against the free energy of electron transfer (Equation 5.2), the data followed a curve approaching the diffusion rate constant kd 1.6 1010 M 1 s 1 for DetG 0 and falling off at DetG 0 (Figure 5.1).
The mechanism of quenching had previously been established by observing the formation of free radical ions using flash photolysis.345 Rehm and Weller proposed the empirical Equation 5.5 to fit the data, where DetG is the free energy of photoinduced electron transfer in the contact pair (Equation 5.1), DGz is the free energy of activation that accounts for the structural and solvent reorganization required for the transfer of an electron, kd and k d are the rate constants for the formation and separation of the encounter complex, respectively, Kd ¼ kd/k d is the equilibrium constant of complex
formation and Z is the bimolecular |
collision |
frequency |
in an |
encounter complex, |
|||||||||||||||
Z 1011 s 1.346 A value of kd/(ZKd) ¼ 0.25 was used. |
|
|
|
|
|
|
|||||||||||||
kq ¼ |
|
|
|
|
|
|
kd |
|
|
|
|
; |
|
|
|
|
|
|
|
|
|
|
kd |
|
|
|
|
|
|
|
|
|
|
|
|
||||
1 þ |
|
|
ðeDetGz=RT þ eDetG =RT Þ |
|
|
|
|
|
|
||||||||||
KdZ |
|
|
|
|
|
|
|||||||||||||
|
|
et |
|
|
|
|
|
|
s |
||||||||||
|
|
|
|
|
|
|
DetG |
|
DetG |
2 |
|
|
|
|
|
2 |
|||
where D |
|
Gz |
¼ |
|
þ |
|
|
|
þ ð |
DetGz |
ð |
0 |
ÞÞ |
|
|||||
|
2 |
|
2 |
|
|||||||||||||||
|
|
|
|
|
|
|
|
|
|
|
|
|
|||||||
Equation 5.5 Rehm–Weller equation

Electron Transfer |
187 |
The two parameters of Equation 5.5, kd and DGz(0), the free energy of activation when |
||||||
DetG |
¼ |
0, may be determined by nonlinear |
least-squares fitting to the data, giving |
|||
|
1 |
10 |
10 |
1 |
1 |
|
DGz(0) ¼ 90 10 kJ mol and kd ¼ (2.2 0.3) |
|
M |
s . Clearly, the Rehm–Weller |
|||
equation fits the data well (Figure 5.1), but it is in disagreement with a bold prediction made earlier by Marcus,346 namely that electron transfer rates should decrease not only when the reaction is endergonic, DetG > 0, but also as it becomes strongly exergonic,
D |
et |
G |
|
0, the so-called Marcus inverted region. The authors noted that Marcus s theory |
|||
|
|
|
50 kJ mol |
1 |
equally well, but that |
||
(see Equation 5.7 below) would fit the data for DetG |
|
||||||
|
|
|
|
|
|
|
|
it deviates by up to four orders of magnitude at more negative values of DetG , as shown by the dashed curve in Figure 5.1.
Even when the series was extended to include values of DetG down to 250 kJ mol 1, the observed quenching rate constants remained at the diffusion limit.347 For many years it was a matter of controversy why the predicted decrease in the inverted region was not observed in the Rehm–Weller experiment nor in related data obtained later. Rehm and Weller considered possible explanations such as H-atom transfer (i.e. essentially simultaneous electron and proton transfer) or the formation of a low-lying excited state of one of the radical ions, resulting in a free energy change DetG less negative than that calculated by Equation 5.1, but these were ruled out for some of the data points. For a personal, historical perspective on Weller s work, see ref. 348.
In simplified form, classical Marcus theory346 may be recast as follows. Imagine a reaction coordinate Q that reflects the structural changes of an (A D) encounter pair and of the surrounding solvent when an electron is transferred within (A D) to give (A D þ ) [Figure 5.2 (left)]. The potential energy surfaces along the reaction coordinate Q are approximated as parabolas with (A D) on the left-hand side (thick solid line) and several parabolas on the right that are shifted vertically to represent the situation for various (A D) pairs that have different free energies of electron transfer, DetG .
Figure 5.2 Left: potential energy curves for an electron-transfer reaction in an encounter complex of an acceptor A and a donor D, (A D) ! (A D þ ). Right: rate constants predicted by combining Equations 5.6 and 5.7. The diagrams are explained in the text

188 |
Photochemical Reaction Mechanisms and Reaction Intermediates |
|||||||||
|
|
(H3N)Ru(III) |
|
|
|
|
|
Ru(II)(NH3) |
|
5+ |
|
|
|
|
|
|
|
|
|||
|
|
|
N |
|
N |
|
|
KFe(III)[Fe(II)CN6] |
||
|
|
|
|
|||||||
|
|
|
|
|
|
|
|
|
|
Prussian blue |
|
|
|
|
|
8 |
|
|
|
|
|
Figure 5.3
Consider first the case of a thermoneutral reaction, DetG ¼ 0 (solid line). It could represent the case of electron transfer between identical molecules, that is, (M M) ! (M M ). The reaction coordinate Q accounts for all the structural changes associated with accommodating the excess electron on one or the other molecule. The case DetG ¼ 0 is also realized in the famous Creutz–Taube349 ion 8 (Figure 5.3) and related so-called mixed-valence
Compound 8 exhibits a broad, moderately intense (oscillator strength f 0.03) electronic absorption band in the near-IR region (lmax ¼ 1560 nm in H2O) that is not observed in model compounds in which both Ru atoms are in an oxidation state of either II or III. The colour of Prussian Blue is also attributed to a charge-transfer absorption, moving an electron from Fe(II) to Fe(III), which are in a different environment, so that DetG „ 0.
The energy of the IR transition in compound 8, marked l in Figure 5.2, represents the Franck–Condon energy of electron transfer from Ru(II) to Ru(III) and is called reorganization energy. Simple geometric considerations show that the crossing point of the two parabolas lies at l/4. Ignoring entropy terms, l/4 corresponds to the quantity DGz(0) used by Rehm and Weller, the activation free energy for thermal self-exchange in 8. However, the parabolas represent zero-order adiabatic curves, which will be split apart by consideration of the electronic coupling term V12 between the zero-order states at the crossing point. The transition probability can then be estimated by the Landau–Zener equation (Equation 2.53). Recent work indicates that the stabilization by V12 is in fact comparable to l/4 in compound 8, so that the thermal barrier nearly vanishes.351 Electron transfer between metal centres sharing a common ligand is called inner-sphere electron transfer.
Returning to intermolecular electron transfer (outer-sphere electron transfer), we assume that the electronic coupling term V12 in the encounter pair (A D) is sufficient to ensure a high probability of electron transfer at the crossing points, but much smaller than DGz(0) ¼ l/4. The rate of electron transfer is then given by Eyring s transition state theory (Equation 5.6).
ket ¼ kBhT e DGz=RT ; where kBhT ¼ 6:21 1012 s 1 at T ¼ 298K
Equation 5.6
When the curves for the radical ion pair (A D þ ) are moved up or down to represent some change in DetG , the geometric position of the crossing points (marked by circles in Figure 5.2) depends on the reorganization energy l and on the free energy of electron transfer DetG (Equation 5.7).
DGz ¼ |
l |
1 þ |
DetG |
|
2 |
4 |
l |
|
Equation 5.7 Classical Marcus relationship for the activation free energy of electron transfer
Electron Transfer |
189 |
By inserting Equation 5.7 into Equation 5.6, one obtains the inverted parabola predicted by classical Marcus theory for the rate constants ket (Figure 5.2, right). The left-hand side of the curve, DetG < l, where ket decreases with decreasing DetG , has been called the Marcus inverted region. Clearly, the rate of diffusion will limit the electron transfer rate constants, as shown by the dotted horizontal line in Figure 5.2. However, for highly exergonic reactions, the decrease should reappear.
The existence (or non-existence) of an inverted region is not a matter of purely academic interest. Back electron transfer or return electron transfer (RET) presents a challenge to all attempts to store photoinduced charge separation as an electrochemical driving force, for example in photosynthesis (Special Topic 6.25) or in photovoltaic cells (Special Topic 6.31). RET from the initially formed ion pair (A D þ ) to the ground-state contact pair (A D) is an energy-wasting process; the electrochemical potential is dissipated as heat. The rate constants of (usually unwanted) RET processes that lie deeply in the inverted region are, therefore, a decisive factor for the efficiency of any solar energy storage device.
Clear-cut experimental evidence for the existence of an inverted region was provided in 1984 by the work Miller et al.352 on long-distance intramolecular electron transfer in the rigidly linked bichromophoric radical anions 9 (Figure 5.4), which were generated by pulsed electron injection. The electrons are initially captured with nearly equal probability by either the donor chromophore biphenyl or the acceptor chromophore mounted on the other side of the saturated 5a-androstane spacer. Electron transfer rates to attain equilibrium were determined by time-resolved observation of the ensuing absorbance changes.
The temperature dependence of the electron transfer rates in compounds 9 was subsequently measured in the range of 170–373 K.353 The rate constants of the compound with 2-naphthyl as an electron acceptor exhibited an Arrhenius-type dependence, as expected for an essentially thermoneutral reaction with an activation energy of l/4, but those with the 2-benzoquinonyl and 5-chloro–2-benzoquinonyl acceptor groups were essentially independent of temperature. It became clear that Marcus s prediction of aninverted region had been right, but for the wrong reason.
Figure 5.4 Intramolecular electron transfer rate constants of 9 in 2-methyl-THF. Adapted by permission from ref. 352. Copyright American Chemical Society
190 |
Photochemical Reaction Mechanisms and Reaction Intermediates |
The decrease in electron transfer rate constants in the inverted region is not due to the reappearance of a barrier, as shown for the lowest (dotted) parabola in Figure 5.2 (left). Rather, exergonic electron transfer should be considered as a radiationless transition. The rate dependence on the free energy difference DetG in the inverted region is just another manifestation of the energy gap law (Section 2.1.5), which predicts decreasing rates with
increasing energy gaps. Theoretical treatments of electron-transfer reactions in the inverted region that in the meantime had been recast354,355 in terms of Fermi s golden rule
(Equation 2.21), are in agreement with these findings and many detailed experimental studies have since established these relationships.340,356–359
The connection between electron transfer and triplet–triplet energy transfer is of interest.360 A quantum mechanical treatment of triplet energy transfer due to Dexter describes triplet energy transfer as a synchronous, dual exchange of electrons (Section 2.2.2, Figure 2.17). This has been verified experimentally:360 rate constants of the separate electron transfer processes and also of triplet–triplet energy transfer were measured for a series of bichromophoric compounds D–sp–A (sp for spacer) in experiments similar to those described above for compounds 9. The rate constants for the reactions D. –sp–A ! D–sp–A. (electron transfer, ket), D. þ –sp–A ! D–sp–A. þ ( hole transfer , kht) and 3D sp A ! D sp 3A (triplet energy transfer, kTT) with A ¼ 2-naphthyl and various donor chromophores D each varied over several orders of magnitude. Remarkably, the rate constants for triplet energy transfer, which varied over five orders of magnitude (105–1010 s 1), were in excellent agreement with those calculated as kTT ¼ Cketkht with C ¼ 4 10 10 s.
The phenomenon of intramolecular electron transfer is observed not only in bior polychromophoric systems that are connected through a saturated spacer such as compounds 9, but also in systems where the donor and acceptor groups are formally conjugated. The first clearly recognized361 and most investigated362 example is that of 4- (N,N-dimethylamino)benzonitrile (DMABN, Scheme 5.2), which emits two fluorescence bands, whose position and relative intensity depend strongly on solvent polarity (dual fluorescence). Absorption initially populates the so-called locally excited (LE) states, because the oscillator strengths of charge-transfer transitions are very low.a The subsequent formation of intramolecular charge transfer (CT) states is often associated with small energy barriers indicating some structural changes. Charge separation occurs even in symmetrical compounds such as 9,90-bianthryl (BA). The dipole moments of the CT states are usually huge, on the order of 10–30 D, consistent with the near-complete charge separation in the CT state. The large dipole moments of CT states are responsible for the large solvatochromic shifts of the fluorescence emission from CT states.
|
Me |
|
NC |
N |
BA |
|
Me |
DMABN
Scheme 5.2 Prototype conjugated bichromophoric compounds undergoing intramolecular charge transfer
aThe transition moment, Equation 4.20, is not related to the change in dipole moment upon exitation. If the orbitals Ci and Cj do not overlap in space, then Mel,i!j¼0.

Electron Transfer |
191 |
An extensive review of such systems focusing on the structural changes associated with intramolecular electron transfer has appeared.363 The much-debated structural issue led to a somewhat confusing multitude of acronyms that are used in discussions of these phenomena: Twisted intramolecular charge transfer (TICT), planar intramolecular charge transfer (PICT) and simply intramolecular charge transfer state (ICT). The conversion from LE to ICT states is generally very fast (<1 ps) and, due to the associated sudden increase in polarity, such compounds are useful as probes to study solvent relaxation dynamics.364 The acronym ICT should be used in the absence of clear-cut information about structural changes associated with CT.
The radical ion pairs generated by photoinduced electron transfer have several options for further reaction (Section 5.4.3).341,365
Special Topic 5.1: Electron transfer in biopolymers
Over the last two decades, thousands of studies have been devoted to the biologically important process of electron transfer (ET) in DNA and peptides. Some proteins transport charge over long distances.366 For example, in the enzyme ribonucleotide, which plays an essential role in DNA replication and repair by providing all of the monomeric precursors (deoxynucleotides) required for these processes, a tyrosine radical is generated 3.5 nm away from the site where ribonucleotide is reduced to deoxyribonucleotide. To measure rate constants of ET, the reaction is typically initiated with a short pulse of light. Site-selective charge injection is required to determine the dependence of ET rates on the structure of the biopolymer. In redox-labelled metalloproteins, a small-molecule oxidant or reductant and a chromophore for photoexcitation are attached covalently to a polypeptide side-chain of a redox protein. In enzymes that include a haem cofactor, Fe may be replaced with Zn, thus permitting the ET reaction to be photoinitiated by production of the excited state of Zn porphyrin of the modified cofactor (see also Section 6.4.4). Another method to study fixeddistance ET in biology relies on the modification of a cofactor in a multicofactor protein or enzyme. The archetype here is the bacterial reaction centre.
DNA damage may be induced by oxidation of a nucleobase due to oxidative stress or UV irradiation. In duplex DNA, the resulting positive charge ( electron hole ) can migrate over distances of several nanometres before reaction with water and oxygen takes place yielding mutagenic products such as 8-oxoguanine. This long-distance hole transfer might serve to protect the coding areas of DNA against oxidative stress. The intercalation of a donor and an acceptor along the DNA chain has been used to study ET rates (Case Study 6.31). Alternatively, a DNA base, typically
guanine, acts as the electron donor to an excited acceptor such as stilbenedicarboxamide (two-point attachment, hairpin)367–370 or anthraquinone371,372 incorporated at
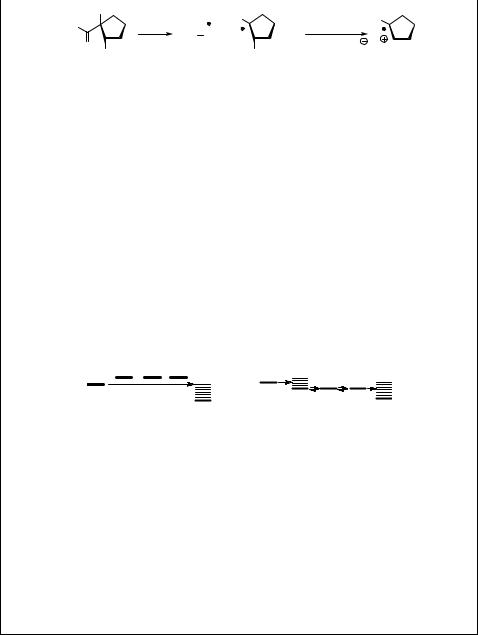
the end of the DNA strand. Tetrahydrofuranyl radicals carrying a phosphate leaving group in the b-position undergo rapid heterolytic cleavage yielding dihydrofuranosyl radical cations (Scheme 5.3). The system has been utilized for charge injection at defined positions in DNA and peptides to study long-distance electron transfer reactions.373–376
192 |
Photochemical Reaction Mechanisms and Reaction Intermediates |
||||
|
|
|
R |
R |
R |
|
Ph |
|
hν |
||
|
|
Ph CO + |
|
||
|
|
O |
|
- (EtO)2PO2 |
|
|
|
OPO(OEt)2 |
|
||
|
|
|
|
OPO(OEt)2 |
|
Scheme 5.3
Initial controversies377 regarding the long-range conductivity properties and wiretype behaviour of DNA have been settled and it is now established that charge transport
in biopolymers does occur on fast time scales and over large distances, following different mechanistic regimes (Scheme 5.4).367,378,379 Over short distances, ET occurs
by the so-called superexchange mechanism. Here, the rate constant is calculated by Fermi s golden rule (Equation 2.21). The rate constant is expected to fall off exponentially with increasing distance r between the electron donor D and the acceptor A, ket / exp( br). The parameter b was calculated to be on the order of (14 2) nm 1. Thus, ET by superexchange becomes negligible for distances on the order of 1 nm. For ET traversing many base pairs, the hopping mechanism comes into play. Here, the heterocyclic bases of DNA act as charge carriers for hole migration, particularly guanine, which has the lowest oxidation potential. The distance dependence of the holetransfer process is significantly influenced by the DNA sequence.380 Adjacent guanine
pairs (GG) and triplets (GGG) act as hole traps. In peptides, the aromatic side-chains of amino acids act as intermediate charge carriers.373–376 Long-distance electron transport
through the biopolymers DNA and proteins occurs in a multistep hopping reaction.
D* |
D* |
A |
superexchange A |
hopping |
Scheme 5.4 Superexchange and hopping mechanisms of charge transfer
The distance dependence of the individual hopping steps is smaller in DNA than in peptides because DNA is more efficient than the peptides as a mediator of the charge transport. On the other hand, peptides are more flexible than DNA double strands and the distances between side-chains of amino acids in peptides can be reduced by conformational changes. The influence of peptide sequence and tertiary structure still remains to be investigated in detail. Investigations of ribonucleotide reductase, DNA photolyase and photosystem II point to the importance of aromatic amino acids such as tyrosine and tryptophan for ET in these proteins.
The electrical current across a few DNA molecules at least 600 nm long has been measured as a function of the potential applied.381
5.3 Proton Transfer
The acidity of excited molecules often differs substantially from that in the ground state and the ionization of excited acids may occur adiabatically (Section 2.3), yielding the
|
|
|
|
|
|
Proton Transfer |
|
|
|
|
|
|
|
|
193 |
|
G |
|
∆ionGm(AH*) = 2.3RT pKa* |
|
|
|
|
|
|
|
|
|
|||||
S1(AH) |
|
|
|
|
|
|
|
|
|
|
|
|
|
|||
|
|
|
|
G (AH) ≈ N E |
|
|
|
|
|
S1(A–) |
|
|
||||
|
∆ |
|
|
|
|
|
|
|
|
|||||||
|
|
|
|
|
|
|
|
|
|
|||||||
|
|
exc |
(AH) |
|
|
∆ |
exc |
G (A–) ≈ N E |
(A–) |
|||||||
|
|
|
|
m |
A |
0–0 |
|
|
|
|
|
m |
A |
0–0 |
||
|
|
|
|
|
∆ionGm(AH) = 2.3RT pKa |
|
|
|
|
S |
|
– |
|
|
||
|
|
|
|
|
|
|
|
|
|
|
|
|
(A ) |
|
|
|
|
|
|
|
|
|
|
|
|
|
|
|
0 |
|
|
|
|
S0(AH) |
|
|
|
|
|
|
|
A– + H+ |
|
|
|
|
||||
|
|
|
|
|
|
|
|
|
|
|
||||||
HA |
|
|
|
|
|
|
|
|
||||||||
Figure 5.5 Forster€ cycle
conjugate base in its excited state. Acidity constants Ka* of the excited singlet states can be determined from a thermodynamic cycle that makes use of the acidity in the ground state, pKa, and the absorption spectra of the acid and its conjugate base. This cycle is named after Theodor F€orster, who first used it to interpret his observations of fluorescence from the conjugate bases of phenols and aromatic amines after excitation of the neutral compounds. The F€orster cycle for an acid AH and its conjugate base A is shown in Figure 5.5.
The molar free energy change for the ionization of the acid AH in aqueous solution is DionGm(AH, aq) ¼ Gm(A , aq) þ Gm(H þ , aq) – Gm(AH, aq). For convenience, we set pH ¼ 0, so that Gm(H þ , aq) :0 and drop the label aq (aqueous solution). The molar free energy change for the ionization of the electronically excited acid AH is then given by the thermodynamic cycle (Equation 5.8), where DionGm(AH ) ¼ RTln(10)pKa and DionGm(AH) ¼ RTln(10)pKa are the free energies of ionization of the acid HA in its excited and ground state, respectively, and DexcGm(AH) and DexcGm(A ) are the excitation free energies of AH and A , respectively.
DionGmðAH*Þ DionGmðAHÞ ¼ DexcGmðA Þ DexcGmðAHÞ
Equation 5.8
In order to place the transition energies E0–0(AH) and E0–0(A ), which are determined from the absorption spectra of AH and A , on the free energy scale, we ignore volume and entropy effects, that is, we assume that the changes in volume and entropy associated with ionization in the ground state, DionVm(AH) and DionSm(AH), are similar to those in the excited state (Equation 5.9).
DionVmðAHÞ DionVmðAH*Þ and DionSmðAHÞ DionSmðAH*Þ
Equation 5.9
With the general relation DG ¼ DU þ pDV – TDS, the excitation free energies on the right-hand side of Equation 5.8 can now be replaced by the excitation energies, DionGm(AH ) DionGm(AH) DexcUm(A ) DexcUm(AH) ¼ NA[E0–0(A ) – E0–0(AH)]. Insertion of the Einstein Equation 1.4, Ep ¼ hc~v, yields Equation 5.10.
194 Photochemical Reaction Mechanisms and Reaction Intermediates
pK* |
¼ |
pK |
a þ |
21:0 |
|
~v0 0ðA Þ |
|
~v0 0ðAHÞ |
|
||||
a |
|
|
|
m |
m 1 |
m |
|
1 |
|||||
|
|
NAhc |
|
|
|
m |
|
|
|||||
|
|
|
|
|
|
|
|
|
|
||||
where |
|
106mm 1 ¼ 21:0 for T ¼ |
298 K |
||||||||||
RT ln 10 |
|||||||||||||
|
|
Equation 5.10 |
Forster€ |
equation |
|
||||||||
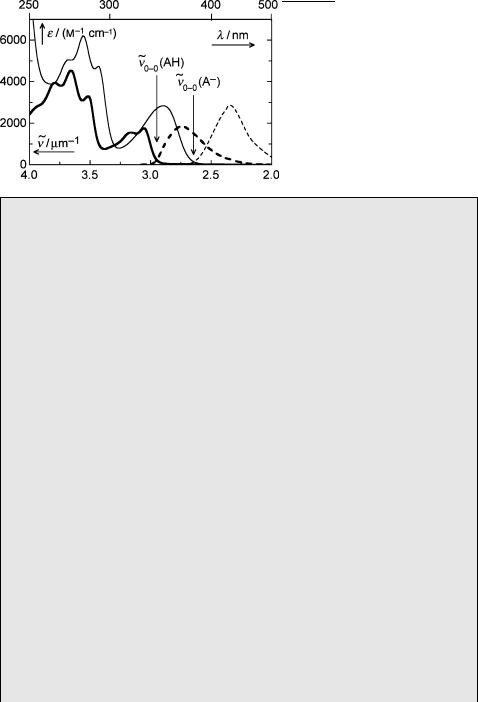
The errors associated with the approximations of Equation 5.9 are negligible in practice. Much more important are uncertainties associated with estimating the wavenumbers ~v0 0 from diffuse absorption spectra. In the absence of well-defined 0–0 bands, the positions of the 0–0 transitions of AH and A are best estimated as the intersection points of the corresponding absorption and fluorescence spectra when the intensity of the fluorescence spectrum is set equal to the maximum of the absorption spectrum (Figure 5.6).
Case Study 5.1: Mechanistic photochemistry – adiabatic proton transfer reactions of 2-naphthol and 4-hydroxyacetophenone
F€orster first observed the adiabatic deprotonation of 2-naphthol (10) in the excited singlet state and thereby exemplified the use of Equation 5.10. The absorption and fluorescence emission spectra of 10 in aqueous acid and base are shown in Figure 5.6. The ground state acidity constant of 10 was determined by spectrophotometric titration, pKa ¼ 9.5.
The wavenumbers of the 0–0 transitions for the acid, AH, and the base, A , estimated from the intersection points of the corresponding absorption and fluorescence spectra, are ~v0 0(AH) ¼ 2.95 mm 1 and ~v0 0(A ) ¼ 2.65 mm 1. By inserting these data into Equation 5.10 we obtain pKa ¼ 3.2 for the acidity constant of 10 in the excited singlet state. Thus the acidity of 10 is predicted to increase by over six orders of magnitude upon excitation to the lowest singlet state. The prediction was tested by a fluorescence titration: The relative fluorescence intensity at the emission
Figure 5.6 Absorption (solid) and fluorescence (dashed) spectra of 2-naphthol (10) in aqueous acid (0.1 M HClO4, thick lines) and aqueous base (0.1 M KOH, thin lines)

Proton Transfer |
195 |
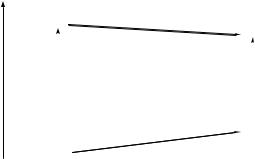
Figure 5.7 Fluorescence titration of 2-naphthol (10)
maximum of the acid AH, lmax ¼ 355 nm, and of the base A , lmax ¼ 425 nm, was measured as a function of pH (Figure 5.7).
The acidity constants calculated by the F€orster cycle are thermodynamic values. However, the acid–base equilibrium is rarely established fully during the lifetime of the excited singlet states of acid and base. At pH values well below the ground-state pKa, only AH is excited. The fluorescence of AH drops and that of A rises around pH 3, indicating that adiabatic deprotonation of 1AH* forming 1A * occurs (Figure 5.7). However, the fluorescence of AH is reduced by only about 30% at pH > 3 and an equivalent amount of fluorescence from 1A * appears. The emission from AH disappears completely only when the pH exceeds the pKa of AH in the ground state, so that only 1A is excited. Hence the rate constants of fluorescence and of adiabatic ionization of 1AH* are of comparable magnitude.
The sharply increased acidity of phenols in the excited state can be used to lower the pH of aqueous solutions by a pulsed light source within nanoseconds (photoacid). However, the equilibrium is rapidly re-established in the ground state by diffusioncontrolled recombination of the released protons with the basic phenolates.
Adiabatic protolytic equilibria in the triplet state are generally fully established due to the intrinsically longer lifetimes of triplets. Soon after F€orster s work, Jackson and Porter determined the acidity of 2-naphthol (10) in the triplet state by flash photolytic titration.382 The triplet–triplet absorption of 10 changes from lmax ¼ 432 to 460 nm as the pH is moved above the triplet pKa (10) of 8.1. Triplet state acidity can also be predicted using the F€orster cycle. The triplet excitation energies ET of the acid and its conjugate base are determined from the 0–0 bands of their phosphorescence spectra.
4-Hydroxyacetophenone (11) is an interesting example of proton transfer in the triplet state,383 because the basicity of its carbonyl group increases strongly upon excitation. The pKa of 11 in the ground state is 7.9. Pump–probe absorption spectra of 11 in aqueous solution, pH < 7, reveal that ISC to the triplet state 311 (lmax ¼ 395 nm) is very fast, kISC ¼ 2.7 1011 s 1. Subsequent ionization of 311 to the anion 311 (lmax ¼ 405 nm) occurs within 50 ns at pH > 3.6. The latter is, however, rapidly re-protonated at the carbonyl oxygen at pH 4. After equilibration (200 ns), one observes the triplet–triplet absorption of the enol 12 (lmax ¼ 360 nm). The triplet–triplet absorption of 311 (lmax ¼ 405 nm) is long-lived when the pH is raised above 7, above the pKa of 12.