

vk.com/id446425943
Mid-cycle cash generation offers supportive yields
Some miners offer attractive FCF yields at mid-cycle earnings
Renaissance Capital
1 April 2019
Metals & Mining
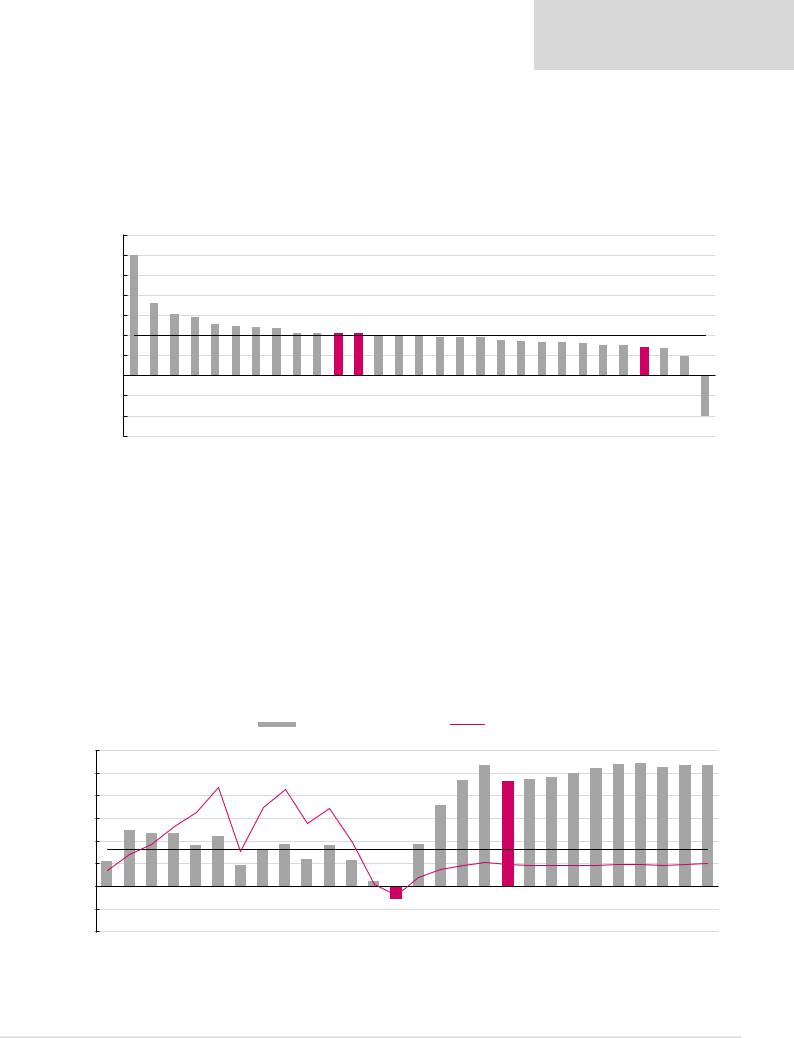
We believe our mid-cycle margin assumptions present capital barriers to mining investment, given their resulting low returns on replacement cost. However, given that some miners’ market values are still below estimated replacement cost, our conservative mid-cycle margin and return forecasts result in what we see as supportive cash flow returns on investment for some companies, taking account of limited reserve lives.
Figure 40: CY21E FCF yields calculated using our mid-cycle commodity price assumptions
|
35% |
30%+ |
|
|
|
|
|
|
|
|
|
|
|
|
|
|
|
|
|
|
|
|
|
|
|
|
|
|
|
|
|
30% |
|
|
|
|
|
|
|
|
|
|
|
|
|
|
|
|
|
|
|
|
|
|
|
|
|
|
|
|
|
|
|
|
|
|
|
|
|
|
|
|
|
|
|
|
|
|
|
|
|
|
|
|
|
|
|
|
|
|
|
|
|
25% |
|
18% |
|
|
|
|
|
|
|
|
|
|
|
|
|
|
|
|
|
|
|
|
|
|
|
|
|
|
|
|
20% |
|
15% |
14% |
13% |
12% |
12% |
|
|
|
|
|
|
|
|
|
|
|
|
|
|
|
|
|
|
|
|
|
|
|
|
15% |
|
12% |
11% |
11% |
11% |
10% |
10% |
10% |
10% |
10% |
10% |
10% |
9% |
8% |
8% |
8% |
8% |
|
|
|
|
|
|
||||||
% |
10% |
|
8% |
8% |
7% |
7% |
5% |
|
||||||||||||||||||||||
|
|
|
||||||||||||||||||||||||||||
|
5% |
|
|
|
|
|
|
|
|
|
|
|
|
|
|
|
Required rate of return, 10% |
|
|
|
|
|
|
|
|
|||||
|
|
|
|
|
|
|
|
|
|
|
|
|
|
|
|
|
|
|
|
|
|
|
|
|
|
|
|
|
|
|
|
0% |
|
|
|
|
|
|
|
|
|
|
|
|
|
|
|
|
|
|
|
|
|
|
|
|
|
|
|
|
|
|
-5% |
|
|
|
|
|
|
|
|
|
|
|
|
|
|
|
|
|
|
|
|
|
|
|
|
|
|
|
|
|
|
-10% |
|
|
|
|
|
|
|
|
|
|
|
|
|
|
|
|
|
|
|
|
|
|
|
|
|
|
|
-10%+ |
|
|
|
|
|
|
|
|
|
|
|
|
|
|
|
|
|
|
|
|
|
|
|
|
|
|
|
|
|
|
|
|
|
-15% |
Rusal |
Sibanye |
ARM |
Vale |
Norilsk |
Glencore |
Alrosa |
Assore |
Exxaro |
Polyus |
Diversified* |
Gold* |
Harmony |
Fortescue |
Anglo |
Sasol |
Polymetal |
Gold Fields |
Northam |
Impala |
AngloGold |
Rio Tinto |
BHP |
South32 |
Kumba |
Platinum* |
Amplats |
RBPlats |
Lonmin |
|
|
|||||||||||||||||||||||||||||
*Industry average.
Note: Priced as at market close on 26 March 2019.
Source: Thomson Reuters, Renaissance Capital estimates
Some perspective – how cheap were the miners in 2016?
We take the chart below from our 20 January 2016 report The long (term value) and short (term risks) of it. While we were using far more conservative commodity price, margin and return assumptions for the miners (normalised RoE of 4.8% vs our more optimistic current forecast of 7.8%), we calculated the sector average earnings yield at over 20%. Since then, our long-term return forecasts have almost doubled, while the yields we calculated have almost halved…
Return forecasts have almost doubled, while yield potential has almost halved…
Figure 41: Mining sector earnings yield and RoE over time*
|
|
|
|
|
|
|
|
|
|
Earnings yield |
|
|
|
|
|
RoE at replacement cost |
|
26.9% |
27.1% |
|
26.8% |
26.7% |
||||||
30% |
|
|
|
|
|
|
|
|
|
|
|
|
|
|
|
|
23.4% |
26.6% |
23.2% |
23.6% |
24.1% |
24.9% |
25.9% |
26.3% |
||||
25% |
|
|
|
|
21.8% |
|
21.4% |
|
|
|
|
|
|
18.0% |
||||||||||||||
|
|
|
|
|
|
|
|
|
|
|
|
|||||||||||||||||
20% |
|
|
|
|
|
|
|
|
|
|
|
|
|
|
|
|||||||||||||
|
12.2% |
11.6% |
11.8% |
|
|
|
|
|
|
17.2% |
|
|
|
|
|
|
|
|
|
|
|
|
|
|
|
|
|
|
|
|
|
11.1% |
|
|
|
|
|
|
|
|
|
|
|
|
|
|
|
|
|
|
|
|
|
||||
15% |
|
9.0% |
|
8.2% |
9.2% |
|
8.9% |
|
|
|
9.3% |
|
|
|
|
|
|
|
|
|
|
|
|
|
||||
10% |
5.4% |
4.5% |
6.0% |
5.7% |
|
|
|
|
|
Average 2003-15E, 8.0% |
|
|
|
|
|
|||||||||||||
|
|
|
|
|
|
|
|
|
|
|
|
|
|
|
||||||||||||||
5% |
1.0% |
|
|
|
|
|
|
|
|
|
|
|
|
|
|
|||||||||||||
|
|
|
|
|
4.8% |
|
|
|
|
|
|
|
|
|||||||||||||||
0% |
|
|
|
|
|
|
|
|
|
|
|
|
|
|
|
|
|
|
|
|
|
|
|
|
|
|
||
|
|
|
|
|
|
|
|
|
|
|
|
|
|
-2.0% |
|
|
|
|
|
|
|
|
|
|
|
|
|
|
|
|
|
|
|
|
|
|
|
|
|
|
|
|
-2.6% |
|
|
|
|
|
|
|
|
|
|
|
|
|
|
-5% |
|
|
|
|
|
|
|
|
|
|
|
|
|
|
|
|
|
|
|
|
|
|
|
|
|
|
|
|
|
|
|
|
|
|
|
|
|
|
|
|
|
|
|
|
|
|
|
|
|
|
|
|
|
|
|
|
|
-10% |
2003 |
2004 |
2005 |
2006 |
2007 |
2008 |
2009 |
2010 |
2011 |
2012 |
2013 |
2014 |
2015E |
2016E |
2017E |
2018E |
2019E |
2020E |
2021E |
2022E |
2023E |
2024E |
2025E |
2026E |
2027E |
2028E |
2029E |
2030E |
|
||||||||||||||||||||||||||||
*Mean for the 19 miners under coverage.
Source: Company data, Renaissance Capital estimates
22