

- •Contents
- •Revisions to our forecasts, TPs and ratings
- •Investment stance
- •Capital cycle favours rising returns
- •Comfortable balance sheets and supportive dividend potential
- •Value relative to other stocks
- •Yield potential through the cycle
- •Mid-cycle cash generation offers supportive yields
- •Where to hide if you are bearish
- •What to buy if you are bullish
- •Limited lives weighing down IRR
- •Yields should compensate for limited lives
- •Positive earnings momentum continues to support share prices
- •Commodity price revisions
- •Commodity section
- •Commodity section
- •Preference for base metals over steelmaking materials
- •Earnings revisions
- •Risks and catalysts
- •Peer comp charts
- •Commodity price and exchange rate forecasts
- •Important publications
- •African Rainbow Minerals
- •Alrosa
- •Anglo American
- •Assore
- •Exxaro
- •Glencore
- •Kumba Iron ore
- •NorNickel
- •Rio Tinto
- •Rusal
- •Vale
- •Gold Fields
- •Harmony
- •Polymetal
- •Anglo American Platinum
- •Lonmin
- •Northam
- •Royal Bafokeng Platinum
- •Sasol
- •Disclosures appendix

vk.com/id446425943
Anglo American Platinum – HOLD
Renaissance Capital
1 April 2019
Metals & Mining
Figure 130: Anglo American Platinum, ZARmn (unless otherwise noted)
|
|
|
|
Anglo American Platinum |
AMSJ.J |
Target price, ZAR: |
780 |
Market capitalisation, ZARmn: |
215,866 |
Last price, ZAR: |
795 |
Enterprise value, ZARmn: |
212,840 |
Potential 12-month return: |
2.0% |
Dec-YE |
|
2017 |
2018 |
2019E |
2020E |
2021E |
Income statement |
|
|
|
|
|
|
Revenue |
|
65,671 |
74,582 |
101,921 |
112,129 |
94,596 |
EBITDA |
|
11,985 |
14,503 |
32,201 |
38,440 |
35,879 |
EBIT |
|
8,273 |
10,842 |
27,299 |
33,522 |
30,696 |
Net interest |
|
-951 |
458 |
33 |
451 |
956 |
Taxation |
|
-1,616 |
-2,666 |
-7,653 |
-9,513 |
-8,863 |
Equity accounted income |
|
-380 |
-40 |
0 |
0 |
0 |
Attributable profit |
|
1,944 |
6,817 |
19,518 |
24,203 |
22,482 |
Headline earnings |
|
3,886 |
7,588 |
19,518 |
24,203 |
22,482 |
HEPS, ZAc |
|
1,482 |
2,893 |
7,264 |
9,007 |
8,367 |
Thomson Reuters consensus HEPS, ZAc |
|
|
3,792 |
4,100 |
5,118 |
|
DPS declared, ZAc |
|
349 |
751 |
2,905 |
3,603 |
3,347 |
Breakdown of EBITDA |
|
7,700 |
8,249 |
16,211 |
18,195 |
17,887 |
Mogalakwena |
|
|||||
EBITDA margin |
|
48% |
46% |
61% |
63% |
61% |
Amandelbult |
|
1,173 |
2,031 |
6,621 |
8,825 |
8,913 |
EBITDA margin |
|
10% |
15% |
34% |
42% |
41% |
Unki |
|
823 |
835 |
1,601 |
1,808 |
1,724 |
EBITDA margin |
|
33% |
29% |
41% |
46% |
44% |
Mototolo |
|
267 |
591 |
1,826 |
2,277 |
2,048 |
EBITDA margin |
|
22% |
29% |
47% |
51% |
47% |
Modikwa |
|
361 |
566 |
1,535 |
1,735 |
1,534 |
EBITDA margin |
|
20% |
26% |
45% |
49% |
44% |
Kroondal |
|
646 |
1,052 |
2,506 |
2,888 |
2,607 |
EBITDA margin |
|
20% |
27% |
46% |
51% |
47% |
Third party |
|
2,309 |
2,884 |
3,842 |
4,411 |
2,756 |
EBITDA margin |
|
9% |
10% |
10% |
10% |
11% |
Other |
|
-648 |
-653 |
565 |
1,189 |
1,017 |
EBITDA |
|
11,985 |
14,503 |
32,201 |
38,440 |
35,879 |
Income statement ratios |
|
|
|
|
|
|
EBITDA margin |
|
18% |
19% |
32% |
34% |
38% |
EBIT margin |
|
18% |
19% |
32% |
34% |
38% |
HEPS growth |
|
108% |
95% |
151% |
24% |
-7% |
Dividend payout ratio |
|
47% |
29% |
40% |
40% |
40% |
Input assumptions |
|
|
|
|
|
|
Platinum, $/oz |
|
950 |
880 |
843 |
900 |
966 |
Palladium, $/oz |
|
871 |
1,030 |
1,558 |
1,700 |
1,576 |
Rhodium, $/oz |
|
1,108 |
2,218 |
3,135 |
4,250 |
3,825 |
USD/ZAR |
|
13.31 |
13.24 |
14.28 |
14.40 |
14.49 |
Sales volumes, koz |
|
|
|
|
|
|
Mined platinum |
|
1,417 |
1,303 |
1,508 |
1,404 |
1,434 |
Third party platinum |
|
1,082 |
1,120 |
1,215 |
1,228 |
728 |
Total platinum sales |
|
2,505 |
2,424 |
2,723 |
2,632 |
2,162 |
Volume growth |
|
3.7% |
-3.2% |
12.3% |
-3.3% |
-17.8% |
3PGM breakeven price, $/oz |
|
|
|
|
|
|
Mogalakwena breakeven |
|
502 |
623 |
470 |
502 |
510 |
Amandelbult breakeven |
|
866 |
869 |
801 |
758 |
749 |
Unki breakeven |
|
598 |
692 |
671 |
695 |
697 |
Mototolo breakeven |
|
703 |
637 |
591 |
594 |
645 |
Modikwa breakeven |
|
754 |
729 |
629 |
617 |
683 |
Kroondal breakeven |
|
809 |
824 |
728 |
736 |
784 |
Group (mined production) breakeven |
742 |
773 |
688 |
675 |
684 |
|
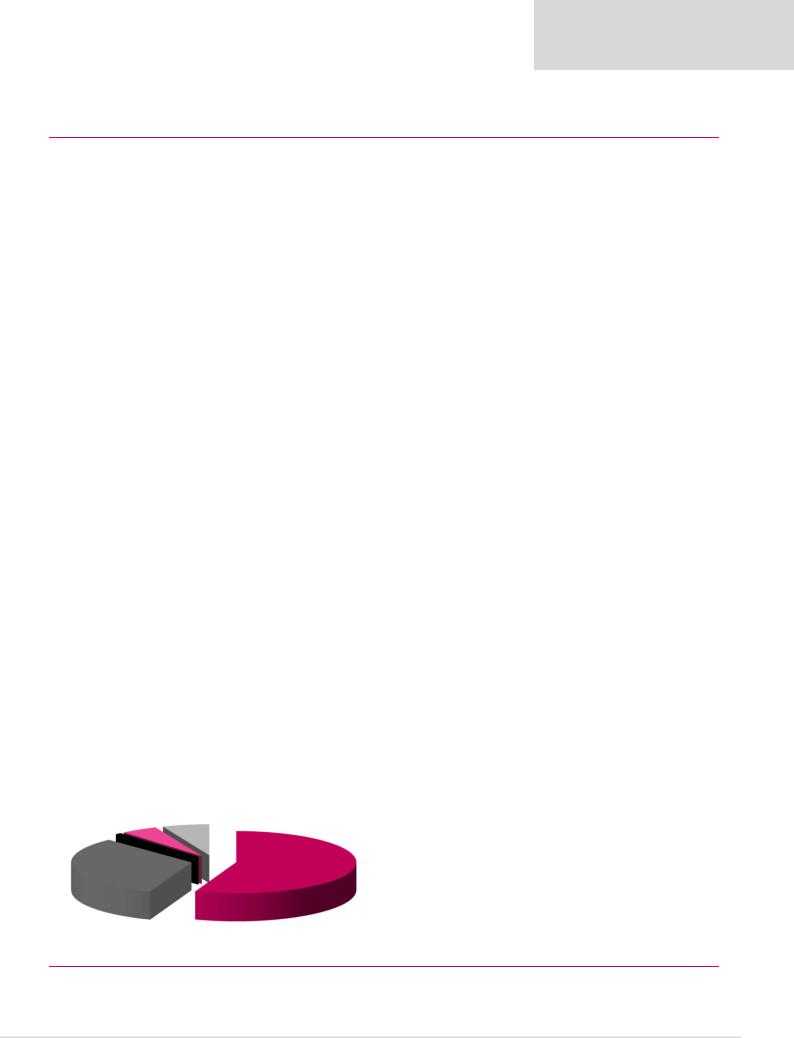
Contribution to FY19E underlying EBITDA |
|
|
|
|
||
|
Third party |
|
|
Amandelbult |
|
|
Kroondal |
11% |
|
|
|
||
|
|
19% |
|
|
||
7% |
|
|
|
|
|
|
|
|
|
|
|
|
|
Mototolo
5%
Modikwa |
Mogalakwena |
|
48% |
||
5% |
||
|
||
Unki |
|
|
5% |
|
Dec-YE |
|
2017 |
2018 |
|
2019E |
2020E |
2021E |
Balance sheet |
|
|
|
|
|
|
|
Net operating assets |
|
40,109 |
41,101 |
|
47,199 |
51,214 |
50,514 |
Investments |
|
2,725 |
2,984 |
|
2,984 |
3,001 |
3,016 |
Equity |
|
41,527 |
47,111 |
|
61,838 |
77,176 |
90,258 |
Minority interest |
|
-526 |
231 |
|
231 |
231 |
231 |
Net debt |
|
1,833 |
-3,257 |
|
-11,886 |
-23,192 |
-36,959 |
Balance sheet ratios |
|
|
|
|
|
|
|
Gearing (net debt/(net debt+equity)) |
|
4.2% |
-7.4% |
|
-23.8% |
-43.0% |
-69.3% |
Net debt to EBITDA |
|
0.2x |
-0.2x |
|
-0.4x |
-0.6x |
-1.0x |
RoCE |
|
16.6% |
22.4% |
|
51.7% |
57.3% |
50.5% |
RoIC (after tax) |
|
11.9% |
19.1% |
|
38.8% |
42.3% |
37.5% |
RoE |
|
9.5% |
17.1% |
|
35.8% |
34.8% |
26.9% |
Cash flow statement |
|
|
|
|
|
|
|
Operating cash flow |
|
8,267 |
14,197 |
|
22,584 |
28,268 |
31,480 |
Capex (net of disposals) |
|
-4,744 |
-6,718 |
|
-8,766 |
-8,858 |
-9,310 |
Other |
|
3,060 |
-1,119 |
|
-200 |
754 |
679 |
FCF |
|
6,583 |
6,360 |
|
13,618 |
20,164 |
22,849 |
Equity shareholders' cash |
|
5,486 |
7,012 |
|
13,420 |
20,170 |
23,167 |
Dividends and share buy backs |
|
0 |
-1,922 |
|
-4,791 |
-8,865 |
-9,399 |
Movement in net debt |
|
5,486 |
5,090 |
|
8,629 |
11,305 |
13,768 |
Cash flow ratios |
|
|
|
|
|
|
|
Working capital turnover, days |
|
52 |
39 |
|
38 |
40 |
33 |
FCF yield |
|
7.3% |
6.2% |
|
6.8% |
10.6% |
13.0% |
Equity shareholders' yield |
|
6.2% |
6.6% |
|
6.3% |
9.5% |
10.9% |
Capex/EBITDA |
|
39.6% |
46.3% |
|
27.2% |
23.0% |
25.9% |
Cash conversion |
|
1.4x |
0.9x |
|
0.7x |
0.8x |
1.0x |
Valuation |
|
|
|
|
|
|
|
SoTP DCF fair value and calculation of target price |
|
|
|
ZARmn |
ZAR/sh |
||
Amandelbult operations |
|
|
|
|
39,120 |
146 |
|
Mogalakwena mine |
|
|
|
|
131,192 |
489 |
|
Twickenham mine |
|
|
|
|
-206 |
-1 |
|
Unki mine |
|
|
|
|
11,181 |
42 |
|
Modikwa |
|
|
|
|
9,021 |
34 |
|
Mototolo |
|
|
|
|
9,993 |
37 |
|
Kroondal |
|
|
|
|
4,665 |
17 |
|
Third party sales |
|
|
|
|
14,279 |
53 |
|
Other |
|
|
|
|
-15,059 |
-56 |
|
Enterprise value |
|
|
|
|
204,185 |
762 |
|
Investments as at 31 December 2018 |
|
|
|
|
2,984 |
11 |
|
Net debt as at 31 December 2018 |
|
|
|
|
3,257 |
12 |
|
Cash used in share buy-backs during 2019E |
|
|
|
|
0 |
0 |
|
Equity value |
|
|
|
|
210,426 |
785 |
|
Rounded to |
|
|
|
|
|
780 |
|
Current share price on 26/3/2019 |
|
|
|
|
|
795.0 |
|
Expected share price return |
|
|
|
|
|
-1.9% |
|
Plus: expected dividend yield |
|
|
|
|
|
3.9% |
|
Total implied one-year return |
|
|
|
|
|
2.0% |
|
Share price range, ZAR: |
|
|
|
|
|
|
|
12-month high |
842 |
12-month low |
|
299 |
|||
Price move since high |
-5.6% |
Price move since low |
|
166.1% |
|||
Calculation of WACC |
|
|
|
|
|
|
|
WACC |
11.4% |
Cost of debt |
|
|
10.0% |
||
Risk-free rate |
9.0% |
Tax rate |
|
|
28% |
||
Equity risk premium |
4.0% |
After-tax cost of debt |
|
7.2% |
|||
Beta |
1.30 |
Debt weighting |
|
40% |
|||
Cost of equity |
14.2% |
Terminal growth rate |
|
6.0% |
|||
Valuation ratios |
|
|
|
|
|
|
|
Dec-YE |
|
2017 |
2018 |
|
2019E |
2020E |
2021E |
P/E multiple |
|
22.4x |
13.7x |
|
10.9x |
8.8x |
9.5x |
Dividend yield |
|
1.1% |
1.9% |
|
3.7% |
4.5% |
4.2% |
EV/EBITDA |
|
7.5x |
7.1x |
|
6.3x |
4.9x |
4.9x |
P/B |
|
2.1x |
2.3x |
|
3.4x |
2.8x |
2.4x |
NAV per share, ZAR |
|
155 |
176 |
|
231 |
288 |
337 |
Source: Bloomberg, Thomson Reuters, Renaissance Capital estimates
84
vk.com/id446425943
Impala Platinum – BUY
Renaissance Capital
1 April 2019
Metals & Mining
Figure 131: Impala Platinum, ZARmn (unless otherwise noted)
|
|
|
|
Impala Platinum |
IMPJ.J |
Target price, ZAR: |
83 |
Market capitalisation, ZARmn: |
52,668 |
Last price, ZAR: |
65 |
Enterprise value, ZARmn: |
61,695 |
Potential 12-month return: |
28.1% |
Jun-YE |
|
|
2017 |
2018 |
2019E |
2020E |
2021E |
Income statement |
|
|
|
|
|
|
|
Revenue |
|
|
40,540 |
39,587 |
54,180 |
66,474 |
64,069 |
Underlying EBITDA |
|
|
3,622 |
5,884 |
14,262 |
21,430 |
21,311 |
Underlying EBIT |
|
|
-474 |
1,684 |
10,430 |
17,702 |
17,998 |
Net interest |
|
|
-400 |
-701 |
-579 |
-13 |
879 |
Taxation |
|
|
2,461 |
2,042 |
-2,678 |
-4,953 |
-5,285 |
Minority interest in profit |
|
122 |
-114 |
-446 |
-770 |
-788 |
|
Attributable profit |
|
|
-7,976 |
-10,907 |
6,334 |
11,966 |
12,803 |
Headline earnings |
|
|
-983 |
-1,228 |
6,256 |
11,966 |
12,803 |
HEPS, ZAc |
|
|
-137 |
-171 |
871 |
1,665 |
1,782 |
Thomson Reuters consensus HEPS, ZAc |
|
|
|
271 |
355 |
596 |
|
DPS declared, ZAc |
|
|
0 |
0 |
0 |
0 |
0 |
Underlying EBIT |
|
|
-1,760 |
-1,083 |
5,159 |
9,200 |
9,166 |
Rustenburg lease |
|
|
|||||
EBIT margin |
|
|
-6% |
-4% |
15% |
21% |
23% |
Zimplats |
|
|
1,169 |
1,911 |
3,342 |
4,952 |
5,204 |
EBIT margin |
|
|
17% |
26% |
36% |
43% |
44% |
Marula |
|
|
-627 |
-6 |
589 |
1,186 |
1,148 |
EBIT margin |
|
|
-39% |
0% |
18% |
30% |
28% |
Mimosa |
|
|
2 |
320 |
430 |
805 |
872 |
EBIT margin |
|
|
0% |
16% |
19% |
28% |
29% |
Two Rivers |
|
|
460 |
419 |
689 |
1,285 |
1,320 |
EBIT margin |
|
|
24% |
23% |
33% |
45% |
44% |
Other |
|
|
282 |
123 |
221 |
274 |
288 |
EBIT |
|
|
-474 |
1,684 |
10,430 |
17,702 |
17,998 |
Income statement ratios |
|
|
|
|
|
|
|
EBITDA margin |
|
|
9% |
15% |
26% |
32% |
33% |
EBIT margin |
|
|
-1% |
4% |
19% |
27% |
28% |
HEPS growth |
|
|
-1242% |
-25% |
609% |
91% |
7% |
Dividend payout ratio |
|
|
0% |
0% |
0% |
0% |
0% |
Input assumptions |
|
|
|
|
|
|
|
Platinum, $/oz |
|
|
988 |
940 |
827 |
875 |
920 |
Palladium, $/oz |
|
|
738 |
977 |
1,272 |
1,663 |
1,663 |
Rhodium, $/oz |
|
|
821 |
1,634 |
2,651 |
3,833 |
4,122 |
USD/ZAR |
|
|
13.60 |
12.85 |
14.18 |
14.40 |
14.41 |
Production volumes, koz |
|
|
|
|
|
|
|
Mined platinum |
|
|
1,121 |
1,048 |
1,193 |
1,144 |
1,004 |
Third party platinum |
|
|
244 |
241 |
180 |
180 |
180 |
Joint venture platinum |
|
|
165 |
180 |
143 |
149 |
149 |
Gross refined platinum |
|
1,530 |
1,468 |
1,516 |
1,473 |
1,333 |
|
Volume growth |
|
|
6.4% |
-4.0% |
3.3% |
-2.8% |
-9.5% |
3PGM breakeven price, $/oz |
|
|
|
|
|
|
|
Rustenburg lease breakeven |
|
1,071 |
1,182 |
966 |
1,002 |
957 |
|
Zimplats breakeven |
|
|
653 |
783 |
664 |
755 |
775 |
Marula breakeven |
|
|
1,201 |
970 |
879 |
977 |
1,030 |
Mimosa breakeven |
|
|
888 |
896 |
945 |
958 |
970 |
Two Rivers breakeven |
|
|
677 |
797 |
769 |
743 |
772 |
Group (mined production) breakeven |
|
895 |
958 |
806 |
812 |
778 |
|
Contribution to FY19E proportionately consolidated underlying EBITDA |
|
||||||
|
Two Rivers |
|
|
|
|
||
Mimosa |
6% |
|
|
Rustenburg Lease |
|||
IRS |
5% |
|
|
|
|
||
|
|
|
|
|
56% |
|
|
1% |
|
|
|
|
|
|
|
|
|
|
|
|
|
|
|
Zimplats
32%
Jun-YE |
|
|
|
|
2019E |
2020E |
2021E |
|
2017 |
2018 |
|
||||
Balance sheet |
|
|
|
|
|
|
|
Net operating assets |
|
51,832 |
45,983 |
|
46,686 |
46,876 |
48,603 |
Investments |
|
-929 |
257 |
|
74 |
75 |
77 |
Equity |
|
46,807 |
37,213 |
|
44,155 |
56,121 |
68,924 |
Minority interest |
|
2,425 |
2,380 |
|
2,487 |
2,487 |
2,487 |
Net debt (including finance leases) |
|
1,671 |
6,647 |
|
118 |
-11,657 |
-22,731 |
Balance sheet ratios |
|
|
|
|
|
|
|
Gearing (net debt/(net debt+equity)) |
|
3.4% |
15.2% |
|
0.3% |
-26.2% |
-49.2% |
Net debt to EBITDA |
|
0.5x |
1.1x |
|
0.0x |
-0.5x |
-1.1x |
RoCE |
|
-0.8% |
3.2% |
|
21.3% |
35.4% |
35.3% |
RoIC (after tax) |
|
-8.5% |
-7.6% |
|
17.8% |
25.6% |
25.5% |
RoE |
|
-1.9% |
-2.9% |
|
15.4% |
23.9% |
20.5% |
Cash flow statement |
|
|
|
|
|
|
|
Operating cash flow |
|
-1,247 |
-1,256 |
|
12,647 |
17,049 |
15,094 |
Capex (net of disposals) |
|
-3,798 |
-5,106 |
|
-4,862 |
-4,492 |
-3,863 |
Other |
|
3,856 |
3,236 |
|
-684 |
0 |
0 |
FCF |
|
-1,189 |
-3,126 |
|
7,101 |
12,556 |
11,231 |
Equity shareholders' cash |
|
846 |
-4,976 |
|
6,529 |
11,775 |
11,074 |
Dividends and share buy backs |
|
0 |
0 |
|
0 |
0 |
0 |
Movement in net debt |
|
846 |
-4,976 |
|
6,529 |
11,775 |
11,074 |
Cash flow ratios |
|
|
|
|
|
|
|
Working capital turnover, days |
|
58 |
73 |
|
53 |
40 |
48 |
FCF yield |
|
-2.9% |
-10.0% |
|
14.4% |
33.6% |
42.7% |
Equity shareholders' yield |
|
2.3% |
-22.3% |
|
14.0% |
25.3% |
23.8% |
Capex/EBITDA |
|
104.9% |
86.8% |
|
34.1% |
21.0% |
18.1% |
Cash conversion |
|
-0.9x |
4.1x |
|
1.0x |
1.0x |
0.9x |
Valuation |
|
|
|
|
|
|
|
SoTP DCF fair value and calculation of target price |
|
|
|
ZARmn |
ZAR/sh |
||
Rustenburg lease |
|
|
|
|
36,671 |
51.0 |
|
Zimplats (effective interest = 87%) |
|
|
|
|
22,424 |
31.2 |
|
Marula (effective interest = 73%) |
|
|
|
|
1,903 |
2.6 |
|
Afplats (effective interest = 74%) |
|
|
|
|
0 |
0.0 |
|
IRS (third party only) |
|
|
|
|
367 |
0.5 |
|
Mimosa (effective interest = 50%) |
|
|
|
|
2,750 |
3.8 |
|
Two Rivers (effective interest = 46%) |
|
|
|
|
6,245 |
8.7 |
|
Chrome operations |
|
|
|
|
393 |
0.5 |
|
Enterprise value |
|
|
|
|
70,752 |
98.5 |
|
Investments as at 30 June 2018 |
|
|
|
|
257 |
0.4 |
|
Net debt as at 30 June 2018 |
|
|
|
|
-6,647 |
-9.2 |
|
Cash used in share buy-backs during 2019E |
|
|
|
|
0 |
0.0 |
|
Convertible bond dilution based on current share price |
|
|
|
-3,497 |
-4.9 |
||
Anticipated indigenization discount of Zimplats and Mimosa |
|
-1,284 |
-1.8 |
||||
Equity value |
|
|
|
|
59,582 |
82.9 |
|
Rounded to |
|
|
|
|
|
83.0 |
|
Current share price on 26/3/2019 |
|
|
|
|
|
64.8 |
|
Expected share price return |
|
|
|
|
|
28.1% |
|
Plus: expected dividend yield |
|
|
|
|
|
0.0% |
|
Total implied one-year return |
|
|
|
|
|
28.1% |
|
Share price range, ZAR: |
|
|
|
|
|
|
|
12-month high |
69 |
12-month low |
|
16 |
|||
Price move since high |
-6.6% |
Price move since low |
|
315.1% |
|||
Calculation of WACC |
|
|
|
|
|
|
|
WACC |
14.8% |
Cost of debt |
|
|
10.0% |
||
Risk-free rate |
9.0% |
Tax rate |
|
|
28% |
||
Equity risk premium |
5.5% |
After-tax cost of debt |
|
7.2% |
|||
Beta |
1.30 |
Debt weighting |
|
15% |
|||
Cost of equity |
16.2% |
Terminal growth rate |
|
0.0% |
|||
Valuation ratios |
|
|
|
|
|
|
|
Jun-YE |
|
2017 |
2018 |
|
2019E |
2020E |
2021E |
P/E multiple |
|
-36.6x |
-18.2x |
|
7.4x |
3.9x |
3.6x |
Dividend yield |
|
0.0% |
0.0% |
|
0.0% |
0.0% |
0.0% |
EV/EBITDA |
|
11.3x |
5.3x |
|
3.4x |
1.7x |
1.2x |
P/B |
|
0.8x |
0.6x |
|
1.1x |
0.8x |
0.7x |
NAV per share, ZAR |
|
64 |
52 |
|
61 |
78 |
96 |
Source: Bloomberg, Thomson Reuters, Renaissance Capital estimates
85