


vk.com/id446425943
Preference for base metals over steelmaking materials
We forecast falling prices for coal, iron ore and manganese over the medium term, given that they are trading above the 90th percentile of cost curves.
We are constructive on base metals, some of which are trading well below the 90th percentile, rendering significant parts of the respective industries cash-burning.
Thematically, from a demand perspective, we also prefer base metals over steelmaking materials (iron ore, metallurgical coal and manganese).
Figure 58: Spot commodity price premium (discount) to 90th percentile
50% |
46% |
|
|
|
% 90th percentile premium (discount) to spot price |
|
|
|
|||||
|
|
|
|
|
|
||||||||
|
|
|
|
|
|
||||||||
|
|
|
|
|
|
|
|
|
|
|
|||
|
35% |
|
|
|
|
|
|
|
|
|
|
||
40% |
|
|
|
|
|
|
|
|
|
|
|
||
30% |
|
|
|
|
|
|
|
|
|
|
|
|
|
|
|
24% |
21% |
|
|
|
|
|
|
||||
|
|
|
|
|
|
|
|
|
|
|
|
||
20% |
|
|
|
|
|
|
|
|
|
|
|
|
|
|
|
|
|
|
|
11% |
|
|
|
|
|
||
|
|
|
|
|
|
|
|
|
|
|
|
||
10% |
|
|
|
|
|
|
|
5% |
|
|
|
|
|
0% |
|
|
|
|
|
|
|
|
|
|
|
|
|
|
|
|
|
|
|
|
|
-3% |
|
|
|
||
-10% |
|
|
|
|
|
|
|
|
-12% |
|
|
||
-20% |
|
|
|
|
|
|
|
|
|
|
|
||
|
|
|
|
|
|
|
|
|
|
-16% |
-19% |
||
|
|
|
|
|
|
|
|
|
|
|
|||
|
|
|
|
|
|
|
|
|
|
|
|
||
-30% |
|
|
|
|
|
|
|
|
|
|
|
|
|
Met. Coal, $214/t |
Iron ore, $85/t |
Gold**, $1316/t |
PGM***, $1282/t |
Manganese ore, $6/t |
Copper, $6338/t |
Zinc*, $2920/t |
Nickel, $12995/t |
Aluminium, $1865/t |
Thermal coal, $74/t |
||||
|
|||||||||||||
*Used commodity/company data for 2017. **Used commodity data for 4Q18.
***PGM basket price calculated using 57% Pt, 36% Pd, 7% Rh. Note: Priced as at 26 March 2019.
Source: Bloomberg, Company data, Renaissance Capital estimates
Renaissance Capital
1 April 2019
Metals & Mining
Some commodities trading above cost support
Our long-term commodity price forecasts are supported by industry costs and we calculate these prices would result in poor industry average returns on new projects (below 9%), which we do not think would incentivise over-supply.
Management focus remains on cash-flow returns and perceived investment risk remains high for lenders.
We calculate incentive prices in the following charts as the commodity price required for a Incentive prices to achieve a 10% IRR project with industry average cash costs and industry average capital intensity to achieve
a 10% IRR.
34

vk.com/id446425943
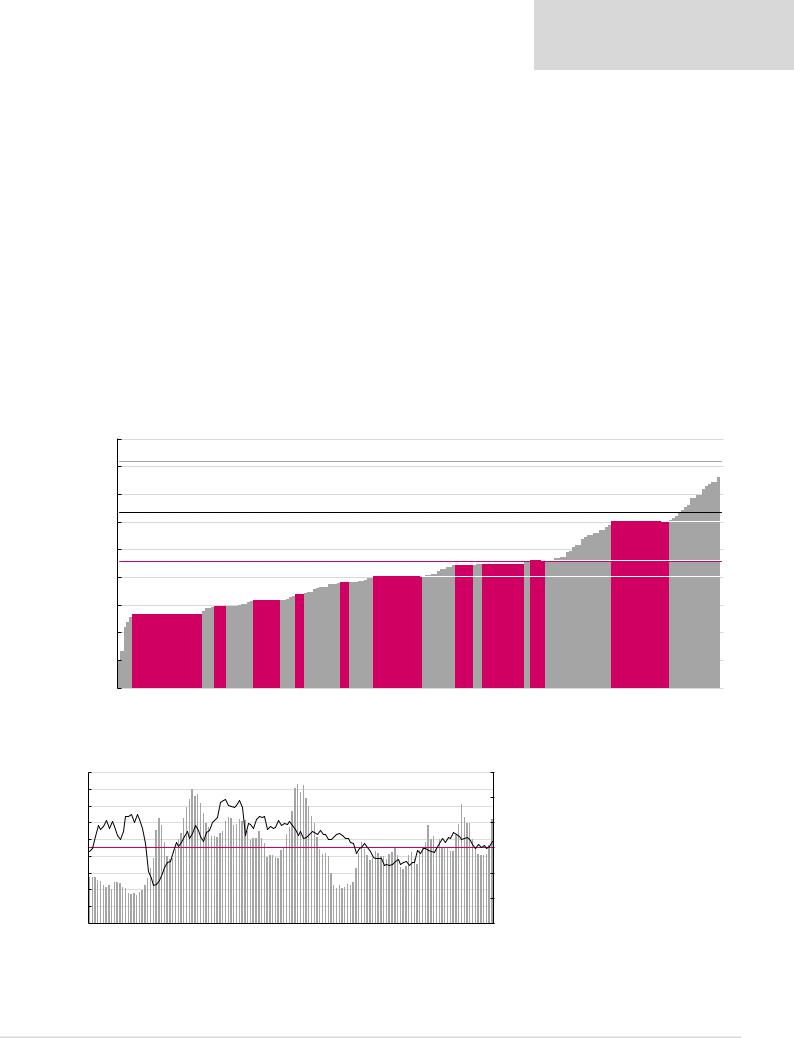
Metallurgical coal
We believe metallurgical coal spot prices of $214/t are unsustainable given our view that prices above $180/t incentivise new supply (10% IRR for average metallurgical coal projects). Lower steel prices could reduce demand for steelmaking materials or result in capacity cuts, which could weigh on metallurgical coal prices.
Renaissance Capital
1 April 2019
Metals & Mining
Lower steel margins could put pressure on steelmaking material prices
Metallurgical coal cost curve (631mnt)
Figure 59: 2018E metallurgical coal cash costs plus sustaining capex, $/t
240
Spot price: $214/t*
200
Incentive price: $180/t
160 |
|
|
|
|
|
|
$/t |
|
|
|
|
|
|
120 |
Average cash cost: $118/t |
|
|
|
AngloAmerican, 125 |
|
|
|
|
Resources,Teck 115 |
Glencore, 123 |
||
80 |
Mechel,90 |
BHP,92 |
Evraz,106 |
|||
|
|
|
|
|
|
|
40 |
|
|
|
|
|
|
*Priced as at 26 March 2019. |
|
|
|
|
|
|
|
186 |
|
Vale, |
|
173 |
90th percentile: $147/t |
Severstal, |
|
|
70th percentile: $125/t |
|
50th percentile: $117/t |
|
South32, 143 |
|
Source: Bloomberg, CRU, Renaissance Capital estimates (in pink)
We believe spot metallurgical coal prices make the entire industry cash-flow positive. We see no risk of capacity cuts.
Figure 60: Percentage of metallurgical coal cost curve that is cash-burning over time
% Cash burning |
|
Hard coking coal - spot, $/t |
Average LT cash burn |
|
350 |
|
|
|
|
|
|
330 |
|
|
|
84.0% |
81.0% |
|
|
|
|
90% |
|
|
|
|
|
|
|
|
|
|
|
|
|
|
||||
|
|
|
|
305 |
|
|
|
|
|
|
|
|
|
|
|
||
|
|
|
|
|
|
|
|
|
|
|
|
|
|
|
|
|
|
300 |
|
|
66.0% |
|
|
|
|
|
|
|
|
|
|
|
|
|
80% |
|
|
|
|
|
|
|
|
|
|
|
|
266 |
|
|
|
||
|
|
|
|
|
|
|
|
|
|
58.5% |
|
|
|
|
|
||
|
|
|
|
|
|
|
|
|
|
|
55.5% |
|
|
|
70% |
||
250 |
|
|
|
|
|
|
|
|
51.0% |
|
|
|
214 |
60% |
|||
|
|
|
|
|
|
|
|
|
|
|
|
||||||
|
|
|
|
|
|
|
|
|
|
|
|
|
|
||||
200 |
|
|
|
|
|
|
|
|
34.5% 34.0% |
|
|
|
|
|
|
|
50% |
|
|
|
|
|
|
|
|
|
|
|
|
|
|
|
|
||
150 |
|
|
|
|
|
|
|
|
29.0% |
|
|
|
|
|
188 |
40% |
|
|
|
|
|
|
|
|
|
|
|
|
|
|
|
||||
$/t |
|
|
|
|
|
|
|
|
|
|
|
|
|
|
|
||
100 |
|
|
14.5% 14.5% 14.5% |
|
12.5% |
|
|
|
|
17.5% |
|
|
|
|
|
|
30% |
|
|
98 |
|
|
|
|
|
|
|
|
|
|
|
||||
|
5.5% 6.0% 6.0% 6.0% |
7.5% |
0.0% 0.0% 0.0% 0.0% 8.5% 8.5% 8.5% |
|
|
4.5% 2.0% 1.5% 8.5% 6.0% |
|
|
Average LT cash burn, 12.4% |
20% |
|||||||
50 |
1.5% 1.0% 1.5% 1.0% |
0.0% 0.0% 0.0% 0.5% 1.0% 1.0% |
4.5% |
|
81 |
4.5% |
0.0% 0.5% 0.5% 0.5% |
0.5% |
0.5% 1.0% 1.0% 0.0% 0.5% 0.5% |
10% |
|||||||
|
|
|
|||||||||||||||
|
|
|
|
||||||||||||||
0 |
Mar 06 Jun 06 Sep 06 Dec 06 Mar 07 Jun 07 Sep 07 Dec 07 Mar 08 Jun 08 Sep 08 Dec 08 Mar 09 Jun 09 Sep 09 Dec 09 Mar 10 Jun 10 Sep 10 Dec 10 Mar 11 Jun 11 Sep 11 Dec 11 Mar 12 Jun 12 Sep 12 Dec 12 Mar 13 Jun 13 Sep 13 Dec 13 Mar 14 Jun 14 Sep 14 Dec 14 Mar 15 Jun 15 Sep 15 Dec 15 Mar 16 Jun 16 Sep 16 Dec 16 Mar 17 Jun 17 Sep 17 Dec 17 Mar 18 Jun 18 Sep 18 Dec 18 Mar 19 Spot |
0% |
|||||||||||||||
|
|
||||||||||||||||
Source: Bloomberg, CRU, Renaissance Capital estimates
35
vk.com/id446425943
Renaissance Capital
1 April 2019
Metals & Mining
From a longer-term perspective, we are cautious on coking coal demand and prices:
1.Given our cautious outlook for Chinese steel demand growth; and
2.over the medium term, we expect Chinese steel production to shift from blast furnace to electric arc furnace, which would likely add pressure on coking coal demand and prices.
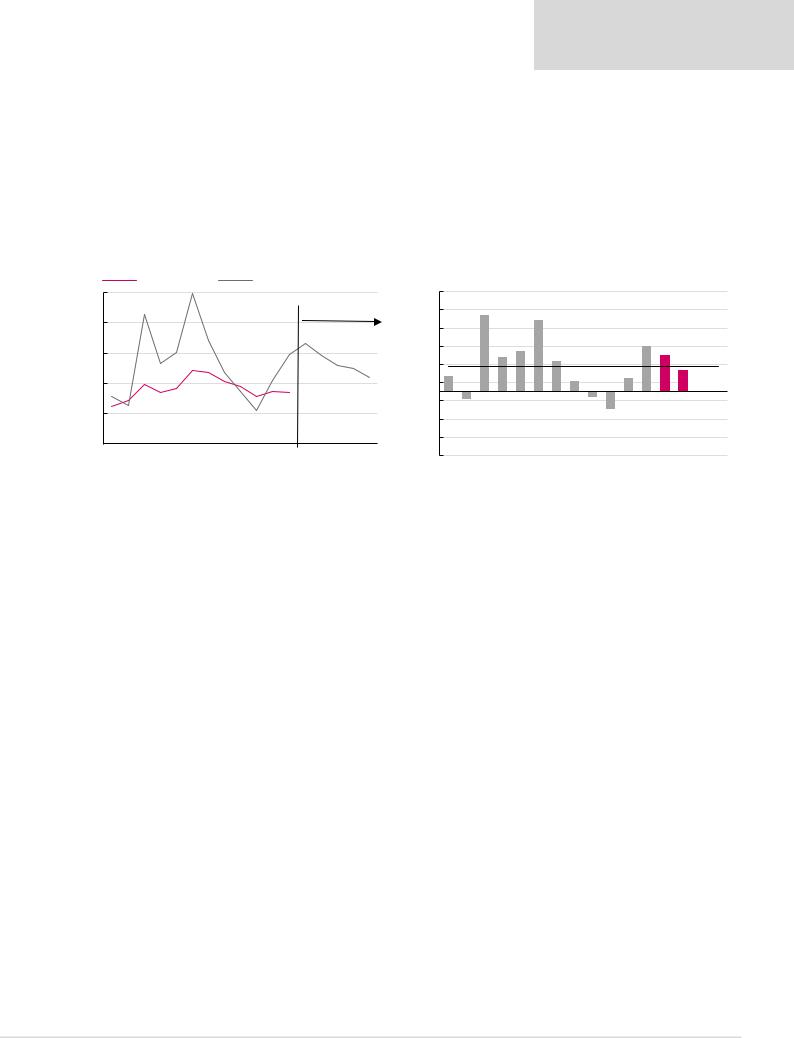
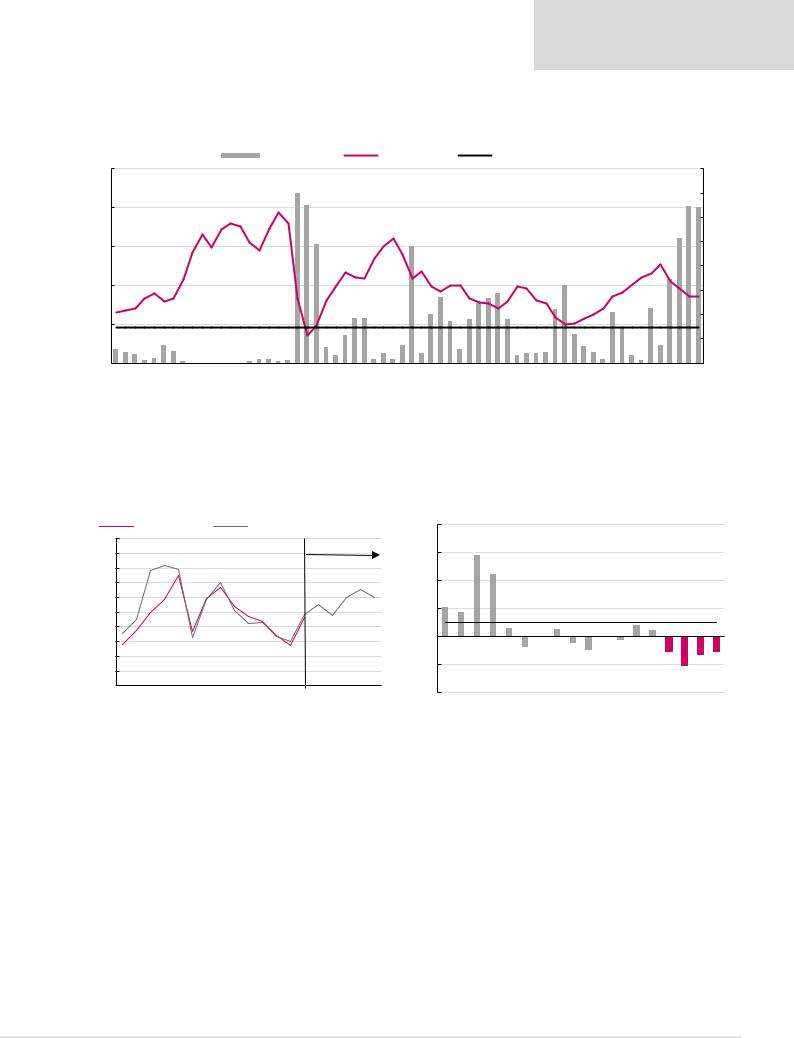
Our long-term metallurgical coal price forecast of $150/t is based on cost support of the 90th percentile of the cost curve.
Figure 61: Met coal price vs cash costs at the 90th percentile |
Figure 62: Met coal price premium (discount) to the 90th percentile |
|
Cash costs, $/t |
Met coal average price. $/t |
|
290 |
|
|
|
|
|
|
|
|
|
|
|
|
|
|
|
|
|
110% |
|
|
|
|
|
|
|
|
|
|
|
|
|
206 |
Forecasts |
|
90% |
||
240 |
101 |
112 |
138 |
125 |
132 |
162 |
158 |
143 |
135 |
118 |
126 |
188 |
187 |
170 |
165 |
150 |
70% |
|
|
||||||||||||||||||
|
|
|
|
|
|
|
|
|
|
|
|
|
|
|
|
|
|
|
190 |
|
|
|
|
|
|
|
|
|
|
|
|
|
|
|
|
|
50% |
|
|
|
|
|
|
|
|
|
|
|
|
|
|
|
|
|
|
|
|
|
|
|
|
|
|
|
|
|
|
|
|
|
|
|
|
|
30% |
140 |
|
|
|
|
|
|
|
|
|
|
|
|
|
|
|
|
|
10% |
|
|
|
|
|
|
|
|
|
|
|
|
126 |
|
|
|
|
|
-10% |
90 |
|
|
|
|
|
|
|
|
|
|
|
|
|
|
|
|
-30% |
|
|
|
|
|
|
|
|
|
|
|
|
|
|
|
|
|
|
|
|
40 |
|
|
|
|
|
|
|
|
|
|
|
|
|
|
|
|
|
-50% |
2006 |
2007 |
2008 |
2009 |
2010 |
2011 |
2012 |
2013 |
2014 |
2015 |
2016 |
2017 |
2018E |
2019E |
2020E |
2021E |
LT (real) |
|
|
|
-70% |
|||||||||||||||||
|
|
|||||||||||||||||
|
|
84% |
|
|
79% |
|
|
|
|
17% |
|
|
38% |
44% |
|
34% |
11% |
Historical |
|
|
|
|
|
|
|
|
|
||
|
-9% |
|
|
|
|
|
|
-7% |
-20% |
2006 |
2007 |
2008 |
2009 |
2010 |
2011 |
2012 |
2013 |
2014 |
2015 |
15% |
49% |
40% |
24% |
average, 28%
2016 |
2017 |
2018E |
2019E |
9% |
3% |
|
|
|
|
|
2020E |
2021E |
|
||
*Cash costs net of by-product credits plus sustaining capex.
Source: Bloomberg, Renaissance Capital estimates |
Source: Bloomberg, Renaissance Capital estimates |
36

vk.com/id446425943
Iron ore
We believe a potential medium-term iron ore deficit following production disruptions in Brazil could support iron ore prices above cost support.
Following the Brumadinho dam rupture, Vale´s iron ore fines annualised production was impacted by the equivalent of about 92.8mn tpa (source: Vale):
1)40mn tpa from Feijão, Vargem Grande and Fábrica complexes, as a result of the following events: (i) on February 4th, 2019 (and again on February 20th, 2019), Vale disclosed its intention to advance the decommissioning process of all upstream dams; (ii) on February 18th, 2019, Brazil’s National Mining Agency (“ANM” – Agência Nacional de Mineração) published the new Resolution No 4 recommending higher dam safety parameters; (iii) on February 20th, 2019, Vale confirmed that Vargem Grande, Grupo and Forquilha I, II and III tailings dams safety parameters could be potentially lower than what the new resolution recommended; and (iv) on February 20th, 2019, ANM promoted inspections to the sites and determined the suspension of activities at the entire Vargem Grande Complex and Fábrica mine; as informed in the press release
“Clarification on the Vargem Grande, Grupo and Forquilha I, II and III dams”, dated March 1st, 2019.
2)30mn tpa from Brucutu mine, following the decision held by the Court of the Comarca of Santa Barbara.
3)12.8mn tpa from Timbopeba mine, following the decision held by the 2nd Civil Court of the Comarca of Ouro Preto, filed by the MPMG, as informed in the press release “Vale on the Timbopeba mine operations”, dated March 15th, 2019.
4)10mn tpa from Alegria mine, following Vale’s decision to temporarily suspend on a preventive basis the Alegria mine operation, as informed in the press release
“Vale informs on operation of the Alegria mine”, dated March 20th, 2019.
On 29 March Vale guided to 2019 iron ore sales of between 307 and 332mnt, a material reduction compared with our forecast of 401mnt in January 2019.
However, we forecast iron ore prices in the longer term.
1)Low-cost supply continues to grow as Vale, Samarco, BHP, Rio Tinto and Minas Rio ramp up.
2)Steel prices have fallen to levels that put pressure on steel company margins. This could lead to capacity curtailments and weigh on demand for steelmaking materials.
3)Chinese iron ore port inventories are still at highly elevated levels of around 38 days of consumption.
4)Steel demand growth could be lacklustre as the Chinese property market cools down and stimulus slows. A decline in Chinese steel intensity per capita to developed consumer economy levels such as the US poses a potential structural headwind over the longer term.
5)We see the potential for scrap substituting iron ore as China matures.
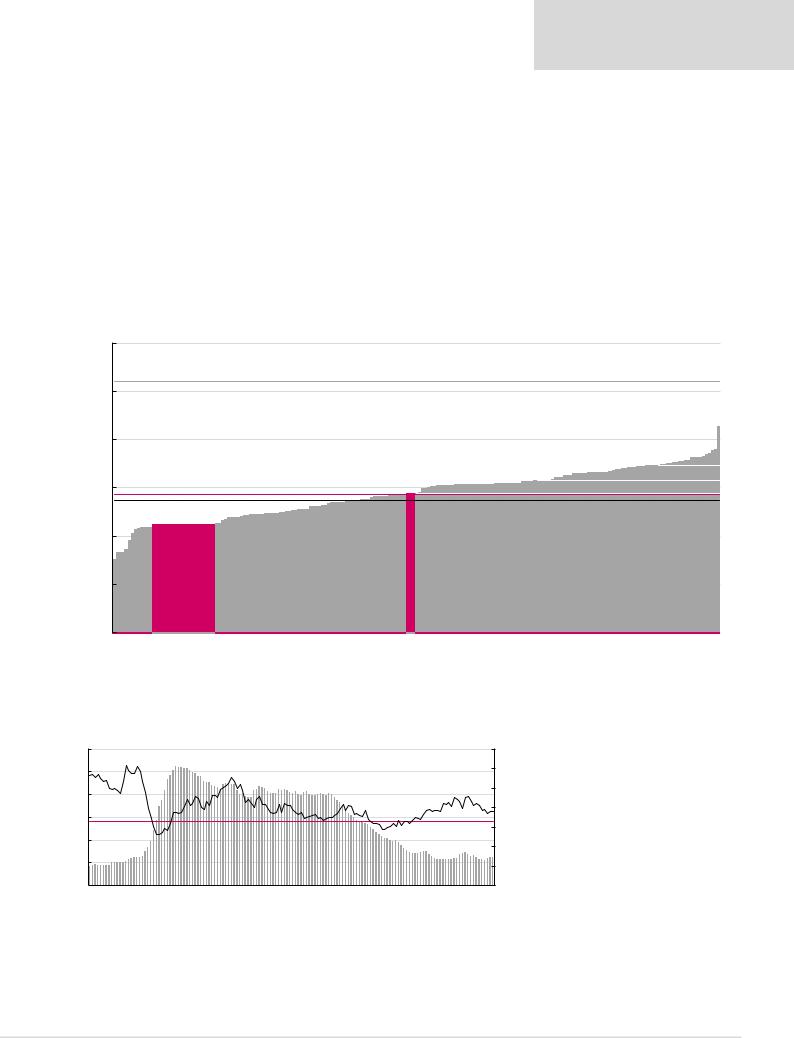
6)We forecast longer-term cost support around the 90th percentile at $65/t, and calculate incentive prices at $80/t.
Renaissance Capital
1 April 2019
Metals & Mining
37

vk.com/id446425943
Renaissance Capital
1 April 2019
Metals & Mining
Iron ore cost curve (1,720mnt)
Figure 63: 2018E iron ore cash costs plus sustaining capex, $/t
100
90 |
Spot price: $85/t* |
|
80
Incentive price: $80/t
70
60
$/t
50
Average cash cost: $41/t
40 |
|
|
30 |
|
|
20 |
25 |
|
Vale, |
||
|
||
10 |
|
*Priced as at 26 March 2019.
90th percentile: $63/t
|
|
|
|
52 |
70th percentile: $47/t |
33Tinto,Rio |
34,Kumba |
35BHP, |
39Assmang, |
|
|
Fortescue, |
50th percentile: $35/t |
||||
|
|
|
|
|
Source: Bloomberg, CRU, Renaissance Capital estimates (in pink)
Figure 64: Iron ore Chinese port inventory days compared with the iron ore price (RHS) over time, $/t |
|
|
Chinese port inventories are still at |
||||
|
|
|
|
|
|
|
|
50 |
|
|
|
48 |
|
|
elevated levels, which supports our |
45 |
|
|
|
43 |
|
|
view of falling prices in the medium |
|
|
|
41 |
|
|
||
|
|
|
|
|
|
term |
|
|
|
|
|
|
|
39 |
|
40 |
|
|
|
|
|
|
|
|
|
36 |
36 |
|
|
|
|
|
|
34 |
|
|
|
||
35 |
|
|
34 |
|
|
|
|
Average Chinese stock days, 32 |
31 |
|
|
|
|
||
|
|
|
|
|
|||
30 |
29 |
29 |
|
|
|
|
|
|
|
|
|
|
|
|
|
|
|
|
|
25 |
|
|
|
25 |
|
|
|
|
|
|
|
20 |
17 |
|
|
|
|
|
|
15 |
|
|
|
|
|
|
|
07-Jan 07-Jun 07-Nov 08-Apr 08-Sep 09-Feb 09-Jul 09-Dec 10-May 10-Oct 11-Mar 11-Aug 12-Jan 12-Jun 12-Nov 13-Apr 13-Sep 14-Feb 14-Jul 14-Dec 15-May 15-Oct 16-Mar 16-Aug 17-Jan 17-Jun 17-Nov 18-Apr 18-Sep 19-Feb
Note: Calculated as Chinese inventory/Chinese iron ore demand*1.6*365.
Source: Bloomberg, Renaissance Capital
38

vk.com/id446425943
Renaissance Capital
1 April 2019
Metals & Mining
We calculate that only 3.5% of iron ore producers are cash-burning at current spot prices, which is not enough to provide cost support in a weakening demand environment, in our view.
Figure 65: Percentage of iron ore cost curve that is cash-burning over time
% Cash burning |
|
Iron ore fines (62% Fe, CIF China), $/t |
Average LT cash burn |
|
|
200 |
|
|
|
|
|
|
|
189 |
|
|
|
|
|
|
184 |
|
|
|
|
|
|
|
|
33.5% |
|
|
|
37.5% |
|
|
|
|
|
|
|
|
|
|
|
|
|
|
40% |
|
|
32.5% |
|
|
|
|
|
|
|
32.5% |
|
|
|
|
|
|
|
|
|
|
|
|
|
|
|
|
|
|
|
|
|
|
|
|
|
|
|
|
|
|
||||||
|
180 |
|
|
|
|
|
|
|
|
|
|
|
|
|
|
|
|
|
|
|
|
|
|
|
|
|
29.5% |
|
|
|
|
|
|
|
|
|
|
|
|
|
35% |
||||
|
160 |
|
|
|
|
|
|
|
|
|
|
|
|
|
|
|
|
|
|
|
136 |
|
|
|
|
26.0% |
24.0% |
|
|
|
|
|
|
|
|
|
|
|
|
30% |
|||||
|
140 |
|
|
|
|
|
|
|
|
|
|
|
|
|
|
|
|
|
|
|
|
|
|
|
|
|
|
|
|
|
|
|
|
|
|
|
|||||||||
|
|
|
|
|
|
|
|
|
|
|
|
|
|
|
|
|
|
|
|
|
|
|
|
|
20.0% |
21.5% |
|
|
|
|
|
|
|
|
|
|
|
|
|||||||
|
120 |
18.5% |
|
|
19.5% |
|
|
|
|
|
|
|
|
|
|
|
|
|
|
|
|
|
|
|
|
|
|
|
|
|
|
|
|
|
|
|
25% |
||||||||
|
|
|
|
|
|
|
16.0% |
|
|
|
|
|
|
|
|
|
|
|
|
|
|
16.0% |
|
|
|
|
|
|
|
|
|
|
|
|
|||||||||||
$/t |
100 |
15.0% |
13.0% |
|
|
|
12.0% |
|
|
|
|
|
|
|
|
|
|
|
|
|
13.5% |
|
86 |
|
|
|
|
|
12.0% |
|
|
85 |
20% |
||||||||||||
80 |
|
|
|
|
|
|
|
|
|
|
|
|
|
|
|
|
10.0% |
|
|
|
|
|
11.5% |
|
|
|
15% |
||||||||||||||||||
|
|
|
|
|
|
|
|
|
|
|
|
|
|
|
|
|
|
8.5% |
|
8.5% |
|
|
|
|
|||||||||||||||||||||
60 |
|
|
Average LT cash burn, 9.3% |
|
|
|
|
|
|
|
|
|
|
|
6.0% |
|
|
6.5% |
7.0% |
|
|
10% |
|||||||||||||||||||||||
40 |
61 |
|
5.0% |
|
|
|
4.0% |
|
|
|
|
|
|
|
3.5% 3.5% |
|
3.5% |
|
3.0% |
|
4.5% |
4.0% |
3.5% |
||||||||||||||||||||||
|
|
|
|
2.5% |
|
|
|
|
|
|
|
2.5% 2.5% |
|
|
|||||||||||||||||||||||||||||||
|
|
1.5% |
|
|
1.0% |
|
1.0% |
|
1.0% |
|
1.0% |
1.5% |
|
||||||||||||||||||||||||||||||||
20 |
|
|
0.0% 0.0% 0.0% |
0.5% |
0.5% |
0.5% 0.5% 0.5% 0.5% |
0.5% 0.5% |
5% |
|||||||||||||||||||||||||||||||||||||
|
|
|
|||||||||||||||||||||||||||||||||||||||||||
|
|
|
|
||||||||||||||||||||||||||||||||||||||||||
|
-0 |
Mar 06 Jun 06 Sep 06 Dec 06 Mar 07 Jun 07 Sep 07 Dec 07 Mar 08 Jun 08 Sep 08 Dec 08 Mar 09 Jun 09 Sep 09 Dec 09 Mar 10 Jun 10 Sep 10 Dec 10 Mar 11 Jun 11 Sep 11 Dec 11 Mar 12 Jun 12 Sep 12 Dec 12 Mar 13 Jun 13 Sep 13 Dec 13 Mar 14 Jun 14 Sep 14 Dec 14 Mar 15 Jun 15 Sep 15 Dec 15 Mar 16 Jun 16 Sep 16 Dec 16 Mar 17 Jun 17 Sep 17 Dec 17 Mar 18 Jun 18 Sep 18 Dec 18 Mar 19 Spot |
0% |
||||||||||||||||||||||||||||||||||||||||||
|
|
|
|||||||||||||||||||||||||||||||||||||||||||
Source: Bloomberg, CRU, Renaissance Capital estimates
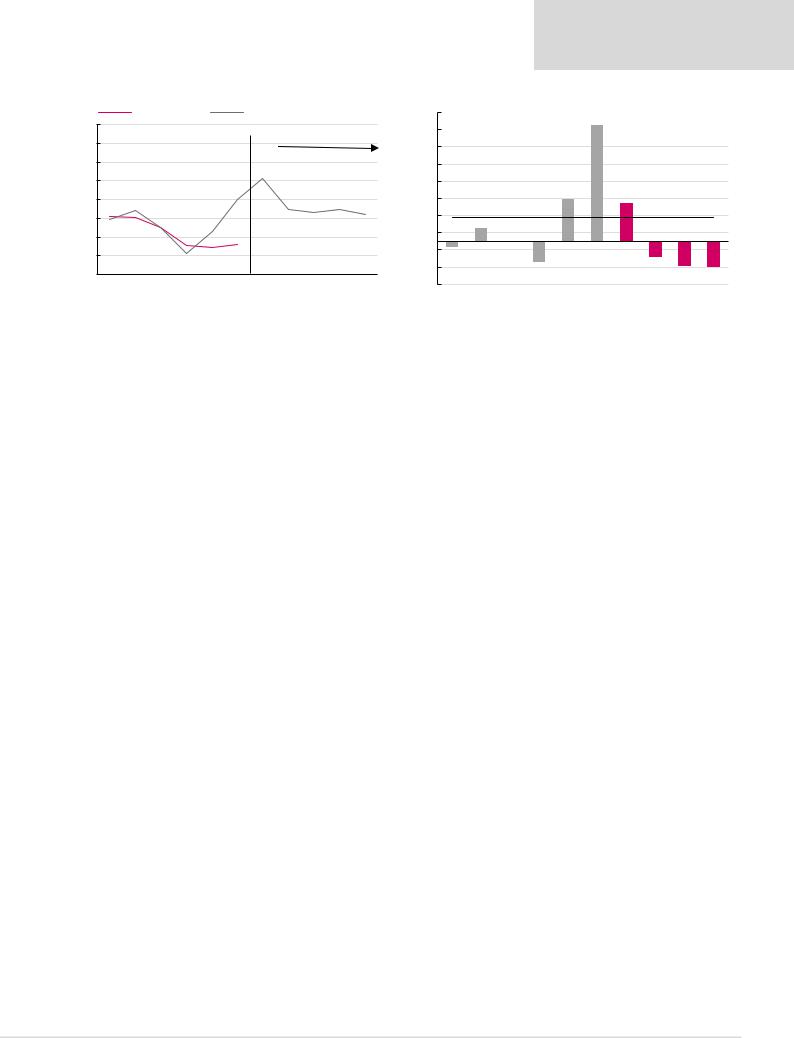
Our long-term iron ore price forecast of $65/t is 5% above the estimated 90th percentile of the cost curve, which reflects our view that some of Vale’s production may be replaced by higher cost supply.
Figure 66: Iron ore price vs cash costs* at the 90th percentile, $/t |
Figure 67: Iron ore price premium (discount) to the 90th percentile |
Cash costs, $/t |
Iron ore average price. $/t |
80% |
|
|
200 |
|
|
|
|
|
|
|
|
|
|
|
|
|
|
|
180 |
|
|
|
|
175 |
|
|
|
|
|
|
|
|
|
60% |
|
|
|
|
|
|
|
|
|
|
|
|
|
|
||
160 |
|
|
|
|
|
|
|
|
|
|
|
|
|
|
40% |
|
|
|
|
|
|
|
|
|
|
|
|
|
|
|
|
140 |
91 |
100 |
77 |
98 |
108 |
111 |
95 |
70 |
70 |
Forecasts |
78 |
65 |
|
||
|
71 66 |
88 |
85 |
|
|||||||||||
120 |
|
|
|
|
101 |
|
|
|
|
|
|
|
|
|
20% |
100 |
|
|
|
|
|
|
|
|
|
|
|
|
|
|
0% |
|
|
|
|
|
|
|
|
|
|
|
|
|
|
|
|
80 |
|
|
|
|
|
|
|
|
|
|
|
|
|
|
|
60 |
|
|
|
|
|
|
|
|
|
61 |
|
|
|
|
-20% |
|
|
|
|
|
|
|
|
|
|
|
|
|
|
|
|
40 |
2007 |
2008 |
2009 |
2010 |
2011 2012 |
2013 |
2014 |
2015 |
2016 |
2017 2018E |
2019E |
2020E |
2021E |
LT (real) |
-40% |
|
|||||||||||||||
|
|
||||||||||||||
*Cash costs net of by-product credits plus sustaining capex. |
|
|
|
|
|
|
|
|
|||||||
|
|
|
|
|
|
|
|
Source: Bloomberg, Renaissance Capital estimates |
|
||||||
52% |
55% |
63% |
34% |
9% |
31% |
22% |
2% |
16% |
5% |
36% |
27% |
13% |
|
|
|
|
Historical average, 23% |
|
|
|
||
|
|
|
|
|
|
|
|
-21% |
-16% |
|
|
|
|
|
2007 |
2008 |
2009 |
2010 |
2011 |
2012 |
2013 |
2014 |
2015 |
2016 |
2017 |
2018E |
2019E |
2020E |
2021E |
Source: Bloomberg, Renaissance Capital estimates
39
vk.com/id446425943
Manganese ore
Manganese ore cost curve (16.7mnt contained metal)
Figure 68: 2018E manganese lump cash costs plus sustaining capex, $/dmtu (44%, CIF China)
8.0
7.0Spot price: $6.88/dmtu*
|
6.0 |
Incentive price: $6/dmtu |
|
|
|
$/dmtu |
5.0 |
Average cash cost: $4.79/dmtu |
|
|
|
|
4.0 |
|
|
3.0 |
2.98 |
|
(AU), |
|
|
|
|
|
2.0 |
Samancor |
|
|
|
|
1.0 |
|
*Priced as at 26 March 2019. |
||
Renaissance Capital
1 April 2019
Metals & Mining
90th percentile: $5.83/dmtu 70th percentile: $5.31/dmtu
Assmang, 5.31 |
Vale, 5.47 |
Samancor (SA), 5.58 |
Source: Bloomberg, CRU, Renaissance Capital estimates (in pink)
Figure 69: Manganese – Chinese port inventory days (LHS) and manganese price, $/mtu (RHS)
70 |
|
|
|
|
|
|
|
|
|
8.65 |
|
|
|
|
|
|
|
|
|
|
|
10 |
|
58 |
|
|
|
|
|
|
|
|
|
|
|
|
|
|
|
|
|
|
9 |
||
60 |
|
|
|
|
|
|
|
|
|
|
|
|
|
7.40 |
|
|
|
|
|
|||
|
|
|
|
|
|
|
|
|
|
|
|
|
|
|
|
|
|
|
6.88 |
8 |
||
|
|
|
|
48 |
|
|
|
|
|
|
45 |
|
|
6.55 |
|
|
|
|
|
|
||
50 |
|
|
|
|
|
|
|
|
|
|
|
|
|
|
|
|
|
|
7 |
|||
|
|
|
|
|
|
|
|
|
|
|
|
|
|
|
|
|
|
|
39 |
|||
40 |
|
Average exchange stock days, 37 |
|
|
|
|
|
|
|
|
|
|
38 |
|
|
6 |
||||||
|
|
|
|
|
33 |
|
|
32 |
|
|
|
|
|
|
|
|
|
|
|
|
|
|
|
|
|
|
|
|
|
|
|
|
|
|
|
|
|
|
|
|
|
|
5 |
||
|
|
|
|
|
|
|
|
|
|
|
|
|
|
|
|
|
|
|
|
|
||
|
|
|
|
|
|
|
|
|
|
|
|
|
|
|
|
|
|
|
|
|
|
|
30 |
|
|
|
|
|
|
|
|
|
|
|
|
|
|
22 |
|
|
|
|
|
|
4 |
|
|
|
|
|
|
|
|
|
|
|
|
|
|
|
|
|
|
|
|
|
||
20 |
|
|
|
|
|
|
|
|
|
|
|
|
|
|
|
|
|
|
|
|
|
3 |
10 |
|
|
|
|
|
|
|
2.80 |
|
|
|
|
|
|
|
|
|
|
|
|
|
2 |
|
|
|
|
|
|
|
|
|
|
|
|
|
|
|
|
|
|
|
|
|
||
|
|
|
|
|
|
|
|
|
|
|
|
|
|
|
|
|
|
|
|
|
1 |
|
|
|
|
|
|
|
1.83 |
|
|
|
|
|
|
|
|
|
|
|
|
|
|
|
|
|
|
|
|
|
|
|
|
|
|
|
|
|
|
|
|
|
|
|
|
|
|
|
0 |
Jan-15 |
Mar-15 |
May-15 |
Jul-15 Sep-15 |
Nov-15 |
Jan-16 Mar-16 |
May-16 |
Jul-16 |
Sep-16 |
Nov-16 |
Jan-17 Mar-17 |
May-17 |
Jul-17 |
Sep-17 Nov-17 |
Jan-18 |
Mar-18 |
May-18 |
Jul-18 |
Sep-18 |
Nov-18 |
Jan-19 |
- |
|
|
|||||||||||||||||||||
Note: Calculated as Chinese port stocks/Chinese consumption*365.
Source: Bloomberg, CRU, Renaissance Capital
Manganese ore inventory days have reduced to long-term average levels
Figure 70: Percentage of manganese ore cost curve that is cash-burning over time
% Cash burning |
|
Manganese ore (44%, CIF China), $/mtu |
Average LT cash burn |
|
|
9.00 |
|
|
|
|
|
|
|
|
|
|
|
|
|
|
|
|
63.0% |
|
|
|
|
|
|
|
|
|
|
|
|
|
70% |
|
|
|
|
|
|
|
|
|
|
|
|
|
|
|
|
|
|
|
|
7.76 |
|
|
|
|
|
|
|
|
|
|
|
|
|
|
|
|
|
|
|
|
|
|
|
|
|
|
|
|
|
|
|
|
|
|
|
|
|
7.39 |
|
|
|
|
|
|
|
|
8.00 |
|
|
|
|
|
|
|
|
|
|
|
|
|
|
|
50.0% |
|
|
|
|
|
|
|
|
|
|
|
|
|
60% |
|
|
|
|
|
|
|
|
|
|
|
|
|
|
|
|
|
|
|
|
|
|
|
|
|
|
|
|
|
|
|
|
||
|
7.00 |
|
|
|
|
|
|
|
|
|
|
|
|
|
|
|
|
|
|
|
|
|
|
|
|
|
|
|
|
6.48 |
|
|
|
6.00 |
|
|
|
|
|
5.71 |
|
|
|
|
|
|
|
|
|
|
|
|
|
|
|
|
|
|
|
|
|
|
|
|
50% |
|
|
|
|
|
|
|
|
|
|
|
|
|
|
|
|
|
|
|
|
|
|
|
|
|
|
|
|
|
|
|
|
|
$/mtu |
5.00 |
|
|
|
|
|
|
|
|
|
|
|
|
|
|
|
|
|
|
|
|
|
|
|
|
|
|
|
|
|
|
40% |
|
|
|
|
|
|
|
|
|
|
|
|
|
|
|
|
|
|
|
|
|
|
|
|
|
|
|
|
|
|
|
||
4.00 |
|
|
|
|
|
|
|
|
|
|
|
|
|
18.0% |
22.0% |
|
|
|
|
|
|
|
|
|
|
|
|
|
|
|
30% |
|
|
|
|
|
|
|
|
|
|
|
|
|
|
|
|
|
|
|
|
|
|
|
|
|
|
|
|
|
|
||||
3.00 |
14.0% |
14.0% |
|
|
|
|
|
|
|
11.0% |
11.0% |
11.0% |
|
|
|
|
|
|
|
|
|
|
|
|
|
|
|
|
20% |
|||
|
|
|
|
|
|
|
|
8.0% |
|
|
|
|
|
|
|
|
|
7.5% |
7.5% |
7.5% |
7.5% |
7.5% |
7.5% |
|||||||||
2.00 |
3.0% |
3.0% |
|
|
|
2.5% |
6.5% |
|
|
6.5% |
6.5% |
|
|
|
|
|
|
|||||||||||||||
|
1.5% |
1.0% |
1.5% |
|
2.07 |
|
1.0% |
1.5% |
1.0% |
1.0% |
|
|||||||||||||||||||||
|
1.00 |
|
|
|
|
|
|
0.0% |
10% |
|||||||||||||||||||||||
|
Average LT cash burn, 10.1% |
|
|
|||||||||||||||||||||||||||||
|
|
|
|
|||||||||||||||||||||||||||||
|
0.00 |
Mar 12 |
Jun 12 |
Sep 12 |
Dec 12 |
Mar 13 |
Jun 13 |
Sep 13 |
Dec 13 |
Mar 14 |
Jun 14 |
Sep 14 |
Dec 14 |
Mar 15 |
Jun 15 |
Sep 15 |
Dec 15 |
Mar 16 |
Jun 16 |
Sep 16 |
Dec 16 |
Mar 17 |
Jun 17 |
Sep 17 |
Dec 17 |
Mar 18 |
Jun 18 |
Sep 18 |
Dec 18 |
Mar 19 |
Spot |
0% |
|
|
|
||||||||||||||||||||||||||||||
Source: Bloomberg, CRU, Renaissance Capital estimates
40
vk.com/id446425943
Figure 71: Manganese price vs cash costs* at the 90th percentile
Cash costs, $/t |
Manganese average price. $/t |
10 |
|
|
|
|
|
|
|
|
|
|
|
|
|
9 |
|
|
|
|
|
|
|
Forecasts |
|
|
|
|
|
|
|
|
|
|
|
|
|
|
|
|
|
8 |
|
|
|
|
|
|
7.1 |
|
|
|
|
|
7 |
|
|
|
|
|
6.0 |
|
5.5 |
|
5.5 |
|
$/t |
6 |
5.1 |
5.0 |
4.5 |
|
|
|
5.3 |
5.2 |
|||
5 |
|
|
|
|||||||||
|
|
|
|
3.6 |
3.5 |
|
|
|
|
|
|
|
|
4 |
|
|
|
|
|
|
|
|
|
||
|
|
|
|
|
|
|
|
|
|
|
|
|
|
3 |
|
|
|
|
|
3.6 |
|
|
|
|
|
|
|
|
|
|
|
|
|
|
|
|
|
|
|
2 |
2012 |
2013 |
2014 |
2015 |
2016 |
2017 |
2018E |
2019E |
2020E |
2021E |
LT (real) |
|
|
|||||||||||
Renaissance Capital
1 April 2019
Metals & Mining
Figure 72: Manganese price premium (discount) to the 90th percentile
75% |
68% |
|
|
65% |
|
|
55%
45%
35% |
|
|
|
24% |
|
22% |
|
|
|
|
|
|
|
|
|
|
|
|
|
25% |
|
|
|
|
|
|
|
|
|
15% |
8% |
0% |
|
|
|
Historical average, 14% |
|||
5% |
|
|
|
|
|||||
|
|
|
|
|
|
|
|
||
|
|
|
|
|
|
|
|
|
|
-5% |
|
|
|
|
|
|
|
|
|
-15% |
|
|
2015-12% |
|
|
|
2019E -9% |
2020E-14% |
2021E-14% |
-25% |
|
|
|
|
|
||||
20123%- |
2013 |
2014 |
2016 |
2017 |
2018E |
||||
*Cash costs net of by-product credits plus sustaining capex.
Source: Bloomberg, Renaissance Capital estimates |
Source: Bloomberg, Renaissance Capital estimates |
41
vk.com/id446425943
Copper
Consumer growth in emerging markets is likely to support copper demand. Copper should also benefit from strong electric vehicle demand growth and a shift to renewable energy generation such as wind and solar. The multi-government-led Electric Vehicle Initiative has set a goal for 30% electric vehicle market share for passenger cars, light commercial vehicles, buses and trucks by 2030. According to Glencore this could increase copper demand by 4.1mnt by 2030, which implies 18% supply growth compared with 2017 production.
Vale estimates that the number of electric vehicles could grow by 12mn units per year from 1.8mn in 2018 to around 13.8mn by 2025. Using NCM811 chemistry this could consume 43 kg of nickel, 6 kg of cobalt, 5 kg of manganese and 11 kg of lithium per vehicle.
The supply side is also supportive for copper. Mining capex remains at very low levels and few base metal projects are being approved. Given continued grade declines at existing mines, incremental volume growth from new copper projects will probably not be enough to meet demand over the medium term. We calculate the incentive price to approve new projects at $8,200/t, which is well above spot.
Renaissance Capital
1 April 2019
Metals & Mining
Positive demand outlook driven by consumer growth, electric vehicles and alternative energy
Supportive supply side
Copper cost curve (22mnt)
Figure 73: 2018E copper cash costs plus sustaining capex, $/t
9,000
|
8,000 |
Incentive price: $8,200/t |
|
|
|
|
|
|
|
|
|
|
|
|
|
|
|
|
|
|
|
||
|
7,000 |
Spot price: $6,338/t* |
|
|
|
|
|
|
|
|
|
|
|
|
|
|
|
|
|
|
90th percentile: $6,017/t |
||
|
6,000 |
|
|
|
|
|
|
|
|
|
|
|
|
|
|
|
|
|
|
|
|
|
|
$/t |
5,000 |
Average cash cost: $4,590/t |
|
|
|
|
|
|
|
70th percentile: $4,603/t |
|
|
3,163Copper,Southern |
3,385Vale, |
3,804Resources,Teck |
4,029BHP, |
4,427American,Anglo |
4,484Glencore, |
4,603Tinto,Rio |
||||
|
4,000 |
2,669Freeport, |
2,936Norilsk, |
6,017Codelco, |
|||||||
|
|
|
|
|
|
|
|
|
|
|
|
|
3,000 |
|
|
|
|
|
|
|
|
|
|
|
2,000 |
|
|
|
|
|
|
|
|
|
|
|
1,000 |
|
|
|
|
|
|
|
|
|
|
|
0 |
|
|
|
|
|
|
|
|
|
|
*Priced as at 26 March 2019. |
|
|
|
|
|
|
|
|
|
||
|
|
|
|
|
|
|
|
|
|
|
Source: Bloomberg, CRU, Renaissance Capital estimates (in pink) |
Figure 74: Copper exchange inventory days and price, $/t (RHS)
18 |
|
|
|
|
|
16 |
|
|
|
|
|
16 |
|
|
|
|
|
|
|
|
|
|
|
12,000 |
|
|
|
|
|
|
9,811 |
|
|
|
|
|
|
|
|
|
|
|
|
|
|
|
|||
16 |
|
|
|
|
|
|
|
|
|
|
|
|
|
|
|
|
|
|
|
|
|
|||
|
|
|
8,693 |
|
|
|
|
|
|
|
|
|
|
|
|
|
|
|
|
|
|
|
10,000 |
|
14 |
|
|
|
|
|
|
|
|
|
|
|
|
|
|
|
|
|
|
|
|
|
12 |
||
|
|
|
|
|
|
|
|
|
|
|
|
|
|
|
|
|
|
12 |
|
12 |
|
|
||
12 |
|
|
|
|
|
|
11 |
|
|
|
|
|
7,136 |
|
|
|
|
12 |
6,5568,000 |
|||||
|
|
|
|
|
|
|
|
|
|
|
|
|
|
|
|
|
|
|||||||
|
|
|
|
|
|
|
|
|
|
|
|
|
|
|
9 |
|
|
|
|
|||||
10 |
|
|
Average exchange stock days, 9 |
|
|
8 |
|
|
|
|
|
|
|
|
9 |
|
|
8 |
|
|||||
|
|
|
|
|
|
|
|
|
|
|
|
|
|
|
|
|
|
|
|
|
6,000 |
|||
8 |
|
|
|
|
|
|
|
|
|
|
|
|
|
|
|
|
|
|
|
|
|
|||
6 |
|
|
|
|
|
|
|
|
|
|
|
|
|
|
|
|
6 |
|
|
|
|
|
|
|
6 |
|
|
|
|
|
|
|
|
|
|
|
|
|
|
|
|
|
|
|
|
|
|
4,000 |
|
|
|
|
4 |
|
|
|
|
|
|
|
|
|
4 |
|
|
|
|
|
|
|
|
|
||
|
|
|
|
|
|
|
|
|
|
|
|
|
|
|
|
|
|
|
|
|
|
|
||
4 |
|
|
|
|
|
|
|
|
|
|
|
|
|
|
|
|
|
|
|
|
|
|
|
|
|
|
|
|
|
|
|
|
|
|
|
|
|
|
|
|
|
|
|
|
|
|
|
2,000 |
|
2 |
|
|
|
3,042 |
|
|
|
|
|
|
|
|
|
|
|
|
|
|
|
|
|
|
|
|
|
|
|
|
|
|
|
|
|
|
|
|
|
|
|
|
|
|
|
|
|
|
|
||
|
|
|
|
|
|
|
|
|
|
|
|
|
|
|
|
|
|
|
|
|
|
|
|
|
0 |
Jan-07 |
Jun-07 |
Nov-07 |
Apr-08 Sep-08 Feb-09 |
Jul-09 |
Dec-09 May-10 |
Oct-10 Mar-11 |
Aug-11 |
Jan-12 |
Jun-12 |
Nov-12 |
Apr-13 Sep-13 |
Feb-14 |
Jul-14 Dec-14 |
May-15 |
Oct-15 |
Mar-16 |
Aug-16 |
Jan-17 Jun-17 |
Nov-17 |
Apr-18 |
Sep-18 |
Feb-19 |
0 |
|
|
|||||||||||||||||||||||
Note: Calculated as exchange inventory/global refined copper demand*365.
Source: Bloomberg, Renaissance Capital
Copper exchange inventories have fallen below the 10-year average
42

vk.com/id446425943
Renaissance Capital
1 April 2019
Metals & Mining
We estimate that around 7.5% of the copper industry is cash-burning at spot prices.
Figure 75: Percentage of copper cost curve that is cash-burning over time
|
|
|
|
|
|
|
|
|
|
|
|
% Cash burning |
|
|
|
|
Copper, $/t |
|
|
|
|
Average LT cash burn |
|
|
|
|
|
|
|
|
|
|
||||||||||
12,000 |
|
|
|
|
|
|
26.0% |
26.5% |
|
|
|
|
|
|
|
|
|
|
|
|
|
|
|
|
|
|
|
|
|
|
|
|
|
|
|
|
|
|
|
|
|
30% |
10,000 |
|
|
|
|
|
|
|
|
|
|
|
9,646 |
|
|
|
|
|
|
|
|
|
|
|
|
|
23.0% |
|
|
|
|
|
|
|
|
|
|
|
25% |
||||
|
|
|
|
|
|
|
|
|
|
|
|
|
|
|
|
|
|
|
|
|
|
|
|
|
|
|
|
|
|
|
|
|
|
|
|
|
|
|||||
|
|
|
|
8,448 |
|
|
|
|
|
|
|
|
|
|
|
|
|
|
|
|
|
|
|
|
|
|
17.5% |
18.5% |
17.5% |
17.5% |
|
|
|
|
|
|
|
|
|
|
||
8,000 |
|
|
|
|
|
|
|
|
|
|
|
|
|
|
|
|
|
|
|
|
|
|
|
|
|
|
|
|
|
|
|
|
|
|
|
|
|
20% |
||||
|
|
|
|
|
|
|
|
|
|
|
|
|
|
|
|
|
|
|
|
|
|
|
|
|
|
|
|
|
|
|
|
|
|
|
|
6,338 |
|
|||||
|
|
|
|
|
|
|
|
|
|
|
|
|
|
|
|
|
|
|
|
|
|
|
|
|
|
|
|
|
|
|
|
|
|
|
|
|
|
|
|
|
||
6,000 |
|
|
|
|
|
|
|
|
11.0% |
|
|
|
|
|
|
|
|
|
|
|
|
|
10.0% 10.0% 10.0% |
|
|
|
|
11.0% |
10.0% |
4,678 |
10.0% |
|
|
|
|
|
|
|
|
|
15% |
|
|
|
|
|
|
|
|
|
|
|
|
|
|
|
|
|
|
|
|
|
|
|
|
9.0% |
|
9.5% |
|
9.5% |
|
|
|
9.0% |
|
|
|
|
|||||||
4,000 |
|
|
|
|
|
|
|
|
6.5% |
|
|
|
|
|
|
5.5% |
|
|
|
|
|
7.5% |
8.5% |
|
|
8.5% |
6.5% |
|
|
8.5% 8.5% |
7.5% |
10% |
||||||||||
|
|
|
|
|
|
|
|
|
|
|
|
|
|
|
|
|
|
|
|
|
|
|
|
|
|
|
|
5.0% 5.0% |
||||||||||||||
2,000 |
4.5% |
1.0% 1.0% |
1.5% 1.5% |
|
1.5% |
3,435 |
3.5% 3.5% |
4.0% |
3.5% |
1.0% |
|
1.0% 1.0% |
3.5% |
4.0% |
4.5% |
4.0% |
4.5% |
Average LT cash burn, 7.7% |
4.0% |
5% |
||||||||||||||||||||||
0.5% |
|
|
|
0.5% |
||||||||||||||||||||||||||||||||||||||
|
|
|
|
|
|
|
|
|
|
|||||||||||||||||||||||||||||||||
|
|
|
|
|
|
|
|
|
|
|
|
|||||||||||||||||||||||||||||||
0 |
Mar 07 |
Jun 07 Sep 07 |
Dec 07 |
Mar 08 |
Jun 08 |
Sep 08 |
Dec 08 |
Mar 09 |
Jun 09 |
Sep 09 |
Dec 09 Mar 10 |
Jun 10 |
Sep 10 |
Dec 10 |
Mar 11 |
Jun 11 Sep 11 |
Dec 11 |
Mar 12 |
Jun 12 |
Sep 12 |
Dec 12 |
Mar 13 |
Jun 13 Sep 13 Dec 13 |
Mar 14 |
Jun 14 |
Sep 14 |
Dec 14 |
Mar 15 |
Jun 15 Sep 15 |
Dec 15 Mar 16 |
Jun 16 |
Sep 16 Dec 16 |
Mar 17 |
Jun 17 |
Sep 17 |
Dec 17 |
Mar 18 Jun 18 |
Sep 18 |
Dec 18 |
Mar 19 |
Spot |
0% |
|
|
|||||||||||||||||||||||||||||||||||||||||
Source: Bloomberg, CRU, Renaissance Capital estimates
Our long-term copper price of $6,700/t is based on the 90th percentile of the copper cost curve.
Figure 76: Copper price vs cash costs* at the 90th percentile |
Figure 77: Copper price premium (discount) to the 90th percentile |
|
|
|
Cash costs, $/t |
|
|
|
Copper average price, $/t |
|
70% |
58% |
|
|
|
|
|
|
|
|
|
|
|
|
|
|
||||||||
|
10,000 |
|
|
|
|
8,811 |
|
|
|
|
|
|
|
|
|
|
60% |
|
|
|
|
|
|
|
|
|
|
|
|
|
|
|
|
|
|
|
|
|
|
|
|
|
|
|
|
|
|
|
|
|
|
|
|
|
|
|
|
|
|
|
|
|
|
|
|
|
9,000 |
|
|
|
|
|
|
|
|
|
|
Forecasts |
|
|
|
|
|
|
|
39% |
|
|
|
|
|
|
|
|
|
|
||
|
|
|
|
|
|
|
|
|
|
|
|
|
|
|
|
50% |
|
|
|
|
|
|
|
|
|
|
|
|
|
|
||
$/t |
|
4,515 |
5,440 |
4,701 |
5,792 |
6,323 |
7,060 |
7,009 |
6,254 |
5,958 |
5,200 |
6,1705,587 |
6,400 |
6,500 |
7,025 |
6,700 |
|
28% |
10% |
30% |
13% |
5% |
10% |
|
|
10% |
9% |
3% |
2% |
7% |
||
8,000 |
0% |
|
|
|
||||||||||||||||||||||||||||
|
7,000 |
|
|
|
|
|
|
|
|
|
|
6,532 |
|
|
|
|
30% |
|
|
|
|
|
|
Historical average, 17% |
|
|
|
|
||||
|
6,000 |
|
|
|
|
|
|
|
|
|
|
|
|
|
|
|
20% |
|
|
|
|
|
|
|
|
|
|
|
|
|
|
|
|
|
|
|
|
|
|
|
|
|
|
|
|
|
|
|
10% |
|
|
|
|
|
|
|
|
|
|
|
|
|
|
|
|
|
|
|
|
|
|
|
|
|
|
|
|
|
|
|
|
|
|
|
|
|
|
|
|
|
|
|
|
|
|
|
|
|
|
5,000 |
|
|
|
|
|
|
|
|
|
|
|
|
|
|
|
|
|
|
|
|
|
|
|
|
|
|
|
|
|
|
|
|
4,000 |
|
|
|
|
|
|
|
|
|
|
|
|
|
|
|
-10% |
|
|
|
|
|
|
|
|
-7% |
-6% |
|
|
|
|
|
|
3,000 |
|
|
|
|
|
|
|
|
|
|
|
|
|
|
|
-20% |
|
|
|
|
|
|
|
|
|
|
|
|
|
||
|
|
|
|
|
|
|
|
|
|
|
|
|
|
|
|
|
|
|
|
|
|
|
|
|
|
|
|
|
|
|
||
|
2007 |
2008 |
2009 |
2010 |
2011 |
2012 |
2013 |
2014 |
2015 |
2016 |
2017 2018E |
2019E |
2020E |
2021E |
(real)LT |
|
2007 |
2008 |
2009 |
2010 |
2011 |
2012 |
2013 |
2014 |
2015 |
2016 |
2017 |
2018E |
2019E |
2020E |
2021E |
|
|
|
-30% |
||||||||||||||||||||||||||||||
|
|
|
|
|
|
|
|
|
|
|
|
|
|
|
|
|
|
|
|
|
|
|
|
|
|
|
|
|
|
|
|
|
*Cash costs net of by-product credits plus sustaining capex.
Source: Bloomberg, Renaissance Capital estimates |
Source: Bloomberg, Renaissance Capital estimates |
43
vk.com/id446425943
Aluminium
Consumer growth in emerging markets is likely to support aluminium demand.
We believe aluminium demand growth could remain strong as motor vehicle manufacturers continue to replace steel with lighter aluminium. Aluminium is also likely to continue benefiting from packaging growth (beverage cans, etc.). China’s environmental constraints and supply reform policies are likely to limit Chinese aluminium supply growth. We are not aware of major planned aluminium capacity from Western producers.
We calculate the incentive price to approve new projects at $3,100/t, which is significantly above spot.
Renaissance Capital
1 April 2019
Metals & Mining
Aluminium cost curve (67mnt supply)
Figure 78: 2018E aluminium cash costs plus sustaining capex, $/t
3,500
3,000 |
Incentive price: $3,100/t |
|
2,500
$/t |
2,000 |
Average cash cost: $1,932/t |
|
|
|
Spot price: $1,865/t* |
|
|
1,500 |
1,620 |
1,625 |
|
|
||
|
1,000 |
RioTinto, |
Rusal, |
|
|
|
|
|
500 |
|
|
*Priced as at 26 March 2019. |
|
||
South32, 1,935
90th percentile: $2,231/t 70th percentile: $2,072/t
50th percentile: $1,939/t
Source: Bloomberg, CRU, Renaissance Capital estimates (in pink)
Aluminium inventories have been declining since 2014 and are now at a supportive 13 days.
Figure 79: Aluminium exchange inventory days and price, $/t (RHS)
60 |
|
3,070 |
|
|
52 |
|
|
|
|
|
|
|
|
|
|
|
|
|
|
|
|
|
|
3,500 |
|
|
|
|
|
|
|
|
|
|
|
|
|
|
|
|
|
|
|
|
|
|
|
|
|
50 |
|
|
|
|
|
|
|
44 |
|
|
|
|
|
|
|
|
|
|
|
|
|
|
|
3,000 |
|
|
|
|
|
|
|
|
|
|
|
|
|
|
|
|
|
|
|
|
|
|
|
||
|
|
|
|
|
|
|
|
|
|
40 |
|
|
|
|
|
|
|
|
|
2,256 |
|
|
|
|
|
|
|
|
|
|
|
|
|
|
|
|
|
|
|
|
|
|
|
|
1,8902,500 |
||||
40 |
|
|
|
|
|
|
|
|
|
|
|
|
|
|
|
|
|
1,670 |
|
|
|
|||
30 |
Average exchange stock days, 28 |
|
|
|
|
|
|
|
|
|
|
|
|
|
|
|
|
2,000 |
||||||
|
|
|
|
|
|
|
|
|
|
|
|
|
|
|
|
|
|
|||||||
|
|
|
|
|
|
|
|
|
|
|
|
|
|
|
|
22 |
|
|
|
|
|
|
1,500 |
|
|
|
|
|
|
|
|
|
|
|
|
|
|
|
|
|
|
|
|
|
|
|
|
||
20 |
|
|
15 |
|
|
|
|
|
|
|
|
|
|
|
|
|
|
|
15 |
|
14 |
11 |
12 |
1,000 |
9 |
|
|
|
|
|
|
|
|
|
|
|
|
|
|
|
|
|
|
|
|
||||
|
|
|
|
|
|
|
|
|
|
|
|
|
|
|
|
|
|
|
|
|
||||
|
|
|
|
|
|
|
|
|
|
|
|
|
|
|
|
|
|
|
|
|
|
|
|
|
10 |
|
|
|
|
|
|
|
|
|
|
|
|
|
|
|
|
|
|
|
|
|
|
|
500 |
|
|
|
|
|
|
|
|
|
|
|
|
|
|
|
|
|
|
|
|
|
|
|
|
|
0 |
|
Nov-07 Apr-08 |
|
Feb-09 |
Jul-09 Dec-09 |
May-10 Oct-10 Mar-11 |
|
|
|
|
Apr-13 |
|
Feb-14 |
Jul-14 |
|
May-15 |
Oct-15 |
Mar-16 Aug-16 |
|
|
Nov-17 Apr-18 |
|
Feb-19 |
0 |
Jan-07 |
Jun-07 |
Sep-08 |
Aug-11 |
Jan-12 |
Jun-12 |
Nov-12 |
Sep-13 |
Dec-14 |
Jan-17 |
Jun-17 |
Sep-18 |
|
||||||||||||
Note: Calculated as exchange inventory/global refined aluminium demand*365.
Source: Bloomberg, Renaissance Capital
Aluminium inventories have been declining, supporting a more favourable price outlook
44
vk.com/id446425943
Renaissance Capital
1 April 2019
Metals & Mining
We calculate that around 64% of the aluminium industry is cash-burning at current spot prices, which could trigger capacity cuts and support our constructive medium-term view.
Figure 80: Percentage of aluminium cost curve that is cash-burning over time
|
|
|
|
|
|
|
|
|
% Cash burning |
|
|
|
Aluminium, $/t |
|
|
|
|
Average LT cash burn |
|
|
|
|
|
|
|
||||||||||||
|
3,500 |
|
|
|
|
|
|
|
|
|
.0% |
|
|
|
|
|
|
|
|
|
|
|
|
|
|
|
|
|
|
|
|
|
|
|
|
80% |
|
|
|
|
|
|
|
|
|
|
|
|
70 0% |
|
|
|
|
|
|
|
|
|
|
|
|
|
|
|
|
|
|
|
|
|
|
|
64.5% 64.0% |
|
|
|
|
|
|
|
|
|
|
|
2,941 |
|
65. |
|
|
|
|
|
|
|
|
|
|
|
|
|
|
|
|
|
|
|
|
|
|
|
70% |
||
|
|
|
|
|
|
|
|
|
|
|
|
|
|
|
|
|
|
|
|
|
|
|
|
|
|
|
|
|
|
|
|
|
|
|
|
||
|
3,000 |
|
|
|
|
|
|
|
|
|
|
49.0% |
|
|
|
|
|
48.0% |
|
|
|
|
|
|
|
|
|
|
|
|
|
|
|
51.5% |
60% |
||
|
|
|
|
|
|
|
|
|
|
|
|
|
|
|
2,600 |
|
|
|
|
|
|
|
|
|
|
|
|
|
|
|
|||||||
|
|
|
|
|
|
|
|
|
|
|
|
|
|
|
|
|
|
|
|
|
|
|
|
|
|
|
|
|
|
|
|||||||
|
|
|
|
|
|
|
|
|
|
|
|
|
|
|
|
|
|
|
|
|
|
|
|
|
|
|
|
|
|
|
|
50% |
|||||
|
2,500 |
|
|
|
|
|
|
|
|
|
|
|
|
|
|
|
|
|
|
|
|
|
|
|
|
|
|
|
|
|
|
|
|
|
2,264 |
|
|
|
|
|
|
|
|
|
|
|
|
|
|
|
|
|
|
|
|
|
|
|
|
|
|
|
|
|
|
32.0% |
|
|
|
|
|
|
|||
|
|
|
|
|
|
|
|
|
|
|
|
|
|
|
|
|
|
|
|
|
|
|
|
|
|
|
|
|
|
|
|
|
|
|
|||
|
|
|
|
|
|
|
|
|
|
|
|
|
|
|
|
|
|
|
|
|
|
|
|
28.5% |
|
|
|
|
|
|
|
|
|
40% |
|||
|
2,000 |
|
|
|
|
|
|
|
|
|
|
|
|
|
|
|
|
|
|
|
|
|
|
|
|
|
|
|
|
|
|
1,865 |
|
||||
$/t |
|
|
|
|
|
|
|
|
|
|
|
|
|
|
|
|
|
|
27.0% |
|
26.5% |
|
|
|
|
|
|
|
21.0% |
|
34.5% |
30% |
|||||
|
|
|
|
|
|
|
|
|
|
|
|
|
|
|
|
|
|
|
|
|
|
|
|
|
|
|
|
||||||||||
1,500 |
|
|
|
|
|
|
Average LT cash burn, 14.6% |
|
|
|
|
|
|
|
|
|
|
|
|
|
|
12.0% |
|
|
20% |
||||||||||||
|
|
|
|
|
|
|
|
|
|
|
|
|
|
|
|
|
|
|
|
|
|
|
|||||||||||||||
5.5% 4.5% |
|
|
7.5% |
|
1.5% 1.5% |
|
|
|
6.5% |
18.5% |
4.0% |
7.5% |
24.5% |
|
18.0% |
4.0% |
22.0% |
7.0% |
|
|
14.5% |
|
|
||||||||||||||
|
|
|
|
1.0% |
|
|
|
|
|
10% |
|||||||||||||||||||||||||||
|
|
3.5% |
2.0% |
5.0% |
1,360 |
11.5% |
18.5% |
20.0% |
17.0% |
18.0% |
|
|
4.5% |
|
4.5% |
|
3.0% |
22.5% |
|
|
|||||||||||||||||
|
|
|
1.0% |
|
|
0.5% 0.0% 0.0% 0.0% 0.0% 0.0% 0.0% 0.5% |
0.5% |
|
3.0% |
1.5% |
1.5% |
|
4.0% |
5.5% |
|
|
3.0% |
4.0% |
|
|
1.5% |
1.0% |
7.5% |
|
|
||||||||||||
|
1,000 |
|
|
|
|
|
|
|
|
|
|
|
|
|
|
|
|
|
|
|
|
|
|
|
|
|
|
|
|
|
|
|
|
|
|
|
0% |
04 |
04 |
05 |
05 |
06 |
06 |
07 |
07 |
08 |
08 |
09 |
09 |
10 |
10 |
11 |
11 |
12 |
12 |
13 |
13 |
14 |
14 |
15 |
15 |
16 |
16 |
17 |
17 |
18 |
18 |
19 |
||||||||||||||||||||||||||||||
Jun04 |
04 |
Jun05 |
05 |
Jun06 |
06 |
Jun07 |
07 |
Jun08 |
08 |
Jun09 |
09 |
Jun10 |
10 |
Jun11 |
11 |
Jun12 |
12 |
Jun13 |
13 |
Jun14 |
14 |
Jun15 |
15 |
Jun16 |
16 |
Jun17 |
17 |
Jun18 |
18 |
Spot |
||||||||||||||||||||||||||||||
Mar |
Sep Dec Mar |
Sep Dec Mar |
Sep Dec Mar |
Sep Dec Mar |
Sep Dec Mar |
Sep Dec Mar |
Sep Dec Mar |
Sep Dec Mar |
Sep Dec Mar |
Sep Dec Mar |
Sep Dec Mar |
Sep Dec Mar |
Sep Dec Mar |
Sep Dec Mar |
Sep Dec Mar |
|||||||||||||||||||||||||||||||||||||||||||||
Source: Bloomberg, CRU, Renaissance Capital estimates
Our long-term aluminium price forecast of $2,200/t is around the 90th percentile of the cost curve.
Figure 81: Aluminium price vs cash costs* at the 90th percentile |
Figure 82: Aluminium price premium (discount) to the 90th percentile |
|
|
|
Cash costs, $/t |
|
|
|
Aluminium average price. $/t |
|
40% |
|
|
29% |
|
|
|
|
|
|
|
|
|
|
|
|
|
|
|||||||||||
|
3,000 |
|
|
1,9942,570 |
|
2,502 |
|
|
|
|
|
|
|
|
Forecasts |
|
|
|
|
|
|
|
|
|
|
|
|
|
|
|
|
|
|
||||
|
2,800 |
|
|
|
|
|
2,340 |
|
|
|
|
|
|
30% |
|
|
22% |
|
|
|
|
|
|
|
|
|
|
|
|
|
|||||||
$/t |
1,557 |
1,751 |
2,166 |
1,736 |
2,181 |
2,076 |
1,945 |
1,871 |
1,689 |
1,543 |
1,9291,968 |
1,950 |
2,200 |
2,307 |
2,200 |
10% |
8% |
3% |
|
|
2% |
|
|
|
4% |
2% |
|
|
|
|
|||||||
2,600 |
|
|
|
|
|
|
|
|
|
|
|||||||||||||||||||||||||||
|
|
|
|
|
|
|
|
|
|
|
|
|
|
2,110 |
|
|
|
|
|
|
|
|
|
|
|
|
|
|
|
|
|
|
|
|
|
|
|
|
2,400 |
|
|
|
|
|
|
|
|
|
|
|
|
|
|
|
|
|
20% |
|
|
|
|
|
|
|
|
|
|
|
|
|
|
|
|
|
|
|
|
|
|
|
|
|
|
|
|
|
|
|
|
|
|
|
|
|
|
|
|
|
|
|
|
|
|
|
|
|
|
|
|
|
|
||
|
|
|
|
|
|
|
|
|
|
|
|
|
|
|
|
|
|
|
|
|
|
|
|
|
|
|
|
|
|
|
|
|
|
|
|
|
|
|
2,200 |
|
|
|
|
|
|
|
|
|
|
|
|
|
|
|
|
|
|
10% |
|
|
|
|
|
|
|
Historical average, 5% |
|
|
|
|
|
||||
|
2,000 |
|
|
|
|
|
|
|
|
|
|
|
|
|
|
|
|
|
|
|
|
|
|
|
|
|
|
|
|
|
|
|
|
|
|
|
|
|
|
|
|
|
|
|
|
|
|
|
|
|
|
|
|
|
|
|
|
|
|
|
|
|
|
|
|
|
|
|
|
|
|
|
|
|
|
|
1,800 |
|
|
|
|
|
|
|
|
|
|
|
|
|
|
|
|
|
|
0% |
|
|
|
|
|
|
|
|
|
|
|
|
|
|
|
|
|
|
1,600 |
|
|
|
|
|
|
|
|
|
|
|
|
|
|
|
|
|
|
|
|
|
|
|
|
|
|
|
|
|
|
|
|
|
|
|
|
|
|
|
|
|
|
|
|
|
|
|
|
|
|
|
|
|
|
|
|
|
|
|
|
|
|
2010 0% |
|
|
2014 0% |
2015 -1% |
|
|
|
|
|
|
|
|
1,400 |
|
|
|
|
|
|
|
|
|
|
|
|
|
|
|
|
|
|
-10% |
|
|
|
|
|
2009 -4% |
|
2012 -3% 2013 -5% |
|
|
2018E -5% |
|
2020E -6% |
2021E -6% |
|||
|
1,200 |
|
|
|
|
|
|
|
|
|
|
|
|
|
|
|
|
|
|
|
|
|
|
|
|
|
|
|
|||||||||
|
|
|
|
|
|
|
|
|
|
|
|
|
|
|
|
|
|
|
|
|
|
|
|
|
|
|
|
2019E -11% |
|||||||||
|
1,000 |
2004 |
2005 |
2006 |
2007 |
2008 |
2009 |
2010 |
2011 |
2012 |
2013 |
2014 |
2015 |
2016 |
2017 2018E |
2019E |
2020E |
2021E |
LT (real) |
-20% |
|
|
|
|
|
|
|
|
|||||||||
|
|
2004 |
2005 |
2006 |
2007 |
2008 |
2011 |
2016 |
2017 |
||||||||||||||||||||||||||||
|
|
|
|||||||||||||||||||||||||||||||||||
*Cash costs net of by-product credits plus sustaining capex.
Source: Bloomberg, Renaissance Capital estimates |
Source: Bloomberg, Renaissance Capital estimates |
45

vk.com/id446425943
Nickel
Renaissance Capital
1 April 2019
Metals & Mining
We are constructive on the outlook for nickel prices, given rapidly declining inventory days coupled with a continued market deficit forecast over the medium term, as continued growth in nickel pig iron production is broadly matched by strong nickel demand in stainless steel from Indonesia and China. Nickel prices have been under pressure and now render around 46% of the industry cash-burning. We believe this could lead to supply cuts, which could support higher nickel prices. From a longer-term perspective, we believe the electrification of the drive train could support increased demand for batterygrade nickel. Glencore and CRU forecast that nickel demand could grow by around 55% (c. 1.1mnt) between 2017 and 2030 due to the metal requirements to enable the Electric Vehicle Initiative target of 30% EV market share by 2030.
We believe supply growth could be limited as we calculate the incentive price for new projects at $18,300/t. We see limited growth in nickel in pig iron, which remains at the upper end of the cost curve. We therefore believe supply could struggle to keep up with growing demand. The key downside risk is a cyclical demand downturn, driven by a potential pullback in global GDP growth rates due to escalating trade wars and higher interest rates and oil prices, which could put further pressure on over-indebted emerging markets.
Nickel cost curve (2.3mnt)
Figure 83: 2018E nickel cash costs plus sustaining capex, $/t
|
22,000 |
|
|
|
|
|
20,000 |
|
|
|
|
|
|
Incentive price: $18,300/t |
|
|
|
|
18,000 |
|
|
|
|
|
16,000 |
|
|
|
|
|
14,000 |
Spot price: $12,995/t* |
|
|
|
$/t |
|
|
|
|
|
|
|
|
|
|
|
|
12,000 |
|
|
|
|
|
|
Average cash cost: $10,206/t |
|
|
|
|
10,000 |
5,079Norilsk, |
8,961Vale, |
9,073Glencore, |
9,563South32, American,Anglo9,660 |
|
8,000 |
||||
|
|
|
|
|
|
|
6,000 |
|
|
|
|
|
4,000 |
|
|
|
|
|
2,000 |
|
|
|
|
*Priced as at 26 March 2019 |
|
|
|
||
90th percentile: $14,776/t 16,001ARM,
50th percentile: $9,314/t
Source: Bloomberg, CRU, Renaissance Capital estimates (in pink)
Figure 84: Nickel LME inventory days and price, $/t (RHS)
120 |
|
|
|
|
|
|
|
|
|
|
|
|
|
|
|
|
110 |
|
|
|
|
|
|
|
60,000 |
49,825 |
|
|
|
|
|
|
|
|
|
|
|
|
|
|
|
|
|
|
|
|
|
|
|
||
100 |
|
|
|
|
|
|
|
|
|
|
|
|
|
|
|
|
|
|
|
|
|
|
|
|
50,000 |
80 |
|
31,325 |
|
|
|
|
|
|
|
|
|
|
|
70 |
|
|
|
|
71 |
|
|
|
|
40,000 |
|
|
|
|
|
|
28,972 |
|
|
|
|
|
|
|
|
|
|
|
|
|
|
60 |
|
|
|||
|
|
|
|
|
|
|
|
|
|
|
|
|
|
|
|
|
|
|
|
|
|
|
|||
60 |
|
|
|
|
|
|
|
|
|
|
|
|
|
|
|
|
|
|
|
|
|
|
53 |
|
30,000 |
|
|
|
|
|
|
|
20,774 |
|
|
|
|
|
|
|
|
|
|
|
|
|
|
||||
|
Average exchange stock days, 45 |
|
|
|
|
|
|
|
|
|
|
|
|
|
37 32 |
|
|||||||||
|
|
|
|
|
|
|
|
|
|
|
|
|
|
|
|
|
|
||||||||
40 |
|
|
|
31 |
|
|
31 |
|
|
|
|
|
|
|
|
|
|
|
|
|
|
|
13,744 |
20,000 |
|
|
|
|
|
|
|
|
|
|
21 |
|
|
|
|
|
|
|
|
|
|
|
|
|
|
12,969 |
|
20 |
|
13 |
|
|
|
|
|
|
|
|
|
|
|
|
|
|
|
|
|
|
|
|
|
|
10,000 |
2 |
|
|
|
|
|
|
|
|
|
|
|
|
|
|
|
|
|
|
|
|
|
|
|
||
|
|
|
|
|
|
|
|
|
|
|
|
|
|
|
|
|
|
|
|
|
|
|
|
|
|
0 |
|
|
|
|
Jul-09 |
|
May-10 Oct-10 Mar-11 |
|
|
|
|
|
|
|
Jul-14 |
|
|
|
Mar-16 |
|
|
|
|
|
0 |
Jan-07 |
Jun-07 |
Nov-07 Apr-08 |
Sep-08 |
Feb-09 |
Dec-09 |
Aug-11 |
Jan-12 |
Jun-12 |
Nov-12 |
Apr-13 |
Sep-13 |
Feb-14 |
Dec-14 |
May-15 |
Oct-15 |
Aug-16 |
Jan-17 |
Jun-17 |
Nov-17 Apr-18 |
Sep-18 Feb-19 |
|
||||
Note: Calculated as exchange inventory/global refined nickel demand*365.
Source: Bloomberg, Renaissance Capital
Nickel inventory has reduced closer to long-term average levels. Further reduction in inventory may become price-supportive
46
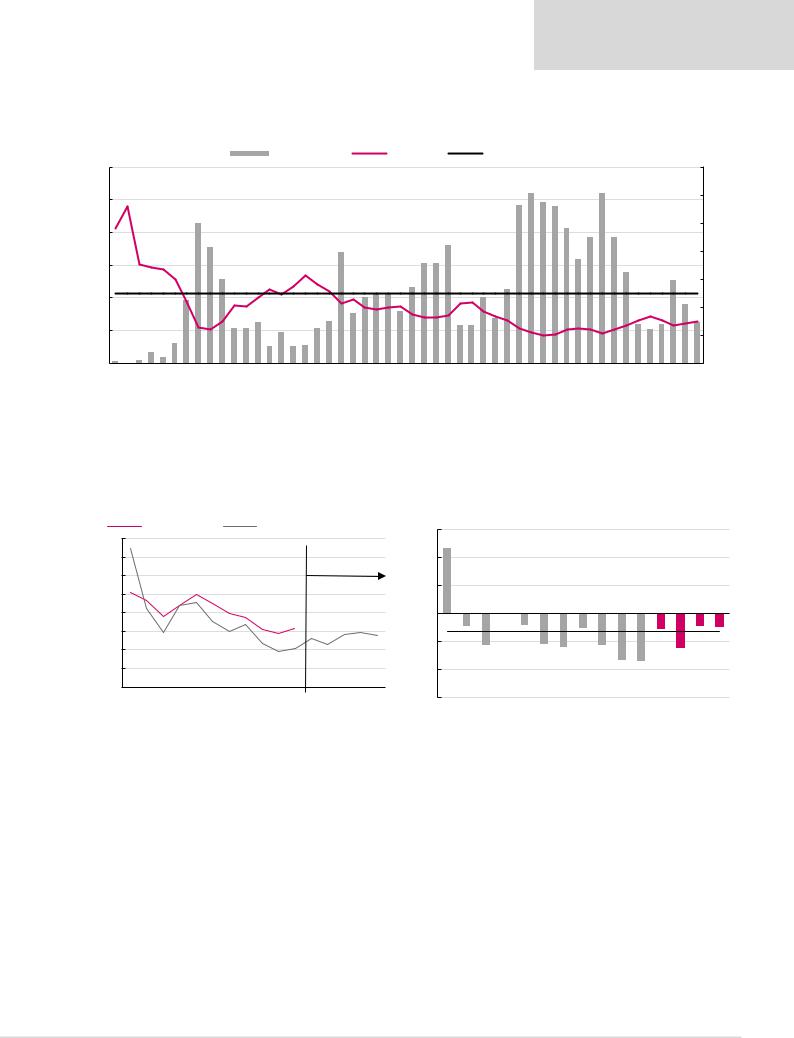
vk.com/id446425943
Renaissance Capital
1 April 2019
Metals & Mining
Nickel prices have been under pressure and now render around 15% of the industry cashburning.
Figure 85: Percentage of Nickel cost curve that is cash-burning over time
|
|
|
|
|
|
|
|
|
|
|
|
|
% Cash burning |
|
|
|
|
Nickel, $/t |
|
|
|
Average LT cash burn |
|
|
|
|
|
|
|
|
|
|
|
|
|||||||||||||||
59,999 |
|
|
|
|
|
|
|
|
|
|
|
|
|
|
|
|
|
|
|
|
|
|
|
|
|
|
|
|
|
|
|
|
56.5% |
60.5% |
57.5% |
56.0% |
|
|
|
60.5% |
|
|
|
|
|
|
|
|
70% |
49,999 |
48,055 |
|
|
|
|
50.0% |
|
|
|
|
|
|
|
|
|
|
|
|
|
|
|
|
|
|
|
|
|
|
|
|
48.0% |
|
|
|
|
|
|
|
|
|
|
60% |
|||||||
|
|
|
|
|
|
|
|
|
|
|
|
|
|
|
|
|
|
|
|
|
|
|
|
|
|
|
|
|
|
|
|
|
|
|
|
|
|
|
|
|
|||||||||
|
|
|
|
|
|
|
|
|
|
|
|
|
|
|
|
|
|
|
|
|
|
|
|
|
|
|
|
|
|
|
|
45.0% |
45.0% |
|
|
|
|
|
|
|
|
||||||||
39,999 |
|
|
|
|
|
|
|
41.5% |
|
|
|
|
|
|
|
|
|
39.5% |
|
|
|
|
|
|
|
|
42.0% |
|
|
|
|
37.0% |
|
|
|
|
|
|
|
50% |
|||||||||
|
|
|
|
|
|
|
|
|
|
|
|
|
|
|
|
|
|
|
|
|
|
35.5% 35.5% |
|
|
|
|
32.5% |
|
|
|
|
|
|
|
|||||||||||||||
|
|
|
|
|
|
|
|
30.0% |
|
|
|
|
26,899 |
|
|
|
|
|
|
27.0% |
|
|
|
26.5% |
|
|
|
29.5% |
|
|
40% |
||||||||||||||||||
29,999 |
|
|
|
|
|
|
22.5% |
|
|
|
|
|
|
23.5% |
24.5% 24.5% |
|
|
23.5% |
|
|
|
|
|
|
|
||||||||||||||||||||||||
|
|
|
|
|
|
|
|
|
|
|
|
|
|
|
|
|
|
|
|
|
21.0% |
|
|
||||||||||||||||||||||||||
|
|
|
|
|
|
|
|
|
|
|
|
|
|
|
|
|
|
18.0% |
18.5% |
|
16.0% |
|
Average LT cash burn, 24.8% |
|
|
|
30% |
||||||||||||||||||||||
|
|
|
|
|
|
|
|
|
|
|
14.5% |
|
|
|
|
|
15.0% |
|
|
|
|
14.5% |
|
||||||||||||||||||||||||||
19,999 |
|
|
|
|
|
|
|
|
|
12.5% 12.5% |
|
11.0% |
|
|
12.5% |
13.5% 13.5% |
|
|
|
|
|
|
|
|
|
|
14.0% |
12.0% |
14.0% |
20% |
|||||||||||||||||||
|
|
|
|
|
|
|
|
|
|
|
|
|
|
|
|
|
|
|
|
|
|
|
|||||||||||||||||||||||||||
|
|
|
|
|
|
|
|
|
|
|
|
|
|
|
|
|
|
|
|
|
|
|
|
||||||||||||||||||||||||||
9,999 |
0.5% |
0.0% |
1.0% |
4.0% |
2.0% |
7.0% |
|
|
|
6.0% |
6.0% |
6.5% |
|
|
|
|
|
|
|
|
|
|
12,995 10% |
||||||||||||||||||||||||||
|
10,459 |
|
|
|
|
|
|
|
|
|
|
|
|
|
|||||||||||||||||||||||||||||||||||
|
|
|
|
|
|
|
|
|
|
|
|
|
|
|
|
|
|||||||||||||||||||||||||||||||||
-1 |
Mar 07 |
Jun 07 |
Sep 07 |
Dec 07 |
Mar 08 |
Jun 08 |
Sep 08 |
Dec 08 |
Mar 09 |
Jun 09 |
Sep 09 Dec 09 |
Mar 10 |
Jun 10 |
Sep 10 |
Dec 10 |
Mar 11 |
Jun 11 |
Sep 11 |
Dec 11 |
Mar 12 |
Jun 12 |
Sep 12 |
Dec 12 |
Mar 13 |
Jun 13 |
Sep 13 |
Dec 13 |
Mar 14 |
Jun 14 Sep 14 |
Dec 14 |
Mar 15 |
Jun 15 |
Sep 15 |
Dec 15 |
Mar 16 |
Jun 16 |
Sep 16 |
Dec 16 |
Mar 17 |
Jun 17 |
Sep 17 |
Dec 17 |
Mar 18 |
Jun 18 |
Sep 18 |
Dec 18 |
Mar 19 |
Spot |
0% |
|
|
||||||||||||||||||||||||||||||||||||||||||||||||
Source: Bloomberg, CRU, Renaissance Capital estimates
Our long-term nickel price forecast of $15,000/t is around the 90th percentile of the nickel cost curve.
Figure 86: Nickel price vs cash costs* at the 90th percentile |
Figure 87: Nickel price premium (discount) to the 90th percentile |
|
|
|
Cash costs, $/t |
|
|
Nickel average price. $/t |
|
|
60% |
46% |
|
|
|
|
|||
|
40,000 |
|
|
|
|
|
|
|
|
|
|
|
|
|
|
||
|
|
|
|
|
|
|
|
|
|
|
|
|
|
|
|
||
|
|
|
|
|
|
|
|
|
|
|
|
|
|
|
|
|
|
$/t |
35,000 |
25,461 |
23,297 19,074 21,898 24,934 22,585 |
19,893 |
18,877 |
15,436 |
14,508 |
13,130 |
11,530 14,285 |
14,680 |
14,000 |
40% |
|
9%- |
|
0% |
8%- |
|
|
|
|
|
|
|
|
|
Forecasts |
|
|
|
|
|
|
|
|
|
30,000 |
|
|
|
|
|
|
|
|
|
|
20% |
|
|
|
|
|
|
25,000 |
|
|
|
|
|
|
|
|
|
|
|
|
|
|
|
|
|
|
|
|
|
|
|
15,833 |
|
|
|
|
|
|
|
|
|
|
|
20,000 |
|
|
|
|
|
|
|
|
|
0% |
|
|
|
|
|
|
|
|
|
|
|
|
|
|
|
|
|
|
|
|
|
|
||
|
15,000 |
|
|
|
|
|
|
|
|
|
|
-20% |
|
|
|
|
|
|
10,000 |
|
|
|
|
|
|
|
|
|
|
|
|
|
|
|
|
|
|
|
|
|
|
|
10,404 |
|
|
|
|
|
|
-23% |
|
|
|
|
5,000 |
|
|
|
|
|
|
|
|
|
-40% |
|
|
|
|
||
|
|
|
|
|
|
|
|
|
|
|
|
|
|
|
|
||
|
0 |
2007 |
2008 2009 2010 2011 2012 |
2013 |
2014 |
2015 |
2016 |
2017 2018E |
2019E 2020E |
2021E |
LT (real) |
-60% |
|
|
|
|
|
|
|
2007 |
2008 |
2009 |
2010 |
2011 |
|||||||||||
|
|
|
|||||||||||||||
*Cash costs net of by-product credits plus sustaining capex. |
|
|
|
|
|
|
|
|
|
|
|
|
|
||||
|
|
|
|
|
Source: Bloomberg, Renaissance Capital estimates |
|
|
|
|
|
|
||||||
Historical average, -13% |
|
|
|
|
|||||
-22% |
-24% |
-11% |
-23% |
-34% |
-34% |
-11% |
-24% |
-9% |
-9% |
2012 |
2013 |
2014 |
2015 |
2016 |
2017 |
2018E |
2019E |
2020E |
2021E |
Source: Bloomberg, Renaissance Capital estimates
47
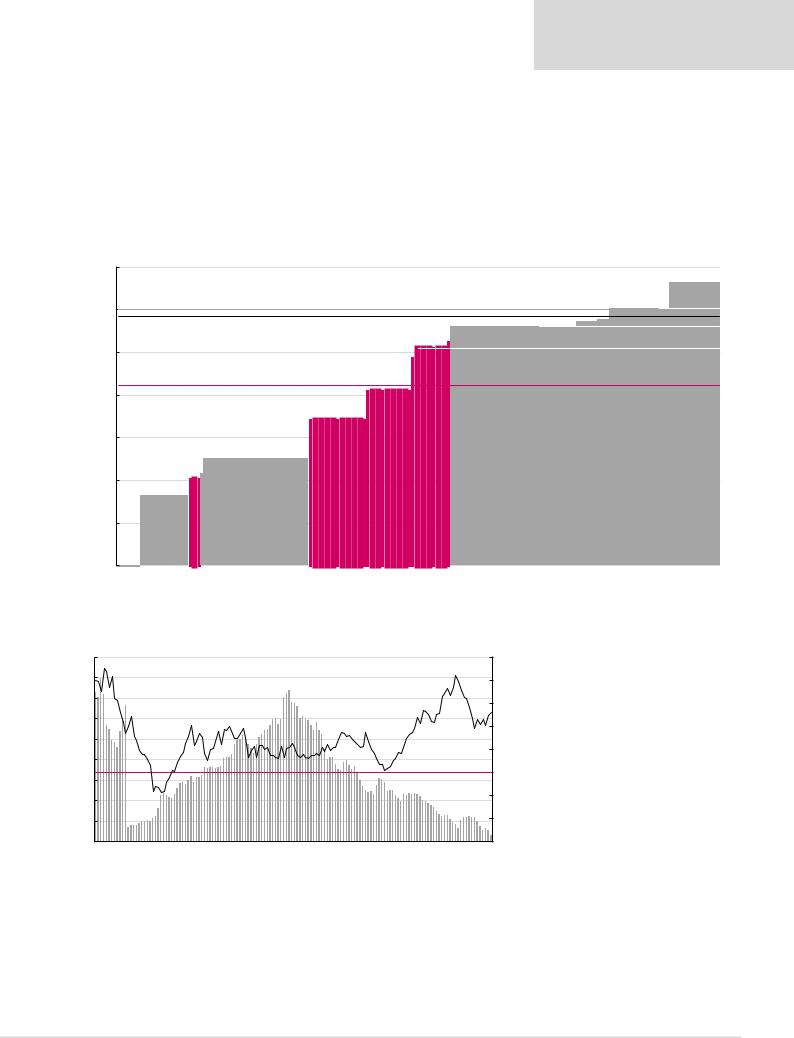
vk.com/id446425943
Zinc
Low inventory levels of around five days are supportive for zinc prices at around $2,920/t. We forecast our long-term zinc price at $2,800/t, which is below our estimate of $3,017/t at the 90th percentile of the cost curve. We believe the incentive price to build new zinc projects is around $3,000/t. Glencore has around 400kt of latent zinc capacity that could come back over the medium term, and Gamsberg is ramping up to around 250k tpa by 2020.
Renaissance Capital
1 April 2019
Metals & Mining
Zinc cost curve (6mnt out of global supply of around 14mnt)
Figure 88: 2018 zinc cash costs plus sustaining capex, $/t |
|
|
|
|
|
|
|
|
||||
|
3,500 |
|
|
|
|
|
|
|
|
|
|
|
|
3,000 |
Incentive price: $3,000/t |
|
|
|
|
|
|
|
90th percentile: $3,017/t |
||
|
|
|
|
|
|
|
|
|
|
|
Votorantim,3,017 |
|
|
|
Spot price: $2,920/t* |
1,253(Vedanta),Hindustan |
1,705(TECK),MineDogRed |
2,039(GLEN),Australia |
2,430(SCCO),unitIMMSAMexican |
2,541(TECK),MineTrail |
2,616(TECK),MineOreillePend |
2,805Nyrstar, |
Noranda,2,864 Manitoba,2,889 |
||
$/t |
2,500 |
828Boliden, |
AmericaNorth |
|||||||||
|
|
|
|
|
|
|
|
|
|
|
|
|
|
|
Average cash cost: $2,116/t |
|
|
|
|
|
|
|
|
||
|
2,000 |
|
|
|
|
|
|
|
|
|
|
|
|
1,500 |
|
1,011 |
|
|
|
|
|
|
|
|
|
|
|
|
|
|
|
|
|
|
|
|
|
|
|
1,000 |
|
(GLEN), |
|
|
|
|
|
|
|
|
|
|
|
|
1,079 |
|
|
|
|
|
|
|
|
|
|
500 |
|
Griffin, |
|
|
|
|
|
|
|
|
|
|
|
|
|
|
|
|
|
|
|
|
|
|
|
0 |
|
|
|
|
|
|
|
|
|
|
|
Estimated top, 3,318
*Priced as at 26 March 2019.
Source: Bloomberg, Company data, Renaissance Capital
Figure 89: LME inventory days of zinc slab demand and price, $/t
45 |
3,587 |
|
|
|
|
|
|
|
|
|
|
|
|
|
|
|
|
3,596 |
|
|
4,000 |
|
|
|
|
|
|
|
|
|
|
|
|
|
|
|
|
|
|
|
|
|
|||
40 |
|
|
|
|
|
|
|
37 |
|
|
|
|
|
|
|
|
|
|
|
|
|
3,500 |
35 |
33 |
|
|
|
|
|
|
|
|
|
|
|
|
|
|
|
2,853 |
|
|
2,8143,000 |
||
|
|
2,529 |
|
|
|
|
|
|
29 |
|
|
|
|
|
|
|
|
|
||||
30 |
28 |
|
|
|
|
|
|
|
|
|
2,367 |
|
|
|
|
|
|
|
||||
|
|
|
|
|
|
|
|
|
|
|
|
|
|
|
|
|
|
|||||
|
|
|
|
|
|
|
|
|
|
|
|
|
|
|
|
|
|
2,500 |
||||
|
|
|
|
|
|
|
|
|
|
|
|
|
|
|
|
|
|
|
|
|
|
|
25 |
|
1,897 |
|
20 |
|
|
|
|
|
|
|
|
|
|
|
|
|
|
|
|
|
|
|
|
|
|
|
|
|
|
|
|
|
|
|
|
|
|
|
|
|
|
|
2,000 |
|
|
|
|
|
|
|
|
|
|
|
|
|
|
18 |
|
|
|
|
|
|
|
|
|
20 |
Average exchange stock days, 17 |
|
|
|
|
|
|
|
|
|
|
|
|
|
|
|
|
|||||
|
|
|
|
|
|
|
|
|
|
|
|
|
|
|
|
|
||||||
|
|
|
|
|
|
|
|
|
|
|
|
|
|
|
|
|
1,500 |
|||||
15 |
|
|
|
|
|
|
|
|
|
|
|
|
|
|
|
|
|
|
|
|
|
|
|
|
11 |
|
|
|
|
|
|
|
|
|
|
|
|
11 |
|
|
|
|
|
|
|
|
|
|
|
|
|
|
|
|
|
|
|
|
|
|
|
|
|
|
|
1,000 |
||
10 |
|
|
|
|
|
|
|
|
|
|
|
|
|
|
|
|
|
|
6 |
|
|
|
|
|
|
|
|
|
|
|
|
|
|
|
|
|
|
|
|
|
5 |
|
|
||
|
|
4 |
|
|
|
|
|
|
|
|
|
|
|
|
|
|
|
4 |
|
500 |
||
5 |
|
|
|
|
|
|
|
|
|
|
|
|
|
|
|
|
|
|
2 |
|||
|
|
|
|
|
|
|
|
|
|
|
|
|
|
|
|
|
|
|
|
|||
|
|
|
|
|
|
|
|
|
|
|
|
|
|
|
|
|
|
|
|
|
||
0 |
|
|
Feb-09 Jul-09 Dec-09 May-10 |
Oct-10 Mar-11 |
|
|
|
|
|
|
|
Jul-14 |
|
|
|
Mar-16 |
|
|
|
|
|
0 |
Jan-07 |
Jun-07 Nov-07 |
Apr-08 Sep-08 |
Aug-11 |
Jan-12 |
Jun-12 |
Nov-12 |
Apr-13 |
Sep-13 |
Feb-14 |
Dec-14 |
May-15 |
Oct-15 |
Aug-16 Jan-17 Jun-17 |
Nov-17 Apr-18 |
Sep-18 |
Feb-19 |
|
|||||
Note: Calculated as exchange inventory/global zinc slab demand*365.
Source: Bloomberg, Renaissance Capital
Zinc inventory days are well below long-term average levels
48
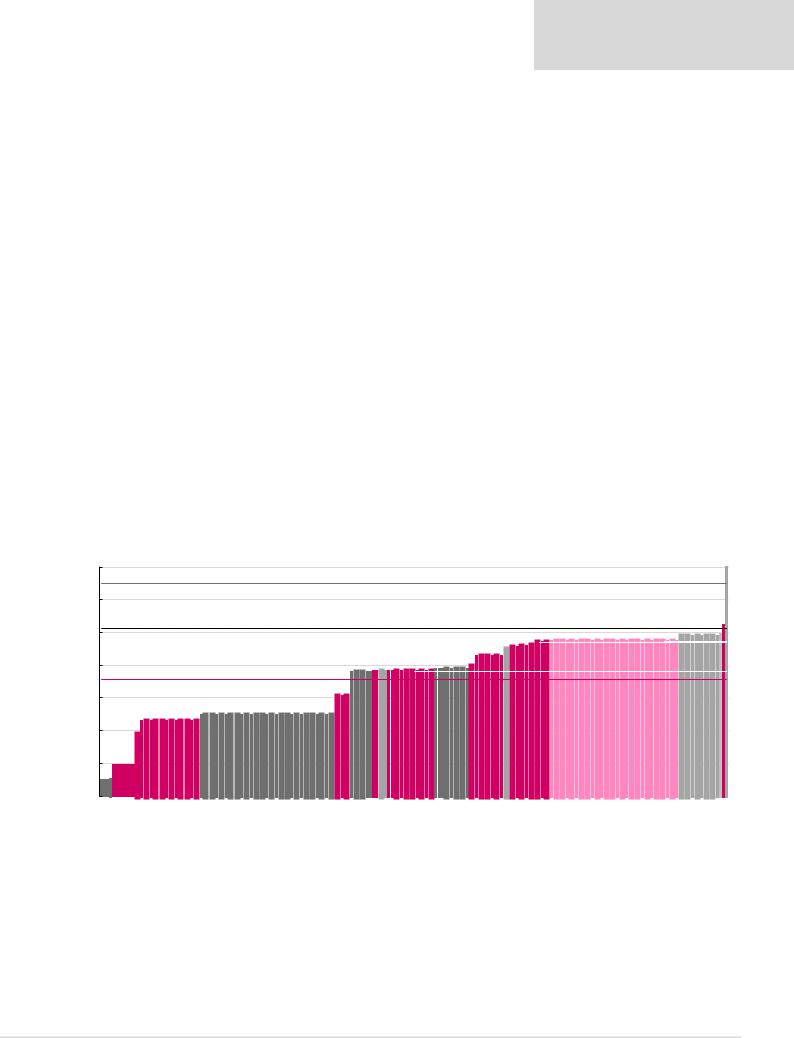
vk.com/id446425943
Diamonds
Alrosa believes the supply/demand fundamentals for diamonds are favourable. Supply is constrained, with global supply forecast to decline by around 4mn ct (3%) over the next five years. Around 21.3mn ct is expected to exit the market from mines such as Argyle (- 14mn ct), Diavik (-3.5mn ct), Gahcho Kue (-2.9) and Victor (-0.9). This could be somewhat offset by production increases of around 12.8mn ct at Ekati, Luaxe, Chidliak, Star Orion South, Debswana and DBCM.
Alrosa sees strong demand growth for diamonds up to 2030 driven by disposable income growth and middle-class expansion.
Given these favourable supply-demand fundamentals. Alrosa believes that the accumulated diamond supply deficit from 2019 to 2030 could be 20-70% of 2018 production.
Diamonds benefit from a highly consolidated industry, with the top-three players enjoying 63% market share. This has historically resulted in less price volatility than for other commodities.
Renaissance Capital
1 April 2019
Metals & Mining
Constrained supply outlook
Strong demand growth
Highly consolidated industry
In Alrosa’s view, lab-grown diamonds (LGD) seem to be of little concern to the midstream |
Synthetics not seen as a major threat |
and jewellery segment, as they are sceptical about this product replacing naturals. The base |
|
case, according to people in the industry, is that LGDs will be fashion jewellery for everyday |
|
use (Swarovski-like, rather than Tiffany-like products). The company draws parallels to lab |
|
grown sapphires which first appeared in the 1970s and started commercial production in the |
|
1990s. In 2017 lab-grown sapphires were only at around 15% market share and attracted |
|
price discounts of 80-90% compared with natural stones. |
|
Diamonds cost curve (106mn cts)
Figure 90: 2017 diamonds all-in sustaining cash costs, $/ct
280
Incentive price: $260/ct
240
Spot price: $205/ct*
200 |
|
|
|
|
|
|
|
|
|
|
|
|
|
|
|
|
90th percentile: $190/ct |
209 |
||
|
|
|
|
|
|
|
|
|
|
|
|
|
|
|
|
|
|
|
||
|
|
|
|
|
|
|
|
|
|
|
|
|
|
|
|
|
|
Catoca mine, 195 |
198 |
|
160 |
|
|
|
|
|
|
|
|
|
|
|
|
|
pit |
-1 pipe, 183 |
Aikhal mine, 188 |
Rio Tinto, 190 |
pipe, |
||
Average cash cost: $142/ct |
|
|
|
|
|
|
|
|
|
|
180 |
|||||||||
|
|
|
|
152 153 |
|
153 153 |
|
|
|
|
Petra, |
(JV) -Petra, |
||||||||
|
|
|
|
|
|
|
|
|
|
|
|
|||||||||
120 |
|
|
|
|
|
|
mine, |
|
pipe, |
|
|
|
|
- |
||||||
|
|
|
|
|
|
|
|
|
|
|
|
|||||||||
|
|
|
|
|
|
|
Petra,- |
|
(Nyurba), |
|
|
|
|
underground |
||||||
80 |
|
|
|
|
|
|
Zarnitsa |
|
deposits |
|
|
|
|
Cullinan |
mine,182 |
Zapolyarnaya |
||||
|
|
|
|
|
|
|
|
|
|
|
|
|||||||||
40 |
|
|
|
|
|
|
|
Botuobinskaya |
|
|
|
|
||||||||
Namdeb,20 |
Internatsionalnymine,39 deposits(Mirny),Aluvial75 |
Jubileepipe,92 |
Debswana,99 |
mine,122Mir |
Canada,Beers151De |
Finsch |
Nyurbinsky,153 |
Alluvial |
Africa,BeersSouth155De |
Udachnayamine,open159pit |
AnabaraAlmazyNizhne&- |
Lenskoye,171 |
Udachnaya |
Karpinskogo Arkhangeskayapipe,184 |
KEM |
|||||
|
||||||||||||||||||||
0 |
|
|
|
|
|
|
|
|
|
|
|
|
|
|
|
|
|
|
|
|
*Priced as at 26 March 2019.
Source: Bloomberg, Renaissance Capital
49
vk.com/id446425943
Thermal coal
Increased energy demand in emerging markets continues to drive growth in thermal coal demand. Ironically, China’s environmental clean-up effort is increasing demand for electricity (electric vehicles etc.). Given that thermal coal is perceived to be a ‘dirty’ commodity from an environmental perspective, very few Western mining companies are building new thermal coal mines. We believe that some banks may also not be willing to lend to companies that wish to build new coal mines. We believe a shortage of capital invested in new thermal coal supply against a stable demand backdrop over the medium term could support favourable prices.
We believe the Chinese authorities may regulate thermal coal prices in a range of around $70-100/t, to maintain profitability for coal miners and electricity generators.
Renaissance Capital
1 April 2019
Metals & Mining
Thermal coal cost curve (1,635mnt)
Figure 91: 2018E thermal coal cash costs plus sustaining capex, $/t
|
120 |
|
|
|
|
|
|
100 |
|
|
|
|
|
|
|
Incentive price: $90/t |
|
|
|
|
|
80 |
Spot price: $74/t* |
|
|
|
82 |
|
|
|
|
|
||
|
|
Glencore,60 |
BHP, 66 |
American,Anglo 67 |
RainbowAfricanMinerals, 72 |
|
$/t |
20 |
Exxaro, |
||||
|
60 |
Average cash cost: $68/t |
|
|
|
|
|
40 |
|
|
|
|
|
|
0 |
|
|
|
|
|
90th percentile: $92/t
70th percentile: $72/t
South32, 84
Note: Coal consists of seaborne supply, including coastal trade in China (i.e. coal that is shipped from northern Chinese ports to southern ports). *Priced as at 26 March 2019
Source: Bloomberg, CRU, Renaissance Capital estimates (in pink)
Around 27% of the thermal coal industry is cash-burning at spot prices.
Figure 92: Percentage of thermal coal cost curve that is cash-burning over time
|
180 |
|
|
|
|
|
|
|
% Cash burning |
|
|
|
|
Thermal coal (FOB Richard's Bay), $/t |
|
|
|
Average LT cash burn |
|
|
|
70% |
||||||||||||||||||||
|
|
|
|
|
|
|
|
|
157 |
|
|
|
|
|
|
|
|
|
|
|
|
|
|
58.5% |
|
|
|
|
|
|
60.0% |
64.0% |
51.5% |
|
|
|
|
|
|
|
|
|
|
160 |
|
|
|
|
48.0% |
47.0% |
|
|
|
48.0% |
|
|
|
|
|
|
|
|
|
49.5% |
|
49.5% |
|
|
|
|
|
51.0% |
|
|
|
|
|
|
|
|
60% |
||||
|
|
|
|
|
|
|
|
|
45.5% |
|
|
|
|
|
|
|
45.0% |
|
|
|
|
|
45.5% 45.0% 45.0% |
|
|
|
|
|
|
|
|
|||||||||||
|
140 |
|
|
|
|
|
|
|
|
|
|
|
121 |
|
41.0% |
|
41.0% |
|
|
39.0% |
|
|
|
|
|
|
|
|
|
|||||||||||||
|
|
|
|
|
|
37.0% |
|
|
|
|
|
|
|
|
|
37.0% |
|
|
|
|
|
|
|
|
50% |
|||||||||||||||||
|
120 |
35.5% |
|
|
35.5% |
|
35.5% |
35.5% |
34.5% |
|
|
|
|
35.5% |
36.0% |
|
|
|
|
|
|
|
|
|||||||||||||||||||
|
33.5% |
32.0% |
31.0% |
|
33.0% |
|
|
32.0% |
|
|
|
|
|
102 |
|
|
||||||||||||||||||||||||||
|
|
30.5% |
|
|
|
|
|
|
|
|
|
|||||||||||||||||||||||||||||||
|
100 |
|
29.5% |
|
|
|
|
|
|
|
40% |
|||||||||||||||||||||||||||||||
$/t |
|
|
|
|
|
|
|
|
|
|||||||||||||||||||||||||||||||||
80 |
|
|
|
|
|
|
|
74 |
|
|||||||||||||||||||||||||||||||||
|
|
|
|
|
|
|
|
|
|
|
|
|
|
|
|
|
19.5% |
|
|
|
|
|
|
|
Average LT cash burn, 29.1% |
|
17.0% |
|
|
|
|
|
30% |
|||||||||
|
|
|
|
|
|
|
|
|
|
|
|
|
|
|
|
|
|
|
|
|
|
|
|
|
|
|
|
|
|
|
|
|
|
|
|
|
|
|
|
|||
|
60 |
|
|
|
|
|
|
|
|
|
|
|
|
|
|
|
|
|
|
|
|
|
|
|
|
|
|
|
|
|
|
|
|
12.0% |
11.5% |
|
9.5% |
|
12.0% |
20% |
||
|
|
|
|
|
|
|
|
|
|
|
|
|
|
|
|
|
|
|
|
|
|
|
|
|
|
|
|
|
|
|
|
|
9.0% |
|
|
|||||||
|
40 |
|
|
|
|
|
53 |
|
|
|
|
|
|
|
|
|
3.0% 2.5% 2.5% 3.0% |
|
|
|
|
|
|
|
|
|
|
|
|
51 |
|
|
5.0% |
5.0% 5.0% 5.0% |
|
|||||||
|
|
|
|
|
|
|
1.0% 1.5% |
0.5% 0.5% |
|
|
|
|
|
|
|
|
|
|
|
|
|
|
|
|
|
|
|
|
|
10% |
||||||||||||
|
20 |
|
|
|
|
|
|
|
|
|
|
|
|
|
|
|
|
|
|
|
|
|
|
|
|
|
|
|
|
|||||||||||||
|
|
|
|
|
|
|
|
|
|
|
|
|
|
|
|
|
|
|
|
|
|
|
|
|
|
|
|
|
|
|||||||||||||
|
|
|
|
|
|
|
|
|
|
|
|
|
|
|
|
|
|
|
|
|
|
|
|
|
|
|
|
|
|
|
||||||||||||
|
0 |
Mar 06 Jun 06 Sep 06 Dec 06 Mar 07 Jun 07 Sep 07 Dec 07 Mar 08 Jun 08 Sep 08 Dec 08 Mar 09 Jun 09 Sep 09 Dec 09 Mar 10 Jun 10 Sep 10 Dec 10 Mar 11 Jun 11 Sep 11 Dec 11 Mar 12 Jun 12 Sep 12 Dec 12 Mar 13 Jun 13 Sep 13 Dec 13 Mar 14 Jun 14 Sep 14 Dec 14 Mar 15 Jun 15 Sep 15 Dec 15 Mar 16 Jun 16 Sep 16 Dec 16 Mar 17 Jun 17 Sep 17 Dec 17 Mar 18 Jun 18 Sep 18 Dec 18 Mar 19 Spot |
0% |
|||||||||||||||||||||||||||||||||||||||
|
|
|
||||||||||||||||||||||||||||||||||||||||
Source: Bloomberg, CRU, Renaissance Capital estimates
50
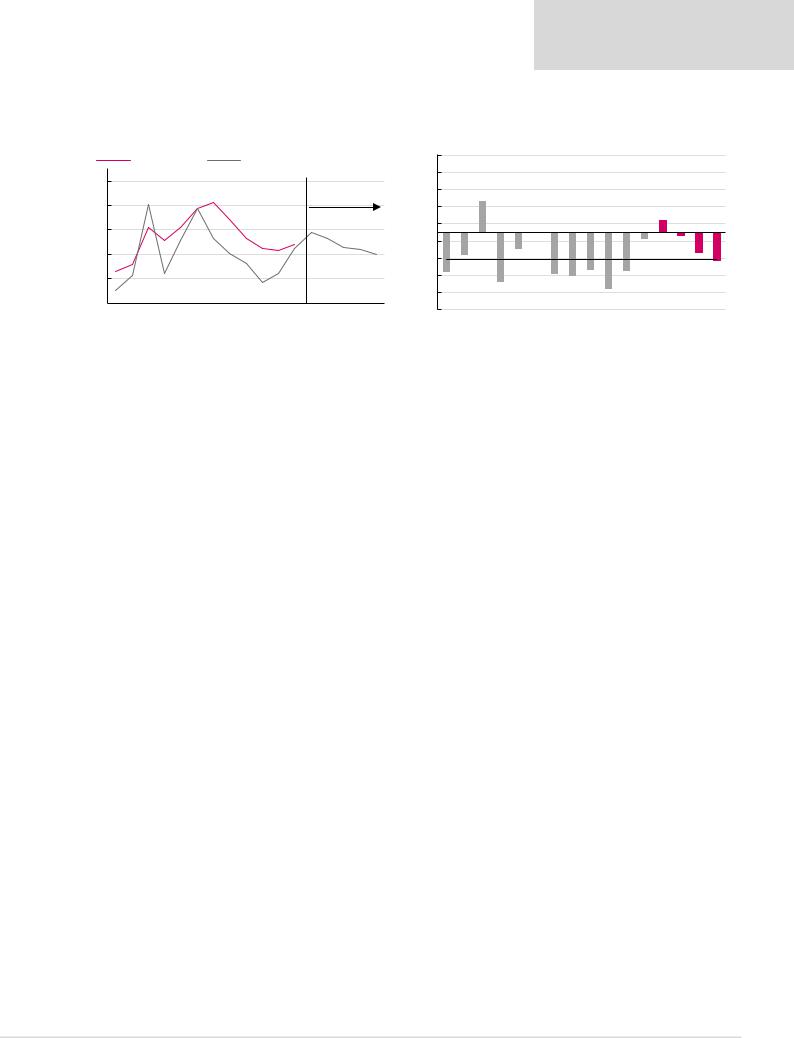
vk.com/id446425943
Renaissance Capital
1 April 2019
Metals & Mining
Our long-term thermal coal price of $80/t is around 13% below the 90th percentile of the cost curve.
Figure 93: Thermal coal price vs cash costs* at the 90th percentile |
Figure 94: Thermal coal price premium (discount) to the 90th percentile |
|
|
Cash costs, $/t |
|
|
Thermal coal average price. $/t |
|
45% |
|
|
|
|
|
|
|
|
|
|
|
|
||||||||||
|
|
|
|
|
|
|
|
|
|
|
|
|
|
|
|
|
|
||||||||||||
|
140 |
|
|
|
|
|
122 |
|
|
|
|
|
|
|
|
|
35% |
|
18% |
|
|
|
|
|
|
|
|
|
|
$/t |
|
102 |
91 |
102 |
117 |
109 |
93 |
85 |
83 |
88 |
|
86 |
84 |
|
25% |
|
|
|
0% |
|
|
|
7% |
|
|
|
|||
|
|
|
|
|
|
|
|
|
|
|
|
|
|||||||||||||||||
|
|
|
|
|
|
|
|
|
|
|
|
|
Forecasts |
|
|
|
|
|
|
|
|
|
|
|
|
|
|||
|
120 |
|
|
|
|
|
|
|
|
|
|
|
|
15% |
|
|
|
|
|
|
|
|
|
|
|
|
|||
|
|
|
|
|
|
|
|
|
|
|
|
|
|
|
|
|
|
|
|
|
|
|
|
|
|
|
|
||
|
100 |
|
|
|
|
|
|
|
|
|
|
98 |
93 |
|
|
|
5% |
|
|
|
|
|
|
|
|
|
|
|
|
|
|
|
|
|
|
|
|
|
|
|
|
|
|
|
80 |
|
|
|
|
|
|
|
|
|
|
|
|
|
|
|
|
2007 72 |
|
|
|
|
|
|
|
|
|
|
|
|
|
-5% |
|
|
|
|
Historical average, -16% |
|
2017 -4% |
|
2019E -2% |
|
|
||
|
80 |
|
|
|
|
|
|
|
|
|
|
|
|
|
|
|
|
|
|
|
|
|
|
|
|||||
|
|
|
|
|
|
|
|
|
|
85 |
|
|
|
|
-15% |
|
|
|
|
|
|
|
|
|
|
||||
|
|
|
|
|
|
|
|
|
|
|
|
|
|
|
|
|
|
|
|
|
|
|
|
|
|||||
|
60 |
|
|
|
|
|
|
|
|
|
|
|
|
|
|
-25% |
|
|
|
|
|
|
|
|
|
|
|||
|
|
|
|
|
|
|
|
|
|
|
|
|
|
|
|
|
|
|
|
|
|
|
|
|
|
||||
|
|
|
|
|
|
|
|
|
|
|
|
|
|
|
|
-35% |
|
|
|
|
|
|
|
|
|
|
|||
|
40 |
|
|
|
|
|
|
|
|
|
|
|
|
|
|
-45% |
|
|
|
|
|
|
|
|
|
|
|||
|
200666 |
|
|
|
|
|
|
|
|
|
|
|
|
|
|
200713%- |
|
200929%- |
201010%- |
|
201224%- 201326%- 201422%- 201533%- |
201623%- |
|
2020E12%- |
2021E16%- |
||||
|
2008 |
2009 |
2010 |
2011 |
2012 |
2013 |
2014 |
2015 |
2016 |
2017 2018E |
2019E |
2020E |
2021E |
LT(real) |
200623%- |
2008 |
2011 |
2018E |
|||||||||||
*Cash costs net of by-product credits plus sustaining capex.
Source: Bloomberg, Renaissance Capital estimates |
Source: Bloomberg, Renaissance Capital estimates |
51
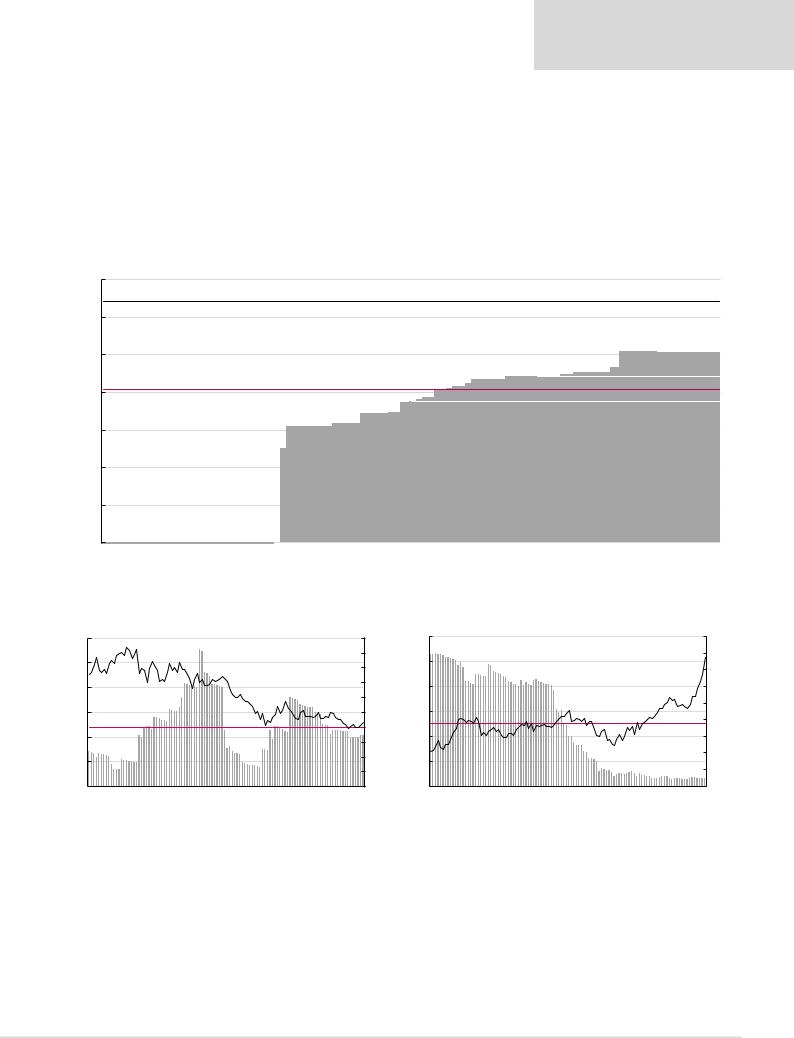
vk.com/id446425943
Platinum group metals (13mn oz)
We see downside risk to the spot PGM basket price, which is trading above cost support and could suffer from escalating fears of a global slowdown and falling vehicles sales.
However, we believe the price differential between platinum and palladium is unsustainable, and forecast this to close over the medium term as platinum is substituted for palladium in gasoline auto catalysts.
Longer term, we continue to see a risk that low-cost supply and recycling growth could outstrip incremental demand growth and effectively displace some of the high-cost South African mine supply, potentially lowering cost support.
Figure 95: 2018E 3PGM cash costs plus sustaining capex, $/oz
1,400
1,200 |
3PGM price: $1,282/oz* |
|
|
|
|
|
|
|
|
|
|
|
|
|
|
|
|
|
|
|
|
|
|
|
|
1,000 |
|
|
|
|
|
|
|
|
|
|
|
|
|
Average cash cost: $815/oz |
|
|
|
|
|
|
|
|
|
Mototolo(AMS), 887 |
Lonmin, 888 |
800 |
|
|
|
|
|
|
815 |
RiversTwo(IMP), 822 |
Kroondal(SGL), 834 |
Amandelbult(AMS), 868 |
||
$/oz |
Norilsk |
503(THA),Tharisa |
(AMS),Mogalakwena622 |
(SGL),Stillwater637 (IMP),Zimplats689 |
(NHM),Booysendal695 Modikwa |
|
||||||
Zondereinde |
||||||||||||
|
|
|
|
|
|
772 |
|
|
|
|
|
|
|
|
|
|
|
763 |
|
|
|
|
|
|
|
|
|
|
|
|
751 |
|
(IMP), |
|
|
|
|
|
|
|
|
|
|
(SGL), |
|
|
|
|
|
||
600 |
|
|
|
|
(AMS), |
(NHM), |
|
|
|
|
|
|
400 |
|
|
|
|
Mimosa |
Mimosa |
|
|
|
|
|
|
|
|
|
|
|
|
|
|
|
|
|
|
|
200 |
|
|
|
|
|
|
|
|
|
|
|
|
0 |
|
|
|
|
|
|
|
|
|
|
|
|
*Priced as at 26 March 2019; |
|
|
|
|
|
|
|
|
|
|
|
|
Note: 3PGM basket (57% Pt, 36% Pd, 7% Rh). |
|
|
|
|
|
|
|
|
|
|
|
|
Renaissance Capital
1 April 2019
Metals & Mining
90th percentile: $1019/oz
905 |
Marula(IMP),932 |
Rustenburglease (IMP),1,019 |
895 |
||
Rustenburg |
||
(SGL), |
|
|
(RBP),BRPM |
|
|
Source: Bloomberg, Renaissance Capital estimates
Figure 96: NYMEX platinum inventory days and price, $/oz (RHS) |
Figure 97: NYMEX palladium inventory days and price, $/oz (RHS) |
16 |
1,737 |
|
1,846 |
|
|
|
15 |
|
|
|
|
|
|
|
|
|
|
|
|
|
2,000 |
30 |
|
|
|
|
1,662 |
|
|
|
|
|
|
|
|
|
|
|
|
|
|
|
|
|
|||
|
|
|
|
|
|
|
|
|
|
|
|
|
|
|
|
|
|
|
|
1,800 |
|
||
14 |
|
|
|
|
|
|
|
|
|
|
|
|
|
|
|
|
|
|
|
|
|
25 |
|
|
|
|
|
|
|
|
|
|
|
|
|
|
|
|
|
|
|
|
|
|
1,600 |
||
|
|
|
|
|
|
|
|
|
|
|
|
|
|
|
|
|
|
|
|
|
|
|
|
12 |
|
|
|
|
|
|
|
|
|
1,241 |
|
|
11 |
|
|
|
|
|
|
1,400 |
20 |
||
|
|
|
|
|
|
|
|
|
|
|
|
|
|
|
|
|
|
|
|
||||
Average exchange |
10 |
|
|
|
|
|
|
|
|
10 |
|
|
|
|
1,200 |
||||||||
|
|
|
|
|
|
|
|
|
|
983 |
|
|
|
||||||||||
10 |
|
stock days, 9 9 |
|
|
|
|
|
|
|
9 |
|
|
|
|
|
870 |
1,000 |
15 |
|||||
|
|
|
|
8 |
|
|
|
|
|
|
|
|
|
|
|
8 |
|
8 |
8 |
800 |
|
||
8 |
|
|
|
|
|
|
|
|
|
|
|
|
|
|
|
|
|
10 |
|||||
|
7 |
|
|
|
|
|
|
|
|
7 |
|
|
|
|
|
|
|
|
|
|
600 |
||
|
|
|
|
|
|
|
|
|
|
|
|
|
|
|
|
|
|
|
|
|
|||
6 |
|
|
5 |
|
|
|
|
|
|
|
|
6 |
|
|
|
|
|
|
|
|
400 |
5 |
|
|
|
|
|
|
|
|
|
|
|
|
|
|
|
|
|
|
|
|
|
|
200 |
||
|
|
|
|
|
|
|
|
|
|
|
|
|
|
|
|
|
|
|
|
|
|
|
|
4 |
Jan-10 |
Jun-10 |
Nov-10 |
Apr-11 Sep-11 Feb-12 |
Jul-12 |
Dec-12 |
May-13 |
Oct-13 |
Mar-14 |
Aug-14 |
Jan-15 |
Jun-15 |
Nov-15 |
Apr-16 |
Sep-16 |
Feb-17 |
Jul-17 |
Dec-17 |
May-18 |
Oct-18 |
|
0 |
0 |
|
|
|
|
||||||||||||||||||||
26 |
|
|
|
|
|
|
|
|
|
|
|
|
|
|
|
|
|
1,5471,800 |
||
|
24 |
|
24 |
|
|
|
|
|
|
|
|
|
|
|
|
|
|
|
1,600 |
|
|
|
20 |
|
|
|
20 |
|
|
|
|
|
|
|
|
|
|
|
|
1,400 |
|
|
|
|
|
|
|
|
|
|
|
|
|
|
|
1,064 |
|
|
|
|||
|
|
|
|
|
|
|
|
|
|
|
|
|
|
|
|
|
|
|
1,200 |
|
|
|
|
|
|
|
|
|
|
|
906 |
|
|
|
|
|
|
|
|
||
|
|
|
|
|
|
|
|
|
|
|
|
|
|
|
|
|
|
|
||
|
|
|
|
|
|
|
|
|
15 |
|
|
|
|
|
827 |
|
|
1,000 |
||
|
|
|
|
|
|
|
|
|
|
|
|
677 |
|
|
|
1,081 |
800 |
|||
|
|
|
|
|
|
|
|
|
|
|
|
|
|
|
|
|
|
|||
|
|
|
|
|
|
|
|
|
|
|
|
|
|
|
|
|
|
|
|
|
|
|
|
|
|
|
|
|
|
|
|
7 |
|
|
Average exchange |
|
|
600 |
|||
|
|
|
|
|
|
|
|
|
|
|
|
|
|
stock days, 12 |
|
|
|
|||
|
|
|
|
|
|
|
|
|
|
|
|
|
|
|
|
|
400 |
|||
|
|
|
|
|
|
|
|
|
|
|
|
|
3 |
|
|
|
|
|
||
|
|
|
|
|
|
|
|
|
|
|
|
|
|
2 |
1 |
2 |
1 |
200 |
||
|
|
|
|
|
|
|
|
|
|
|
|
|
|
|
|
|||||
|
|
|
|
|
|
|
|
|
|
|
|
|
|
|
|
|
||||
Jan-10 Jun-10 |
Nov-10 |
Apr-11 |
Sep-11 |
Feb-12 |
Jul-12 |
Dec-12 |
May-13 |
Oct-13 |
Mar-14 |
Aug-14 |
Jan-15 |
Jun-15 |
Nov-15 |
Apr-16 |
Sep-16 |
Feb-17 |
Jul-17 Dec-17 May-18 |
Oct-18 |
|
0 |
|
|
|||||||||||||||||||
Note: Calculated as exchange inventory/global platinum demand*365. |
Note: Calculated as exchange inventory/global palladium demand*365. |
Source: Bloomberg, Renaissance Capital |
Source: Bloomberg, Renaissance Capital |
52
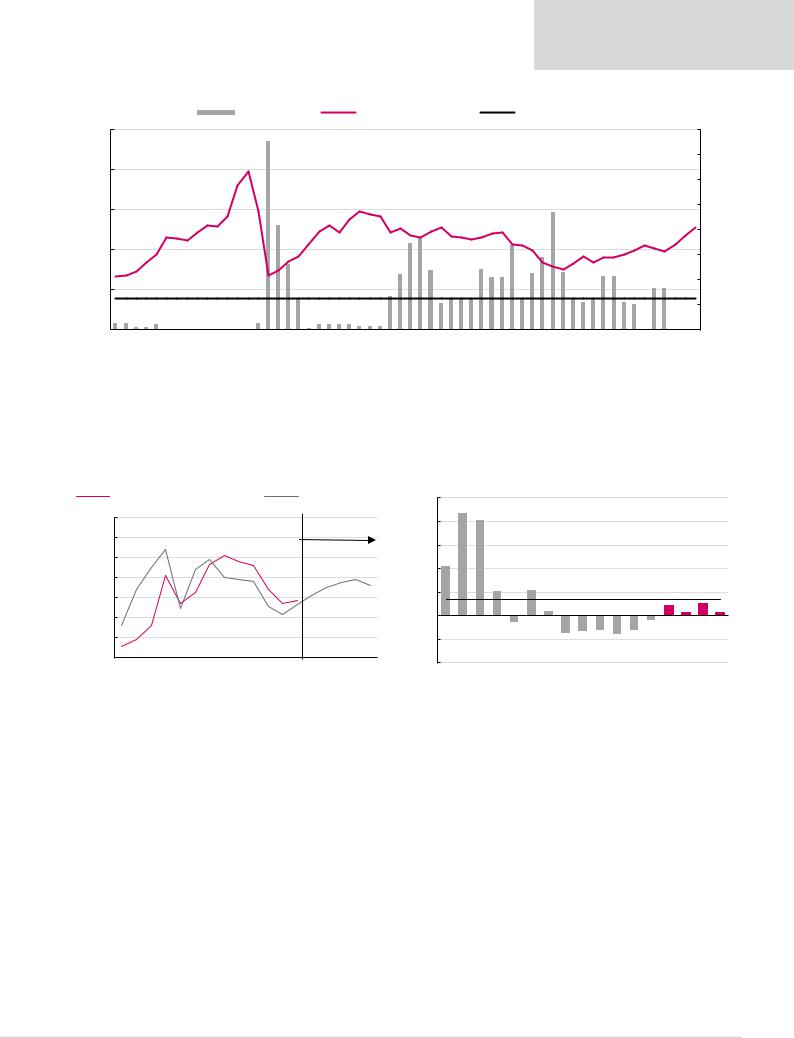
vk.com/id446425943
Renaissance Capital
1 April 2019
Metals & Mining
Figure 98: Percentage of 3PGM cost curve that is cash-burning over time
|
|
|
|
% Cash burning |
|
3PGM basket price, $/oz |
|
|
|
Average LT cash burn |
|
|
|
|
|
|
||||||||||||||||||
2,500 |
|
|
|
|
75.0% |
|
|
|
|
|
|
|
|
|
|
|
|
|
|
|
|
|
|
|
|
|
|
|
|
|
|
|
|
80% |
|
|
|
|
1,973 |
|
|
|
|
|
|
|
|
|
|
|
|
|
|
|
|
|
|
|
|
|
|
|
|
|
|
|
|
70% |
|
2,000 |
|
|
|
|
|
|
|
|
|
|
|
|
|
|
|
|
|
|
|
|
|
|
|
|
|
|
|
|
|
|
|
|
|
|
|
|
|
|
|
|
|
|
|
|
|
|
|
|
|
|
|
|
|
|
|
|
|
47.0% |
|
|
|
|
|
|
|
|
|
|
60% |
|
|
|
|
|
41.5% |
|
|
|
1,476 |
|
|
|
|
|
|
|
|
|
|
|
|
|
|
|
|
|
|
|
|
|
|
1,282 50% |
||
1,500 |
|
|
|
|
|
|
|
|
|
|
34.5% |
37.0% |
|
|
|
|
|
33.5% |
|
|
|
|
|
|
|
|
|
|
|
|
||||
|
|
|
|
|
|
|
|
|
|
|
|
|
|
|
|
|
|
|
|
|
|
|
|
|
|
|
|
|
|
40% |
||||
1,000 |
|
|
|
|
|
|
|
|
|
|
|
|
|
|
|
|
|
|
|
|
|
|
|
|
|
|
|
|
|
30% |
||||
|
667 |
|
|
|
|
|
|
|
|
|
|
|
|
|
|
|
|
|
|
|
|
|
|
|
|
|
|
|
|
|||||
|
|
|
|
|
|
|
|
|
|
|
|
|
|
|
|
|
|
|
|
|
|
|
|
|
|
|
|
|
|
|||||
|
|
Average LT cash burn, 12.4% |
|
|
|
|
|
|
|
|
|
|
|
|
|
|
|
|
|
|
|
|
|
|
|
|
|
20% |
||||||
500 |
|
679 |
|
|
|
|
|
|
|
|
|
|
|
|
|
|
|
|
|
|
|
|
|
|
|
|
|
|||||||
|
|
|
|
|
|
|
|
|
|
|
|
|
|
|
|
|
|
|
|
|
|
|
|
|
|
|
|
|
||||||
$/oz |
2.5% 2.5% |
1.0% 1.0% |
2.0% |
0.0% 0.0% 0.0% 0.0% 0.0% 0.0% 0.0% 0.0% 0.0% |
2.5% |
26.0% |
12.0% |
0.5% |
2.0% 2.0% 2.0% 2.0% 1.5% 1.5% 1.5% |
13.5% |
22.0% |
23.5% |
10.5% |
12.0% 12.5% 12.5% |
24.0% |
21.0% 21.0% |
12.0% |
22.5% |
29.0% |
23.0% |
12.0% |
11.0% |
12.0% |
21.5% 21.5% |
11.0% |
10.0% |
0.0% |
16.5% 16.5% |
0.0% 0.0% 0.0% |
10% |
||||
|
||||||||||||||||||||||||||||||||||
0 |
Mar 05 Jun 05 Sep 05 Dec 05 Mar 06 Jun 06 Sep 06 Dec 06 Mar 07 Jun 07 Sep 07 Dec 07 Mar 08 Jun 08 Sep 08 Dec 08 Mar 09 Jun 09 Sep 09 Dec 09 Mar 10 Jun 10 Sep 10 Dec 10 Mar 11 Jun 11 Sep 11 Dec 11 Mar 12 Jun 12 Sep 12 Dec 12 Mar 13 Jun 13 Sep 13 Dec 13 Mar 14 Jun 14 Sep 14 Dec 14 Mar 15 Jun 15 Sep 15 Dec 15 Mar 16 Jun 16 Sep 16 Dec 16 Mar 17 Jun 17 Sep 17 Dec 17 Mar 18 Jun 18 Sep 18 Dec 18 Mar 19 Spot |
0% |
||||||||||||||||||||||||||||||||
|
|
|||||||||||||||||||||||||||||||||
Source: Bloomberg, CRU, Renaissance Capital estimates
Our long-term 3PGM price forecast of $1,127/oz is around 11% above the 90th percentile of the 3PGM cost curve.
Figure 99: 3PGM price vs cash costs* at the 90th percentile |
Figure 100: 3PGM price premium (discount) to the 90th percentile |
|
|
90th percentile of 3PGM cost curve* |
|
|
|
3PGM basket price** |
100% |
|
87% |
81% |
|
|
|
|
|
|
|
|
|
|
|
|
|
|
|||||||||||||
|
|
|
|
|
|
|
|
|
|
|
|
|
|
|
|
|
|
|
|
|
|
||||||||||||||||
|
1,800 |
|
|
|
|
|
|
|
1,421 |
|
|
|
|
|
Forecasts |
|
80% |
|
|
|
|
|
|
|
|
|
|
|
|
|
|
|
|
|
|||
|
|
|
|
|
|
|
|
|
1,370 |
|
|
|
|
|
|
|
|
|
|
|
|
|
|
|
|
|
|
|
|
|
|
||||||
$/oz |
400 |
514 |
580 |
720 |
1,226 |
946 |
1,053 |
1,339 |
1,320 |
1,088 |
947 |
970933 |
1,127 |
|
42% |
|
|
21% |
6%- |
21% |
3% |
15%- |
14%- |
12%- |
16%- |
12%- |
4%- |
9% |
3% |
10% |
3% |
||||||
1,028 |
1,100 |
1,153 |
1,182 |
|
|
|
|||||||||||||||||||||||||||||||
|
1,600 |
|
|
|
|
|
|
|
|
|
|
|
|
|
|
|
|
|
|
60% |
|
|
|
|
|
|
|
|
|
|
|
|
|
|
|
|
|
|
1,400 |
|
|
|
|
|
|
|
|
|
|
|
|
|
|
|
|
|
|
|
|
|
|
|
|
|
|
|
|
|
|
|
|
|
|
|
|
|
1,200 |
|
|
|
|
|
|
|
|
|
|
|
|
|
|
|
|
|
|
40% |
|
|
|
|
|
|
|
|
|
|
|
|
|
|
|
|
|
|
|
|
|
|
|
|
|
|
|
|
|
|
|
|
|
|
|
|
|
|
|
|
|
|
|
|
|
Historical average, 14% |
|
|
|
||||||
|
|
|
|
|
|
|
|
|
|
|
|
|
|
|
|
|
|
|
|
20% |
|
|
|
|
|
|
|
|
|
|
|
||||||
|
1,000 |
|
|
|
|
|
|
|
|
|
|
|
|
|
|
|
|
|
|
|
|
|
|
|
|
|
|
|
|
|
|
|
|
|
|
|
|
|
|
|
|
|
|
|
|
|
|
|
|
|
|
|
|
|
|
|
|
|
|
|
|
|
|
|
|
|
|
|
|
|
|
|
|
|
|
|
800 |
|
|
|
|
|
|
|
|
|
|
|
|
|
|
|
|
|
|
0% |
|
|
|
|
|
|
|
|
|
|
|
|
|
|
|
|
|
|
600 |
|
|
|
|
|
|
|
|
|
|
|
|
|
|
|
|
|
|
-20% |
|
|
|
|
|
|
|
|
|
|
|
|
|
|
|
|
|
|
|
2005 |
2006 |
2007 |
2008 |
2009 |
2010 |
2011 |
2012 |
2013 |
2014 |
2015 |
2016 |
2017 |
2018E |
2019E |
2020E |
2021E |
LT (real) |
-40% |
2005 |
2006 |
2007 |
2008 |
2009 |
2010 |
2011 |
2012 |
2013 |
2014 |
2015 |
2016 |
2017 |
2018E |
2019E |
2020E |
2021E |
|
|
|
|||||||||||||||||||||||||||||||||||
*Cash costs net of by-product credits plus sustaining capex.
Source: Bloomberg, Renaissance Capital estimates |
Source: Bloomberg, Renaissance Capital estimates |
53
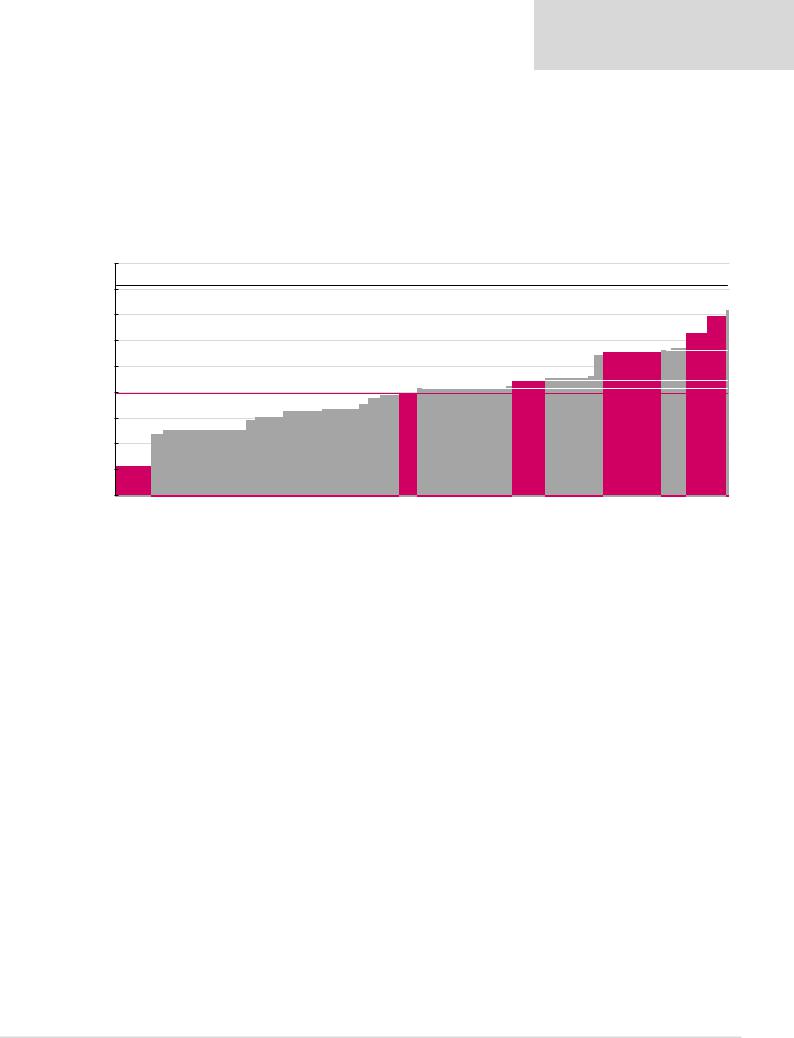
vk.com/id446425943
Gold
We believe increasing geopolitical uncertainty and escalating fears of a global slowdown could continue to increase investment demand for gold as a safe-haven asset, providing some support for the price over the near term. However, we maintain our cautious stance on gold’s long-term fundamentals, as it is still trading above its long-term average and is unlikely to outperform in a rising yield environment, in our view.
Renaissance Capital
1 April 2019
Metals & Mining
Gold cost curve (38.4mn oz)
Figure 101: 2017 gold all-in sustaining costs net of by-products, $/oz
1,400
Spot price: $1,315/oz*
|
1,300 |
|
1,200 |
|
1,100 |
$/oz |
1,000 |
|
900 |
Average all-in sustaining costs: $894/oz |
|
Fields,Gold944 |
|
614Polyus, |
Polymetal,893 |
|||
800 |
||||
|
|
|
||
700 |
|
|
|
|
600 |
|
|
|
|
500 |
|
|
|
Note: Priced as at market close on 26 March 2019.
90th percentile: $1,064/oz
70th percentile: $944/oz
50th percentile: $914/oz
AngloGold, 1,055 |
Sibanye, 1,129 |
Harmony, 1195 |
Source: Company data, Thomson Reuters
54