

- •Contents
- •Revisions to our forecasts, TPs and ratings
- •Investment stance
- •Capital cycle favours rising returns
- •Comfortable balance sheets and supportive dividend potential
- •Value relative to other stocks
- •Yield potential through the cycle
- •Mid-cycle cash generation offers supportive yields
- •Where to hide if you are bearish
- •What to buy if you are bullish
- •Limited lives weighing down IRR
- •Yields should compensate for limited lives
- •Positive earnings momentum continues to support share prices
- •Commodity price revisions
- •Commodity section
- •Commodity section
- •Preference for base metals over steelmaking materials
- •Earnings revisions
- •Risks and catalysts
- •Peer comp charts
- •Commodity price and exchange rate forecasts
- •Important publications
- •African Rainbow Minerals
- •Alrosa
- •Anglo American
- •Assore
- •Exxaro
- •Glencore
- •Kumba Iron ore
- •NorNickel
- •Rio Tinto
- •Rusal
- •Vale
- •Gold Fields
- •Harmony
- •Polymetal
- •Anglo American Platinum
- •Lonmin
- •Northam
- •Royal Bafokeng Platinum
- •Sasol
- •Disclosures appendix
vk.com/id446425943
Norilsk Nickel – BUY
Renaissance Capital
1 April 2019
Metals & Mining
Figure 119: Norilsk Nickel, $mn (unless otherwise noted)
|
|
|
|
NorNickel |
GMKN.MM |
Target price, $: |
31.0 |
Market capitalisation, $mn: |
35,374 |
Share price, $: |
22.4 |
Enterprise value, $mn: |
42,675 |
Potential 12-month return: |
50.4% |
Dec-YE |
2017 |
2018 |
2019E |
2020E |
2021E |
Income statement |
|
|
|
|
|
Revenue |
9,146 |
11,670 |
13,277 |
14,634 |
14,602 |
EBITDA |
3,995 |
6,231 |
7,678 |
8,626 |
8,443 |
EBIT |
3,123 |
5,416 |
6,933 |
7,801 |
7,533 |
Net interest |
-458 |
-485 |
-363 |
-394 |
-457 |
Taxation |
-721 |
-843 |
-1,577 |
-1,778 |
-1,698 |
Minority interest in profit |
6 |
26 |
-67 |
-124 |
-156 |
Net profit for the year |
2,129 |
3,085 |
4,927 |
5,505 |
5,221 |
Underlying earnings |
2,129 |
3,085 |
4,927 |
5,505 |
5,221 |
Underlying EPS, $ |
1.35 |
1.95 |
3.11 |
3.48 |
3.30 |
Thomson Reuters consensus EPS, $ |
|
|
2.73 |
2.84 |
2.66 |
DPS declared, $ |
1.17 |
2.11 |
2.60 |
3.12 |
3.28 |
Thomson Reuters consensus DPS, $ |
|
####### |
2.31 |
2.67 |
2.73 |
EBIT by division |
|
|
|
|
|
|
|
|
|
|
|
Russia (GMK & KGMK) |
4,217 |
6,098 |
7,601 |
8,354 |
7,993 |
EBIT margin |
58% |
65% |
72% |
74% |
72% |
NN Harjavalta |
36 |
47 |
154 |
227 |
237 |
EBIT margin |
4% |
5% |
14% |
18% |
18% |
Other metallurgical |
-140 |
71 |
168 |
311 |
391 |
EBIT margin |
-99% |
62% |
37% |
46% |
47% |
Other non-metallurgical |
-6 |
22 |
6 |
7 |
7 |
EBIT margin |
-1% |
2% |
1% |
1% |
1% |
Other |
-757 |
-772 |
-996 |
-1,098 |
-1,095 |
Income statement ratios |
|
|
|
|
|
EBITDA margin |
44% |
53% |
58% |
59% |
58% |
EBIT margin |
34% |
46% |
52% |
53% |
52% |
EPS growth |
-17% |
45% |
60% |
12% |
-5% |
Dividend payout ratio |
87% |
108% |
83% |
90% |
99% |
Dividend as % of EBITDA |
46% |
54% |
54% |
57% |
61% |
Input assumptions |
|
|
|
|
|
Nickel, $/t |
10,404 |
13,130 |
12,762 |
14,805 |
15,728 |
Copper, $/t |
6,170 |
6,532 |
6,400 |
6,500 |
7,025 |
Palladium, $/oz |
871 |
1,030 |
1,558 |
1,700 |
1,576 |
Platinum, $/oz |
950 |
880 |
843 |
900 |
966 |
RUB/$ |
58 |
63 |
67 |
69 |
68 |
Unit costs per nickel eq tonne, $ |
8,399 |
7,873 |
7,971 |
8,454 |
8,779 |
Sustaining capex per nickel eq tonne, $ |
1,221 |
931 |
2,420 |
2,320 |
2,594 |
Production volumes* |
217 |
219 |
223 |
223 |
222 |
Nickel, kt |
|||||
Copper, kt |
401 |
474 |
481 |
494 |
470 |
Palladium, koz |
2,780 |
2,728 |
2,780 |
2,780 |
2,780 |
Platinum, koz |
670 |
653 |
668 |
668 |
668 |
Attributable Cu eq volumes, kt |
1,412 |
1,478 |
1,506 |
1,519 |
1,492 |
Volume growth |
2% |
5% |
2% |
1% |
-2% |
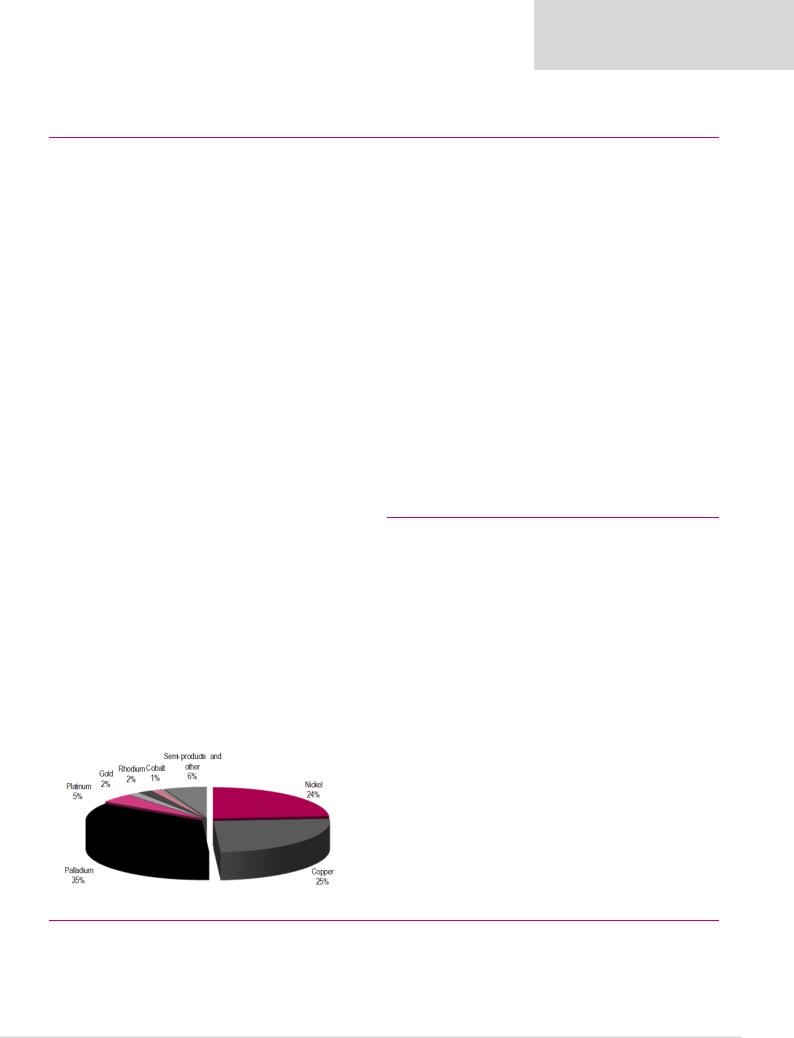
Contribution to 2019E revenue per commodity
Dec-YE |
|
|
|
2019E |
2020E |
2021E |
2017 |
2018 |
|
||||
Balance sheet |
|
|
|
|
|
|
Net operating assets |
13,581 |
11,062 |
|
12,914 |
14,588 |
16,189 |
Financial instruments |
267 |
222 |
|
222 |
222 |
222 |
Equity |
4,333 |
3,229 |
|
4,042 |
4,607 |
4,638 |
Minority interest |
331 |
250 |
|
317 |
441 |
598 |
Net debt |
8,201 |
7,051 |
|
7,973 |
8,908 |
10,270 |
Balance sheet ratios |
|
|
|
|
|
|
Gearing (net debt/(net debt+equity)) |
65.4% |
68.6% |
|
66.4% |
65.9% |
68.9% |
Net debt to EBITDA |
2.1x |
1.1x |
|
1.0x |
1.0x |
1.2x |
RoCE |
28.1% |
44.4% |
|
57.8% |
56.7% |
49.0% |
RoIC (after tax) |
21.5% |
35.2% |
|
44.5% |
43.6% |
37.7% |
RoE |
45.7% |
81.6% |
|
135.5% |
127.3% |
113.0% |
Cash flow statement |
|
|
|
|
|
|
Operating cash flow |
1,339 |
6,417 |
|
5,781 |
6,721 |
6,694 |
Capex |
-2,002 |
-1,553 |
|
-2,300 |
-2,400 |
-2,500 |
Other FCF |
431 |
-35 |
|
0 |
0 |
0 |
FCF |
-232 |
4,829 |
|
3,481 |
4,321 |
4,194 |
Equity shareholders' cash |
-667 |
4,486 |
|
3,191 |
4,005 |
3,828 |
Dividends and share buy backs |
-3,004 |
-3,336 |
|
-4,114 |
-4,940 |
-5,190 |
Surplus (deficit) cash |
-3,671 |
1,150 |
|
-922 |
-935 |
-1,362 |
Cash flow ratios |
|
|
|
|
|
|
Working capital days |
96 |
35 |
|
39 |
37 |
38 |
Cash Conversion |
-0.3x |
1.5x |
|
0.6x |
0.7x |
0.7x |
FCF yield |
-0.7% |
13.5% |
|
8.0% |
9.6% |
9.0% |
Equity shareholders' yield |
-2.6% |
15.7% |
|
9.0% |
11.3% |
10.8% |
Capex/EBITDA |
50.1% |
24.9% |
|
30.0% |
27.8% |
29.6% |
Valuation |
|
|
|
|
|
|
SoTP DCF valuation and calculation of target price |
|
$mn |
$/sh |
|||
Russia (GMK & KGMK) |
|
|
|
|
60,807 |
38.4 |
Finland |
|
|
|
|
2,262 |
1.4 |
Other metallurgical |
|
|
|
|
4,191 |
2.6 |
Other non-metallurgical |
|
|
|
|
-90 |
-0.1 |
Other |
|
|
|
|
-11,557 |
-7.3 |
Total enterprise value |
|
|
|
|
55,613 |
35.1 |
Net debt as at 31 December 2018 |
|
|
|
|
-7,051 |
-4.5 |
Cash used in share buy-backs |
|
|
|
|
- |
- |
Other investments |
|
|
|
|
222 |
0.1 |
Minority interest |
|
|
|
|
-250 |
-0.2 |
Equity value as at 27/3/2019 |
|
|
|
|
48,534 |
30.7 |
Rounded to |
|
|
|
|
|
31.0 |
Share price on 26/3/2019 |
|
|
|
|
|
22.4 |
Expected share price return |
|
|
|
|
|
38.3% |
Plus: expected dividend yield |
|
|
|
|
|
12.1% |
Total implied one-year return |
|
|
|
|
|
50.4% |
Share price range, $: |
|
|
|
|
|
|
12-month high on 19/3/2019 |
22.8 |
12-month low on 10/4/2018 |
14.6 |
|||
Price move since high |
-1.8% Price move since low |
|
53.9% |
|||
Calculation of discount rate |
|
|
|
|
|
|
WACC |
9.4% |
Cost of debt |
|
|
5.0% |
|
Risk-free rate |
4.0% |
Tax rate |
|
|
24% |
|
Equity risk premium |
6.0% After-tax cost of debt |
|
3.8% |
|||
Beta |
1.30 |
Debt weighting |
|
30% |
||
Cost of equity |
11.8% |
Terminal growth rate |
|
2.5% |
||
Valuation ratios |
|
|
|
|
|
|
Dec-YE |
2017 |
2018 |
|
2019E |
2020E |
2021E |
P/E multiple |
12.0x |
9.3x |
|
7.2x |
6.4x |
6.8x |
Dividend yield |
7.2% |
11.7% |
|
11.6% |
13.9% |
14.6% |
EV/EBITDA |
8.6x |
5.8x |
|
5.7x |
5.2x |
5.5x |
P/B |
5.9x |
8.8x |
|
8.8x |
7.7x |
7.6x |
NAV per share, $ |
2.7 |
2.0 |
|
2.6 |
2.9 |
2.9 |
* From Russian own feed
Source: Bloomberg, Thomson Reuters, Company data, Renaissance Capital estimates
73