

vk.com/id446425943
Comfortable balance sheets and supportive dividend potential
Net debt reduced to comfortable levels
Renaissance Capital
1 April 2019
Metals & Mining
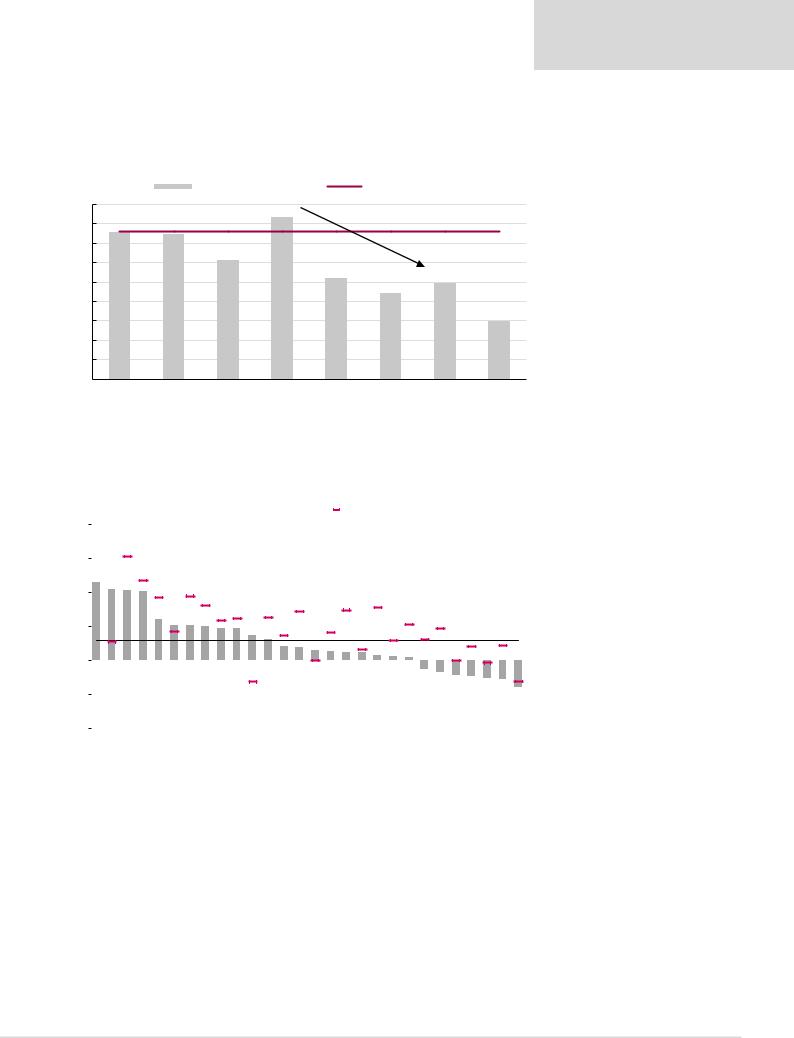
Mining companies have significantly deleveraged their balance sheets since 2015, and we believe comfortable balance sheets position them better for a cyclical downturn.
Figure 17: Mining sector net debt/EBITDA over time (2012-2019E)
|
|
|
Average net debt to EBITDA |
|
LT average (2003-2018) |
|
||
1.8x |
|
|
|
1.7x |
|
|
|
|
1.6x |
1.5x |
1.5x |
|
|
|
LT average (2003-2018), 1.5x |
||
1.4x |
|
|
1.2x |
|
|
|
|
|
|
|
|
|
|
|
|
|
|
1.2x |
|
|
|
|
1.0x |
|
1.0x |
|
|
|
|
|
|
|
|
||
|
|
|
|
|
|
0.9x |
|
|
1.0x |
|
|
|
|
|
|
|
|
0.8x |
|
|
|
|
|
|
|
0.6x |
|
|
|
|
|
|
|
|
|
0.6x |
|
|
|
|
|
|
|
|
0.4x |
|
|
|
|
|
|
|
|
0.2x |
|
|
|
|
|
|
|
|
0.0x |
|
|
|
|
|
|
|
|
|
2012 |
2013 |
2014 |
2015 |
2016 |
2017 |
2018 |
2019E |
Source: Company data, Renaissance Capital
Net debt/EBITDA now at comfortable levels
CY19E net debt/EBITDA ranked
Figure 18: Companies ranked by CY19E net debt/EBITDA compared with their historical averages |
|
|
|
|
||||||||||||||||||||||||||||||
4x |
|
|
|
|
|
|
|
|
CY19E Net debt/EBITDA |
|
|
LT average |
|
|
|
|
|
|
|
|
|
|
|
|||||||||||
|
|
|
|
|
|
|
|
|
|
|
|
|
|
|
|
|
|
|
|
|
||||||||||||||
|
|
|
|
|
|
|
|
|
|
|
|
|
|
|
|
|
|
|
|
|
|
|
|
|
|
|
|
|
|
|
|
|
||
|
|
|
|
|
|
|
|
|
|
|
|
|
|
|
|
|
|
|
|
|
|
|
|
|
|
|
|
|
|
|
|
|
||
3x |
|
|
|
|
|
|
|
|
|
|
|
|
|
|
|
|
|
|
|
|
|
|
|
|
|
|
|
|
|
|
|
|
|
|
2.3x |
2.1x |
2.1x |
2.0x |
|
|
|
|
|
|
|
|
|
|
|
|
|
|
|
|
|
|
|
|
|
|
|
|
|
|
|
|
|
||
|
|
|
|
|
|
|
|
|
|
|
|
|
|
|
|
|
|
|
|
|
|
|
|
|
|
|
|
|
|
|||||
2x |
|
|
|
|
|
|
|
|
|
|
|
|
|
|
|
|
|
|
|
|
|
|
|
|
|
|
|
|
|
|
|
|
|
|
|
|
|
1.2x |
1.0x |
1.0x |
1.0x |
0.9x |
0.9x |
0.7x |
0.6x |
0.4x |
0.4x |
|
|
|
|
|
|
|
|
|
|
|
|
|
|
|
|
|
|
|
|||
1x |
|
|
|
0.3x |
0.3x |
0.2x |
0.2x |
0.2x |
0.1x |
0.1x |
|
|
|
|
|
|
|
|
|
|||||||||||||||
|
|
|
|
|
|
|
|
|
|
|
|
|
|
|
|
|
|
|
|
|
|
|
|
Sector average, 0.6x |
|
|
||||||||
|
|
|
|
|
|
|
|
|
|
|
|
|
|
|
|
|
|
|
|
|
|
|
|
|
|
|
||||||||
0x |
|
|
|
|
|
|
|
|
|
|
|
|
|
|
|
|
|
|
|
|
|
|
|
|
|
|
|
|
|
|
|
|
|
|
|
|
|
|
|
|
|
|
|
|
|
|
|
|
|
|
|
|
|
|
|
|
|
|
0.3x- |
0.4x- |
0.4x- |
0.5x- |
0.5x- |
0.6x- |
|
||||
-1x |
|
|
|
|
|
|
|
|
|
|
|
|
|
|
|
|
|
|
|
|
|
|
|
|
0.8x+- |
|||||||||
|
|
|
|
|
|
|
|
|
|
|
|
|
|
|
|
|
|
|
|
|
|
|
|
|
|
|
|
|
|
|
|
|
||
-2x |
|
|
|
|
|
|
|
|
|
|
|
|
|
|
|
|
|
|
|
|
|
|
|
|
|
|
|
|
|
|
|
|
|
|
Rusal* |
Sasol |
Glencore |
Northam Polymetal |
Norilsk |
Russian* |
Sibanye |
Gold Fields |
Polyus |
RBPlats |
AngloGold |
Others* |
Alrosa |
Harmony |
BHP |
Fortescue |
Exxaro* |
Vale |
Rio Tinto |
Anglo Impala |
Amplats |
South32 |
ARM* |
Kumba |
Merafe |
Assore* |
|||||||||
|
||||||||||||||||||||||||||||||||||
Noted: Net debt/EDITDA ratio has been limited to 5x. We do not subtract Glencore’s readily marketable inventory from net debt.
*Net debt/EBITDA plus equity-accounted income.
Source: Company data, Renaissance Capital estimates
Sector average net debt/EBITDA of 0.6x
12
vk.com/id446425943
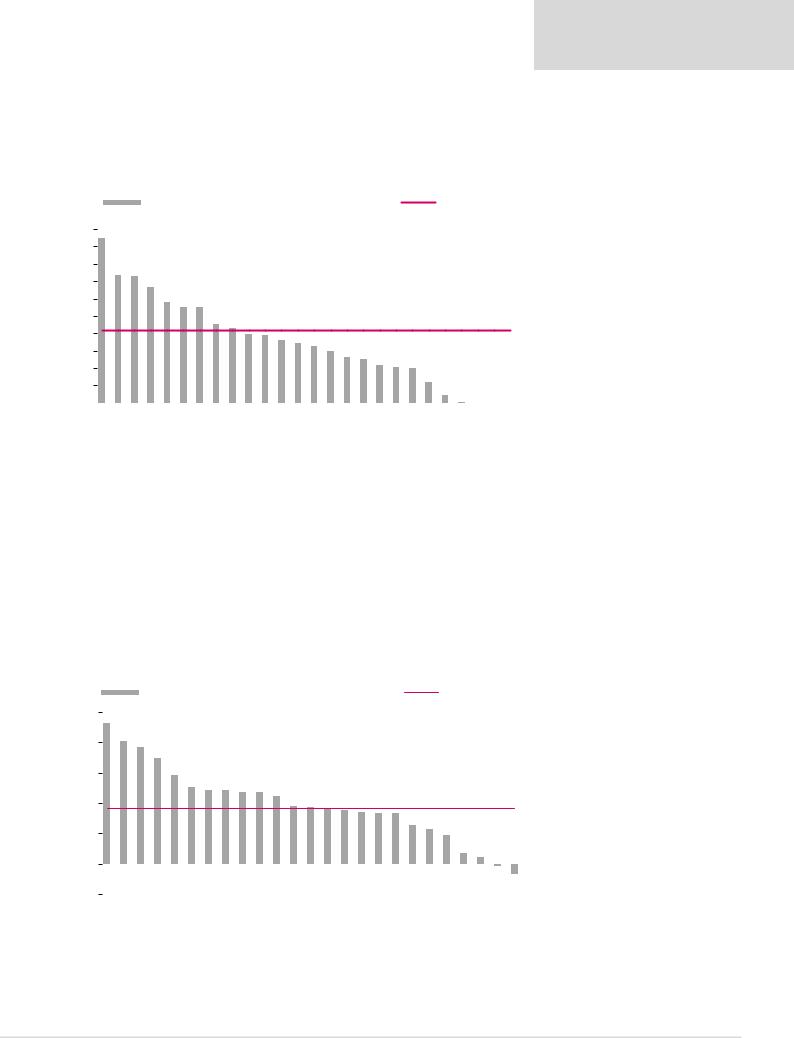
Attractive dividend yields over the next three years…
We forecast average dividend yields of 8.4% over the next three years, with potential upside risk to our forecasts if the current strategy of capital discipline and returning cash to shareholders prevails over the short-to-medium term.
Figure 19: Average dividend yield over next three years (2019-2021E)
|
19.0% |
|
Average dividend yield over next 3 years (2019E-2021E) |
|
|
|
|
Sector Average |
|
|||||||||||||||||
20% |
|
|
|
|
|
|
|
|
|
|
|
|
|
|
|
|
|
|
|
|
|
|
|
|
||
|
|
|
|
|
|
|
|
|
|
|
|
|
|
|
|
|
|
|
|
|
|
|
|
|
||
18% |
|
|
|
|
|
|
|
|
|
|
|
|
|
|
|
|
|
|
|
|
|
|
|
|
|
|
14.8% |
14.6% |
13.4% |
11.6% |
11.1% |
11.0% |
9.0% |
8.7% |
7.9% |
7.9% |
7.2% |
6.9% |
6.5% |
5.9% |
5.3% |
5.1% |
4.4% |
4.1% |
4.0% |
2.4% |
0.9% |
0.1% |
0.0% |
0.0% |
0.0% |
||
16% |
||||||||||||||||||||||||||
|
|
|
|
|
|
|
|
|
|
|
|
|
|
|
|
|
|
|
|
|
|
|
|
|
||
14% |
|
|
|
|
|
|
|
|
|
|
|
|
|
|
|
|
|
|
|
|
|
|
|
|
|
|
|
|
|
|
|
|
|
|
|
|
|
|
|
|
|
|
|
|
|
|
|
|
|
|
|
||
12% |
|
|
|
|
|
|
|
|
|
|
|
|
|
|
|
|
|
|
|
|
|
|
|
|
|
|
|
|
|
|
|
|
|
|
|
|
|
|
|
|
|
|
|
|
|
|
|
|
|
|
|
||
10% |
|
|
|
|
|
|
|
|
|
|
|
|
|
|
|
|
|
|
|
|
||||||
|
|
|
|
|
|
|
|
|
|
|
|
|
|
|
|
|
Sector Average, 8.4% |
|
|
|||||||
8% |
|
|
|
|
|
|
|
|
|
|
|
|
|
|
|
|
|
|
|
|
|
|
|
|
|
|
|
|
|
|
|
|
|
|
|
|
|
|
|
|
|
|
|
|
|
|
|
|
|
|
|
||
6% |
|
|
|
|
|
|
|
|
|
|
|
|
|
|
|
|
|
|
|
|
|
|
|
|
|
|
|
|
|
|
|
|
|
|
|
|
|
|
|
|
|
|
|
|
|
|
|
|
|
|
|
||
4% |
|
|
|
|
|
|
|
|
|
|
|
|
|
|
|
|
|
|
|
|
|
|
|
|
|
|
|
|
|
|
|
|
|
|
|
|
|
|
|
|
|
|
|
|
|
|
|
|
|
|
|
||
2% |
|
|
|
|
|
|
|
|
|
|
|
|
|
|
|
|
|
|
|
|
|
|
|
|
|
|
|
|
|
|
|
|
|
|
|
|
|
|
|
|
|
|
|
|
|
|
|
|
|
|
|
||
0% |
|
|
|
|
|
|
|
|
|
|
|
|
|
|
|
|
|
|
|
|
|
|
|
|
|
|
Merafe Fortescue |
Alrosa |
Norilsk |
Kumba |
Assore |
Exxaro |
ARM |
BHP |
Rio Tinto |
South32 |
Glencore |
Anglo |
Polyus |
Polymetal |
Sibanye |
Vale |
Impala |
Amplats |
Sasol |
Gold Fields |
AngloGold |
Harmony |
Lonmin |
Northam |
RBPlats |
||
|
||||||||||||||||||||||||||
Note: Priced as at market close on 26 March 2019.
Source: Company data, Renaissance Capital estimates
Renaissance Capital
1 April 2019
Metals & Mining
We forecast a potential average sector dividend yield of c. 8.4%
…with significant further excess cash available after dividends
We define excess cash as the amount in excess of net debt/EBITDA of 1.5x.
We calculate average cumulative excess cash available for dividends at 37% of market cap over the next three years, despite attractive dividends paid over the period. While we do not have any conviction about the sector’s capital discipline over the medium term, we believe the sector could re-rate over the short term as the market gains visibility on the sector’s yield potential.
Figure 20: Potential average excess cash* as a percentage of market cap over the next three years
|
93% |
Average excess cash over next 3 years (2019E-2021E), % |
|
|
|
|
Sector average |
|
||||||||||||||
100% |
|
|
|
|
|
|
|
|
|
|
|
|
|
|
|
|
|
|
|
|
|
|
|
|
|
|
|
|
|
|
|
|
|
|
|
|
|
|
|
|
|
|
|
|
|
80% |
|
|
|
|
|
|
|
|
|
|
|
|
|
|
|
|
|
|
|
|
|
|
81% |
77% |
70% |
59% |
50% |
48% |
48% |
47% |
47% |
|
|
|
|
|
|
|
|
|
|
|
|
|
|
60% |
45% |
38% |
38% |
36% |
35% |
34% |
33% |
33% |
25% |
23% |
19% |
|
|
|||||||||
|
|
|
|
|
|
|
|
|
|
|
|
|
|
|
|
|
|
|
Sector average, 37% |
|||
|
|
|
|
|
|
|
|
|
|
|
|
|
|
|
|
|
|
|
|
|||
40% |
|
|
|
|
|
|
|
|
|
|
|
|
|
|
|
|
|
|
|
|
|
|
|
|
|
|
|
|
|
|
|
|
|
|
|
|
|
|
|
|
|
|
|
|
|
20% |
|
|
|
|
|
|
|
|
|
|
|
|
|
|
|
|
|
|
|
|
|
|
|
|
|
|
|
|
|
|
|
|
|
|
|
|
|
|
|
|
|
7% |
4% |
|
|
|
|
|
|
|
|
|
|
|
|
|
|
|
|
|
|
|
|
|
|
|
||
0% |
|
|
|
|
|
|
|
|
|
|
|
|
|
|
|
|
|
|
|
|
|
|
|
|
|
|
|
|
|
|
|
|
|
|
|
|
|
|
|
|
|
|
-1% |
7% |
|
-20% |
|
|
|
|
|
|
|
|
|
|
|
|
|
|
|
|
|
|
|
|
||
|
|
|
|
|
|
|
|
|
|
|
|
|
|
|
|
|
|
|
|
|
- |
|
|
Impala Harmony |
ARM* |
Merafe |
Sibanye |
Assore* |
Fortescue |
Kumba |
RBPlats |
Vale |
Anglo |
South32 |
AngloGold |
Amplats |
Exxaro* |
Gold Fields |
Norilsk |
Rio Tinto |
BHP |
Alrosa |
Polyus Polymetal |
Northam Sasol |
Glencore |
Note: Priced as at market close on 26 March 2019.
*Average excess cash over a three-year period (CY19-21E) at target debt gearing levels (net debt/EBITDA of 1.5x).
Source: Company data, Thomson Reuters, Renaissance Capital estimates
We forecast potential cumulative excess cash after dividends of 37% of the sector’s market cap over the next three years
13