

- •Contents
- •Revisions to our forecasts, TPs and ratings
- •Investment stance
- •Capital cycle favours rising returns
- •Comfortable balance sheets and supportive dividend potential
- •Value relative to other stocks
- •Yield potential through the cycle
- •Mid-cycle cash generation offers supportive yields
- •Where to hide if you are bearish
- •What to buy if you are bullish
- •Limited lives weighing down IRR
- •Yields should compensate for limited lives
- •Positive earnings momentum continues to support share prices
- •Commodity price revisions
- •Commodity section
- •Commodity section
- •Preference for base metals over steelmaking materials
- •Earnings revisions
- •Risks and catalysts
- •Peer comp charts
- •Commodity price and exchange rate forecasts
- •Important publications
- •African Rainbow Minerals
- •Alrosa
- •Anglo American
- •Assore
- •Exxaro
- •Glencore
- •Kumba Iron ore
- •NorNickel
- •Rio Tinto
- •Rusal
- •Vale
- •Gold Fields
- •Harmony
- •Polymetal
- •Anglo American Platinum
- •Lonmin
- •Northam
- •Royal Bafokeng Platinum
- •Sasol
- •Disclosures appendix

vk.com/id446425943
Polymetal – HOLD
Renaissance Capital
1 April 2019
Metals & Mining
Figure 127: Polymetal, $mn (unless otherwise noted) |
|
|
|
|
|
|
|
|
|
|
|
|||||
Polymetal |
|
|
POLYP.L |
|
|
|
|
|
Target price, GBP: |
|
|
8.40 |
||||
Market capitalisation, $mn: |
|
5,369 |
|
|
|
|
|
|
Share price, GBP: |
|
|
8.66 |
||||
Enterprise value, $mn: |
|
6,907 |
|
|
|
|
|
|
Potential 12-month return: |
|
3.0% |
|||||
|
|
|
|
|
|
|
|
|
|
|
|
|
|
|
|
|
Dec-YE |
|
|
2017 |
2018 |
|
2019E |
2020E |
2021E |
Dec-YE |
2017 |
2018 |
|
2019E |
2020E |
2021E |
|
Income statement |
|
|
|
|
|
|
|
|
Balance sheet |
|
|
|
|
|
|
|
Revenue |
|
1,815 |
1,882 |
|
2,104 |
2,136 |
2,136 |
|
Net operating assets |
2,828 |
3,003 |
|
3,103 |
3,316 |
3,561 |
|
EBITDA |
|
|
746 |
780 |
|
1,044 |
1,042 |
1,011 |
|
Investments, net of rehab provision |
-101 |
-86 |
|
-86 |
-86 |
-86 |
EBIT |
|
|
532 |
594 |
|
863 |
863 |
825 |
|
Equity |
1,307 |
1,379 |
|
1,742 |
2,035 |
2,348 |
Net interest |
|
-67 |
-96 |
|
-64 |
-56 |
-53 |
|
Minority interest |
0 |
18 |
|
18 |
18 |
18 |
|
Taxation |
|
|
-89 |
-71 |
|
-160 |
-161 |
-154 |
|
Net debt |
1,420 |
1,520 |
|
1,257 |
1,177 |
1,109 |
Minority interest in profit |
0 |
0 |
|
0 |
0 |
0 |
|
|
|
|
|
|
|
|
||
Net profit for the year |
354 |
355 |
|
640 |
646 |
618 |
|
Balance sheet ratios |
|
|
|
|
|
|
||
Underlying earnings |
376 |
447 |
|
640 |
646 |
618 |
|
Gearing (net debt/(net debt+equity)) |
52.1% |
52.4% |
|
41.9% |
36.6% |
32.1% |
||
Underlying EPS, USc |
88 |
100 |
|
136 |
137 |
132 |
|
Net debt to EBITDA |
1.9x |
1.9x |
|
1.2x |
1.1x |
1.1x |
||
|
|
RoCE |
20.1% |
20.0% |
|
27.5% |
26.2% |
23.4% |
||||||||
Consensus EPS, USc |
|
|
|
114 |
122 |
127 |
|
RoIC (after tax) |
16.0% |
19.0% |
|
22.2% |
21.2% |
18.9% |
||
DPS declared, USc |
|
44 |
48 |
|
68 |
69 |
67 |
|
RoE |
32.9% |
33.3% |
|
41.0% |
34.2% |
28.2% |
|
Consensus DPS, USc |
|
|
|
56 |
62 |
64 |
|
Cash flow statement |
|
|
|
|
|
|
||
|
|
|
|
|
|
|
|
|
|
|
|
|
|
|
|
|
Adjusted EBIT |
|
|
|
|
|
|
|
|
Operating cash flow |
575 |
721 |
|
907 |
880 |
832 |
|
Voro |
|
|
97 |
88 |
|
89 |
87 |
82 |
|
Capex (net of disposals) |
-432 |
-377 |
|
-377 |
-403 |
-417 |
EBIT margin |
|
62% |
66% |
|
67% |
67% |
64% |
|
Other cash flows |
-30 |
-139 |
|
60 |
0 |
0 |
|
Okhotsk operations |
|
159 |
175 |
|
86 |
84 |
79 |
|
Free cash flow |
114 |
205 |
|
590 |
477 |
415 |
|
EBIT margin |
|
57% |
62% |
|
65% |
64% |
61% |
|
Equity shareholders' cash |
48 |
113 |
|
540 |
432 |
373 |
|
Dukat |
|
|
180 |
137 |
|
158 |
176 |
181 |
|
Dividends and share buy-backs |
-138 |
-213 |
|
-277 |
-352 |
-305 |
EBIT margin |
|
44% |
36% |
|
41% |
43% |
42% |
|
Surplus (deficit) cash |
-90 |
-100 |
|
263 |
80 |
68 |
|
Omolon |
|
|
121 |
106 |
|
134 |
134 |
126 |
|
Cash flow ratios |
|
|
|
|
|
|
EBIT margin |
|
45% |
46% |
|
52% |
51% |
48% |
|
109 |
111 |
|
94 |
92 |
96 |
||
Varvara |
|
|
68 |
77 |
|
106 |
102 |
97 |
|
Working capital turnover, days |
|
|||||
EBIT margin |
|
44% |
43% |
|
51% |
49% |
47% |
|
FCF yield |
1.7% |
3.4% |
|
8.9% |
7.3% |
6.4% |
|
Amursk-Albazino |
|
157 |
184 |
|
212 |
205 |
171 |
|
Equity shareholders' yield |
0.9% |
2.5% |
|
10.1% |
8.1% |
6.9% |
|
EBIT margin |
|
45% |
45% |
|
52% |
51% |
47% |
|
Capex/EBITDA |
57.9% |
48.4% |
|
36.1% |
38.7% |
41.2% |
|
Other |
|
|
-250 |
-173 |
|
78 |
75 |
89 |
|
Cash conversion |
0.1x |
0.3x |
|
0.8x |
0.7x |
0.6x |
Adjusted EBIT |
|
532 |
594 |
|
863 |
863 |
825 |
|
Valuation |
|
|
|
|
|
|
|
|
|
|
|
|
|
|
|
|
|
|
|
|
|
|
|
|
Income statement ratios |
|
|
|
|
|
|
|
SoTP DCF fair value and calculation of target price |
|
|
|
$mn |
GBP/sh |
|||
EBITDA margin |
|
62% |
66% |
|
67% |
67% |
64% |
|
Voro |
|
|
|
|
291 |
0.47 |
|
EBIT margin |
|
29% |
32% |
|
41% |
40% |
39% |
|
Okhotsk operations |
|
|
|
|
356 |
0.57 |
|
Underlying EPS Growth |
-2% |
14% |
|
36% |
1% |
-4% |
|
Dukat |
|
|
|
|
790 |
1.28 |
||
Dividend payout ratio |
50% |
48% |
|
50% |
50% |
51% |
|
Omolon |
|
|
|
|
534 |
0.86 |
||
Input assumptions |
|
|
|
|
|
|
|
|
Varvara |
|
|
|
|
806 |
1.30 |
|
|
|
|
|
|
|
|
|
Amursk-Albazino |
|
|
|
|
823 |
1.33 |
||
Gold, $/oz |
|
1,258 |
1,269 |
|
1,350 |
1,337 |
1,311 |
|
Armenia |
|
|
|
|
-3 |
-0.01 |
|
Silver, $/oz |
|
17.1 |
15.7 |
|
16.7 |
17.8 |
18.8 |
|
Mayskoye |
|
|
|
|
326 |
0.53 |
|
$/RUB |
|
|
58.3 |
62.8 |
|
66.8 |
68.5 |
67.5 |
|
Kyzyl |
|
|
|
|
2,291 |
3.70 |
$/KZT |
|
|
326 |
345 |
|
372 |
376 |
386 |
|
Nezhda |
|
|
|
|
1,124 |
1.81 |
Gold breakeven price, $/oz |
860 |
906 |
|
808 |
794 |
795 |
|
Corporate and other |
|
|
|
|
-668 |
-1.08 |
||
Gold equivalent production volumes, koz |
|
|
|
|
|
|
|
Operating value |
|
|
|
|
6,670 |
10.76 |
||
|
|
|
|
|
|
|
Financial instruments and rehab provision as at 31 December 2018 |
|
-86 |
-0.14 |
||||||
Voro lumes |
|
120 |
108 |
|
98 |
98 |
98 |
|
Enterprise value |
|
|
|
|
6,584 |
10.62 |
|
Okhotsk operations |
lumes |
186 |
237 |
|
98 |
98 |
98 |
|
Net debt as at 31 December 2018 |
|
|
|
|
-1,520 |
-2.45 |
|
Dukat |
lumes |
|
322 |
307 |
|
304 |
304 |
304 |
|
Minority interest |
|
|
|
|
-18 |
-0.03 |
Omolon |
lumes |
|
202 |
194 |
|
195 |
195 |
195 |
|
Prognoz valued at 70% of acquisition price |
|
|
|
|
151 |
0.24 |
Varvara |
lumes |
|
130 |
142 |
|
157 |
157 |
157 |
|
Cash raised in rights issue during 2019E |
|
|
|
|
0 |
0.00 |
Amursk-Albazino |
lumes |
268 |
308 |
|
303 |
303 |
278 |
|
Equity value |
|
|
|
|
5,197 |
8.38 |
|
Armenia lumes |
|
50 |
51 |
|
8 |
0 |
0 |
|
|
|
|
|
|
|
|
|
|
Rounded to |
|
|
|
|
|
8.40 |
|||||||||
Mayskoye lumes |
|
124 |
117 |
|
114 |
114 |
114 |
|
Share price on 26/3/2019 |
|
|
|
|
|
8.66 |
|
Kyzyl lumes |
|
0 |
96 |
|
300 |
330 |
330 |
|
Expected share price return |
|
|
|
|
|
-3.0% |
|
Total volumes |
|
1,401 |
1,560 |
|
1,576 |
1,598 |
1,604 |
|
Plus: expected dividend yield |
|
|
|
|
|
6.0% |
|
Volume growth |
|
11% |
11% |
|
1% |
1% |
0% |
|
Total implied one-year return |
|
|
|
|
|
3.0% |
|
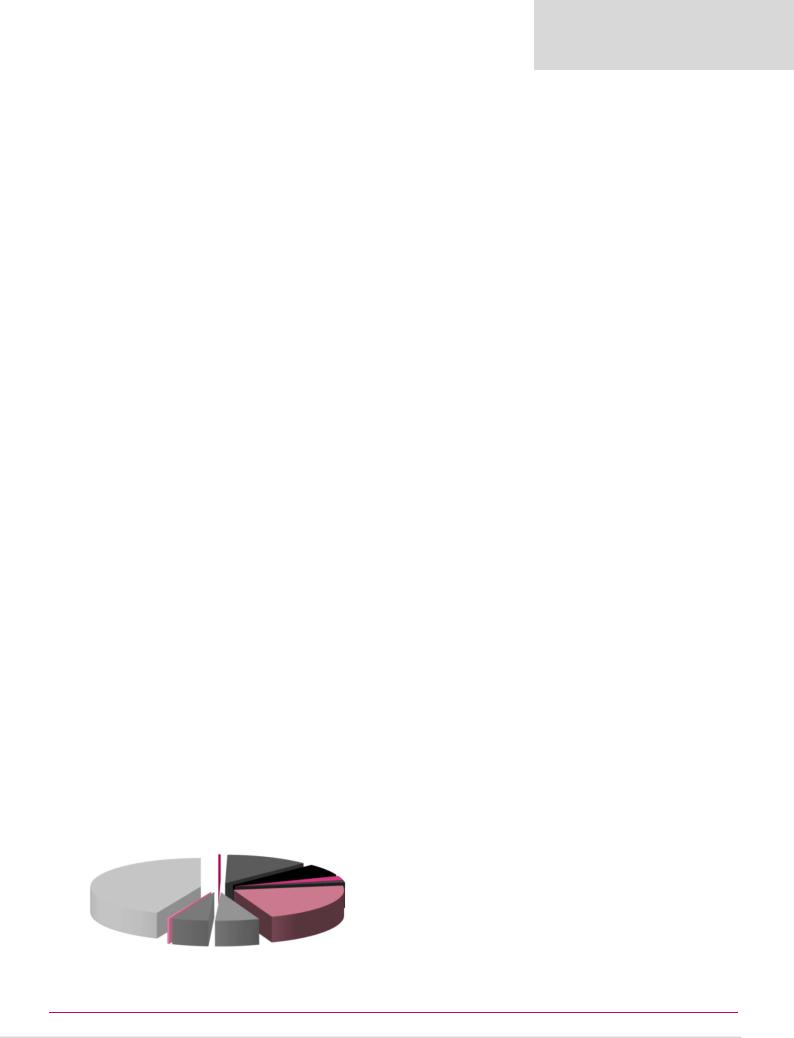
Contribution to FY19E adjusted EBITDA |
|
|
|
|
|
|
|
Share price range, GBP: |
|
|
|
|
|
|
||
|
|
|
|
|
|
|
|
|
|
12-month high on 25-2-2019 |
9.01 12-month low on 10-4-2018 |
5.78 |
||||
|
|
|
|
|
|
|
|
|
|
Price move since high |
-3.9% Price move since low |
|
49.8% |
|||
|
|
|
|
Voro |
|
|
|
|
Calculation of WACC |
|
|
|
|
|
|
|
|
|
Kyzyl |
|
8% |
|
|
Okhotsk |
|
|
|
|
|
|
|
|
|
|
|
|
|
|
|
|
WACC |
7.9% |
Cost of debt |
|
|
5.0% |
||||
|
|
24% |
|
|
|
|
|
|
|
|
||||||
|
|
|
|
|
|
|
8% |
|
|
Risk-free rate |
4.0% |
Tax rate |
|
|
20% |
|
|
|
|
|
|
|
|
|
|
|
|
|
|||||
|
|
|
|
|
|
|
|
|
|
Equity risk premium |
5.5% After-tax cost of debt |
|
1.2% |
|||
|
|
|
|
|
|
|
|
Dukat |
Beta |
1.00 |
Debt weighting |
|
30% |
|||
Mayskoye |
|
|
|
|
|
|
14% |
|
Cost of equity |
9.5% |
Terminal growth rate |
|
2.0% |
|||
6% |
|
|
|
|
|
|
|
|
|
|
|
|
|
|
|
|
Armenia |
|
|
|
|
|
|
|
|
|
Valuation ratios |
|
|
|
|
|
|
0% |
|
|
|
|
|
|
|
|
|
|
|
|
|
|
|
|
|
|
|
|
|
|
|
Omolon |
Dec-YE, $mn |
2017 |
2018 |
|
2019E |
2020E |
2021E |
||
|
Amursk-Albazino |
|
|
|
|
P/E multiple |
13.6x |
9.7x |
|
8.4x |
8.3x |
8.7x |
||||
|
|
Varvara |
|
12% |
|
|
|
|||||||||
|
19% |
|
|
|
|
|
|
Dividend yield |
3.7% |
5.0% |
|
5.9% |
6.0% |
5.9% |
||
|
|
|
|
9% |
|
|
|
|
|
EV/EBITDA |
8.8x |
7.8x |
|
6.4x |
6.3x |
6.4x |
|
|
|
|
|
|
|
|
|
|
P/B |
3.9x |
3.3x |
|
3.1x |
2.6x |
2.3x |
|
|
|
|
|
|
|
|
|
|
NAV per share, $ |
3.0 |
2.9 |
|
3.7 |
4.3 |
5.0 |
Source: Bloomberg, Thomson Reuters, Renaissance Capital estimates
81

vk.com/id446425943
PJSC Polyus – BUY
Renaissance Capital
1 April 2019
Metals & Mining
Figure 128: Polyus Gold, $mn (unless otherwise noted)
|
|
|
|
PJSC Polyus (MOEX) |
PLZL.MM |
Target price, RUB: |
6,600 |
Market capitalisation, $mn: |
11,268 |
Share price, RUB: |
5,434 |
Enterprise value, $mn: |
14,441 |
Potential 12-month return: |
27.8% |
Dec-YE |
|
|
2017 |
2018 |
2019E |
2020E |
2021E |
Income statement |
|
|
|
|
|
||
Revenue |
|
|
2,721 |
2,915 |
3,748 |
3,703 |
3,763 |
Adjusted EBITDA |
1,702 |
1,867 |
2,572 |
2,524 |
2,496 |
||
Adjusted EBIT |
1,485 |
1,489 |
2,230 |
2,175 |
2,120 |
||
Net interest |
|
76 |
-973 |
-191 |
-156 |
-116 |
|
Taxation |
|
|
-290 |
-77 |
-408 |
-404 |
-401 |
Minority interest in profit |
-1 |
-18 |
0 |
0 |
0 |
||
Net profit for the year |
1,240 |
456 |
1,629 |
1,616 |
1,603 |
||
Adjusted earnings |
1,015 |
1,326 |
1,631 |
1,616 |
1,603 |
||
Adjusted EPS, USc |
789 |
1,003 |
1,233 |
1,221 |
1,211 |
||
Consensus EPS, USc |
|
|
1,095 |
1,054 |
1,194 |
||
DPS declared, USc |
405 |
428 |
499 |
593 |
565 |
||
Consensus DPS, USc |
|
|
504 |
549 |
556 |
||
Adjusted EBITDA |
953 |
1,135 |
1,338 |
1,355 |
1,392 |
||
Olimpiada |
|
|
|||||
EBITDA margin |
66% |
72% |
77% |
76% |
75% |
||
Blagodatnoye |
|
414 |
356 |
428 |
446 |
435 |
|
EBITDA margin |
71% |
67% |
68% |
68% |
65% |
||
Verninskoye |
|
149 |
180 |
184 |
179 |
168 |
|
EBITDA margin |
57% |
63% |
65% |
64% |
61% |
||
Alluvials |
|
|
54 |
52 |
63 |
55 |
47 |
EBITDA margin |
28% |
28% |
35% |
33% |
29% |
||
Kuranakh |
|
|
109 |
133 |
140 |
136 |
126 |
EBITDA margin |
50% |
52% |
56% |
55% |
52% |
||
Natalka |
|
|
0 |
11 |
419 |
352 |
328 |
EBITDA margin |
- |
16% |
62% |
61% |
58% |
||
Other |
|
|
23 |
0 |
0 |
0 |
-0 |
Adjusted EBITDA |
1,702 |
1,867 |
2,572 |
2,524 |
2,496 |
||
Income statement ratios |
|
|
|
|
\ |
||
|
|
|
|
|
|||
EBITDA margin |
63% |
64% |
69% |
68% |
66% |
||
EBIT margin |
|
63% |
64% |
69% |
68% |
66% |
|
Adjusted EPS Growth |
17% |
27% |
23% |
-1% |
-1% |
||
Dividend payout ratio |
51% |
43% |
40% |
49% |
47% |
||
Input assumptions |
|
|
|
|
|
||
Gold, $/oz |
|
|
1,258 |
1,269 |
1,350 |
1,337 |
1,311 |
$/RUB |
|
|
58.3 |
62.8 |
66.8 |
68.5 |
67.5 |
Gold breakeven price, $/oz |
843 |
915 |
899 |
982 |
1,086 |
||
Gold production volumes, koz |
|
|
|
|
|
||
Olimpiada lumes |
1,177 |
1,322 |
1,313 |
1,354 |
1,413 |
||
Blagodatnoye |
lumes |
457 |
409 |
462 |
493 |
509 |
|
Verninskoye lumes |
206 |
232 |
210 |
210 |
210 |
||
Alluvials |
lumes |
146 |
135 |
131 |
127 |
124 |
|
Kuranakh |
lumes |
171 |
199 |
185 |
185 |
185 |
|
Natalka |
lumes |
3 |
133 |
498 |
429 |
429 |
|
Sukhoi Log |
lumes |
0 |
0 |
0 |
0 |
0 |
|
Total volumes |
2,160 |
2,429 |
2,800 |
2,799 |
2,870 |
||
Volume growth |
10% |
12% |
15% |
0% |
3% |
||
Contribution to FY19E adjusted EBITDA
Dec-YE |
2017 |
2018 |
2019E |
2020E |
2021E |
Balance sheet |
|
|
|
|
|
Net operating assets |
4,406 |
4,422 |
4,678 |
4,865 |
5,008 |
Investments, net of rehab provision |
-673 |
-886 |
-886 |
-886 |
-886 |
Equity |
564 |
363 |
1,332 |
2,163 |
3,018 |
Minority interest |
92 |
87 |
87 |
87 |
87 |
Net debt |
3,077 |
3,086 |
2,373 |
1,729 |
1,017 |
Balance sheet ratios |
|
|
|
|
|
Gearing (net debt/(net debt+equity)) |
84.5% |
89.5% |
64.1% |
44.4% |
25.2% |
Net debt to EBITDA |
1.8x |
1.7x |
0.9x |
0.7x |
0.4x |
RoCE |
37.5% |
32.8% |
48.0% |
44.7% |
42.1% |
RoIC (after tax) |
31.0% |
23.5% |
38.6% |
35.8% |
33.7% |
RoE |
3625.0% |
286.1% |
192.5% |
92.5% |
61.9% |
Cash flow statement |
|
|
|
|
|
Operating cash flow |
1,483 |
1,274 |
2,261 |
2,071 |
2,047 |
Capex (net of disposals) |
-804 |
-736 |
-734 |
-517 |
-495 |
Other cash flows |
-241 |
597 |
-2 |
0 |
0 |
Free cash flow |
438 |
1,135 |
1,525 |
1,554 |
1,553 |
Equity shareholders' cash |
738 |
566 |
1,373 |
1,429 |
1,460 |
Dividends and share buy-backs |
-574 |
-575 |
-660 |
-785 |
-748 |
Surplus (deficit) cash |
164 |
-9 |
713 |
644 |
712 |
Cash flow ratios |
20 |
50 |
27 |
29 |
31 |
Working capital turnover, days |
|||||
FCF yield |
3.3% |
9.2% |
11.2% |
12.0% |
12.7% |
Equity shareholders' yield |
7.3% |
6.2% |
12.3% |
12.8% |
13.1% |
Capex/EBITDA |
47.2% |
39.4% |
28.5% |
20.5% |
19.8% |
Cash conversion |
0.7x |
0.4x |
0.8x |
0.9x |
0.9x |
Valuation |
|
|
|
LSE |
MOEX |
|
|
|
|||
SoTP DCF fair value and calculation of target price |
|
$mn |
$/share |
RUB/sh |
|
Olimpiada |
|
|
9,917 |
37.5 |
5,133 |
Blagodatnoye |
|
|
2,984 |
11.3 |
1,544 |
Verninskoye |
|
|
1,219 |
4.6 |
631 |
Alluvials |
|
|
151 |
0.6 |
78 |
Kuranakh |
|
|
843 |
3.2 |
437 |
Natalka |
|
|
3,260 |
12.3 |
1,687 |
Sukhoi Log |
|
|
-43 |
-0.2 |
-22 |
Other |
|
|
-1,393 |
-5.3 |
-721 |
Operating value |
|
|
16,938 |
64.0 |
8,768 |
Financial instruments and rehab provision as at 31 December 20 |
-886 |
-3.3 |
-459 |
||
Enterprise value |
|
|
16,052 |
60.6 |
8,309 |
Net debt as at 31 December 2018 |
|
|
-3,086 |
-11.7 |
-1,597 |
Minority interest |
|
|
-87 |
-0.3 |
-45 |
Convertible debt cost at conversion price |
|
|
-58 |
-0.2 |
-30 |
Cash raised in rights issue during 2019E |
|
|
0 |
0.0 |
0 |
Equity value |
|
|
12,822 |
48.4 |
6,637 |
Rounded to |
|
|
|
48.0 |
6,600 |
Share price on 26/3/2019 |
|
|
|
42.2 |
5,434 |
Expected share price return |
|
|
|
13.9% |
21.5% |
Plus: expected dividend yield |
|
|
|
6.2% |
6.3% |
Total implied one-year return |
|
|
|
20.1% |
27.8% |
|
|
Share price range, RUB |
|
|
|
|
|
|
|
|
12-month high on 31-1-2019 |
5,678 |
12-month low on 9-4-2018 |
3,208 |
|||
|
Natalka |
Price move since high |
-4.3% |
Price move since low |
|
69.4% |
||
|
|
|
|
|
|
|
|
|
|
16% |
Calculation of WACC |
|
|
|
|
|
|
Kuranakh |
Olimpiada |
|
|
|
|
|
|
|
52% |
WACC |
8.7% |
Cost of debt |
|
|
7.0% |
||
5% |
|
Risk-free rate |
4.0% |
Tax rate |
|
|
20% |
|
|
|
|
|
|||||
Alluvials |
|
Equity risk premium |
6.0% |
After-tax cost of debt |
|
1.7% |
||
3% |
|
Beta |
1.00 |
Debt weighting |
|
30% |
||
|
|
Cost of equity |
10.0% Terminal growth rate |
|
2.0% |
|||
Verninskoye |
|
Valuation ratios |
|
|
|
|
|
|
7% |
|
|
|
|
|
|
|
|
Blagodatnoye |
Dec-YE, $mn |
2017 |
2018 |
|
2019E |
2020E |
2021E |
|
|
|
|||||||
|
P/E multiple |
9.7x |
6.9x |
|
6.8x |
6.9x |
7.0x |
|
|
17% |
|
||||||
|
Dividend yield |
5.3% |
6.2% |
|
5.9% |
7.0% |
6.7% |
|
|
|
|
||||||
|
|
EV/EBITDA |
7.8x |
6.6x |
|
5.3x |
5.1x |
4.9x |
|
|
P/B |
17.9x |
25.1x |
|
8.4x |
5.2x |
3.7x |
|
|
NAV per share, $ |
4.3 |
2.7 |
|
10.1 |
16.3 |
22.8 |
Source: Bloomberg, Thomson Reuters, Renaissance Capital estimates
82
vk.com/id446425943
Sibanye-Stillwater – BUY
Renaissance Capital
1 April 2019
Metals & Mining
Figure 129: Sibanye-Stillwater, $mn (unless otherwise noted) |
|
|
|
|
|
|
|
|
|
|
|
||||
Sibanye-Stillwater |
|
SGLJ.J |
|
|
|
|
|
Target price, ZAR: |
|
|
19.5 |
||||
Market capitalisation, $mn: |
|
2,760 |
|
|
|
|
|
Share price, ZAR: |
|
|
17.4 |
||||
Enterprise value, $mn: |
|
4,726 |
|
|
|
|
|
Potential 12-month return: |
|
14.2% |
|||||
|
|
|
|
|
|
|
|
|
|
|
|
|
|
|
|
Dec-YE |
|
|
2017 |
2018 |
2019E |
2020E |
2021E |
Dec-YE |
2017 |
2018 |
|
2019E |
2020E |
2021E |
|
Income statement |
|
|
|
|
|
|
Balance sheet |
|
|
|
|
|
|
||
Revenue |
|
3,449 |
3,826 |
4,470 |
5,426 |
5,381 |
|
Net operating assets |
4,316 |
3,604 |
|
3,708 |
3,987 |
4,119 |
|
EBITDA |
|
|
680 |
631 |
1,285 |
1,910 |
1,793 |
|
Investments, net of rehab provision |
-466 |
-351 |
|
-351 |
-351 |
-351 |
EBIT |
|
|
251 |
132 |
795 |
1,388 |
1,242 |
|
Equity |
1,942 |
1,723 |
|
2,092 |
2,767 |
3,257 |
Other items |
|
-47 |
-39 |
-48 |
-73 |
-83 |
|
Minority interest |
0 |
0 |
|
0 |
0 |
0 |
|
Net interest |
|
-254 |
15 |
-211 |
-182 |
-147 |
|
Net debt |
1,908 |
1,530 |
|
1,265 |
869 |
511 |
|
Taxation |
|
221 |
-82 |
-150 |
-317 |
-283 |
|
Balance sheet ratios |
|
|
|
|
|
|
|
Minority interest in profit |
-0 |
2 |
-55 |
-72 |
-64 |
|
|
|
|
|
|
|
|||
Net profit for the year |
-333 |
-189 |
369 |
792 |
709 |
|
Gearing (net debt/(net debt+equity)) |
49.6% |
47.0% |
|
37.7% |
23.9% |
13.6% |
||
Headline earnings |
-17 |
-1 |
369 |
792 |
709 |
|
Net debt to EBITDA |
2.8x |
2.4x |
|
1.0x |
0.5x |
0.3x |
||
Headline EPS, ZAR |
-0.12 |
-0.01 |
2.14 |
4.47 |
4.17 |
|
RoCE |
6.8% |
2.8% |
|
17.8% |
29.7% |
25.3% |
||
|
RoIC (after tax) |
22.2% |
0.9% |
|
13.3% |
22.5% |
19.1% |
||||||||
Consensus HEPS, ZAR |
|
|
1.36 |
1.84 |
1.80 |
|
RoE |
-1.1% |
-0.1% |
|
19.4% |
32.6% |
23.6% |
||
DPS declared, ZAR |
0.00 |
0.00 |
0.00 |
1.46 |
1.32 |
|
Cash flow statement |
|
|
|
|
|
|
||
|
|
|
|
|
|
|
|
|
|
|
|
|
|
|
|
Underlying EBIT |
|
|
|
|
|
|
Operating cash flow |
1,120 |
973 |
|
1,051 |
1,496 |
1,492 |
||
Driefontein |
|
54 |
-140 |
-83 |
83 |
50 |
|
Capex (net of disposals) |
-458 |
-541 |
|
-532 |
-706 |
-663 |
|
EBIT margin |
|
9% |
-36% |
-24% |
14% |
9% |
|
Other cash flows |
-3,074 |
51 |
|
-48 |
-73 |
-83 |
|
Kloof |
|
|
123 |
26 |
78 |
122 |
99 |
|
Free cash flow |
-2,412 |
483 |
|
471 |
717 |
747 |
EBIT margin |
|
19% |
4% |
13% |
20% |
16% |
|
Equity shareholders' cash |
-2,262 |
378 |
|
265 |
514 |
577 |
|
Beatrix |
|
|
16 |
1 |
52 |
38 |
19 |
|
Dividends and share buy-backs |
939 |
0 |
|
0 |
-117 |
-220 |
EBIT margin |
|
4% |
0% |
15% |
11% |
6% |
|
Surplus (deficit) cash |
-1,324 |
378 |
|
265 |
396 |
358 |
|
Rustenburg |
T |
45 |
102 |
258 |
365 |
337 |
|
Cash flow ratios |
|
|
|
|
|
|
|
EBIT margin |
|
6% |
12% |
24% |
28% |
26% |
|
27 |
-13 |
|
-5 |
4 |
7 |
||
Stillwater |
|
54 |
145 |
441 |
687 |
666 |
|
Working capital turnover, days |
|
||||||
EBIT margin |
|
8% |
12% |
27% |
33% |
32% |
|
FCF yield |
-50.6% |
14.7% |
|
11.8% |
19.9% |
23.0% |
|
Other |
|
|
-40 |
-3 |
48 |
93 |
71 |
|
Equity shareholders' yield |
-79.2% |
21.6% |
|
9.7% |
18.8% |
21.1% |
Adjusted EBIT |
251 |
132 |
795 |
1,388 |
1,242 |
|
Capex/EBITDA |
67.4% |
85.6% |
|
41.4% |
37.0% |
37.0% |
||
Income statement ratios |
|
|
|
|
|
|
Cash conversion |
134.7x |
-291.0x |
|
0.7x |
0.6x |
0.8x |
||
|
|
|
|
|
|
Valuation |
|
|
|
|
|
|
|||
EBITDA margin |
20% |
16% |
29% |
35% |
33% |
|
|
|
|
|
|
|
|||
EBIT margin |
|
7% |
3% |
18% |
26% |
23% |
|
SoTP DCF fair value |
|
|
|
|
$mn |
ZAR/sh |
|
HEPS Growth |
-107% |
92% |
21500% |
109% |
-7% |
|
Driefontein |
|
|
|
|
119 |
0.8 |
||
Dividend payout ratio |
0% |
0% |
0% |
34% |
33% |
|
Kloof |
|
|
|
|
477 |
3.0 |
||
Input assumptions |
|
|
|
|
|
|
Beatrix |
|
|
|
|
98 |
0.6 |
||
|
|
|
|
|
|
Cooke |
|
|
|
|
-237 |
-1.5 |
|||
Gold, $/oz |
|
1,258 |
1,269 |
1,350 |
1,337 |
1,311 |
|
DRD Gold |
|
|
|
|
58 |
0.4 |
|
Platinum, $/oz |
950 |
880 |
843 |
900 |
966 |
|
Burnstone |
|
|
|
|
104 |
0.7 |
||
Palladium, $/oz |
871 |
1,030 |
1,558 |
1,700 |
1,576 |
|
Rustenburg |
|
|
|
|
1,580 |
10.0 |
||
ZAR/$ |
|
|
13.31 |
13.24 |
14.28 |
14.40 |
14.49 |
|
Kroondal |
|
|
|
|
198 |
1.3 |
Gold breakeven price, $/oz |
1,161 |
1,385 |
1,345 |
1,198 |
1,237 |
|
Stillwater |
|
|
|
|
3,251 |
20.7 |
||
PGM breakeven price, $/oz |
1,049 |
1,182 |
1,329 |
1,371 |
1,362 |
|
Equity accounted income |
|
|
|
|
274 |
1.7 |
||
|
|
|
|
|
|
|
|
|
Corporate and other |
|
|
|
|
-548 |
-3.5 |
Mined volumes, koz |
|
|
|
|
|
|
Operating value |
|
|
|
|
5,372 |
34.1 |
||
Driefontein lumes |
485 |
308 |
260 |
431 |
410 |
|
Financial instruments and rehab provision as at 31 December 2018 |
|
-351 |
-2.2 |
|||||
Kloof |
lumes |
529 |
488 |
445 |
460 |
466 |
|
Enterprise value |
|
|
|
|
5,022 |
31.9 |
|
Beatrix |
lumes |
292 |
274 |
266 |
266 |
246 |
|
Net debt as at 31 December 2018 |
|
|
|
|
-1,530 |
-9.7 |
|
Cooke lumes |
100 |
43 |
38 |
28 |
28 |
|
Minority interest |
|
|
|
|
-435 |
-2.8 |
||
Gold |
lumes |
1,407 |
1,173 |
1,070 |
1,292 |
1,297 |
|
19.9% stake in Aldebaran |
|
|
|
|
7 |
0.0 |
|
Rustenburg |
lumes |
810 |
778 |
750 |
810 |
820 |
|
Cash raised in rights issue during 2019E |
|
|
|
|
0 |
0.0 |
|
Kroondal lumes |
241 |
255 |
240 |
220 |
200 |
|
Equity value |
|
|
|
|
3,064 |
19.5 |
||
Mimosa |
lumes |
124 |
125 |
120 |
120 |
120 |
|
|
|
|
|
|
|
|
|
Rounded to |
|
|
|
|
|
19.5 |
|||||||||
Stillwater lumes |
355 |
594 |
660 |
820 |
870 |
|
Share price on 26/3/2019 |
|
|
|
|
|
17.4 |
||
PGM's 4E |
lumes |
1,550 |
1,770 |
1,782 |
1,988 |
2,028 |
|
Expected share price return |
|
|
|
|
|
12.2% |
|
Attributable Cu eq volume growth |
50% |
-2% |
-3% |
15% |
1% |
|
Plus: expected dividend yield |
|
|
|
|
|
2.0% |
||
|
|
|
|
|
|
|
|
|
Total implied one-year return |
|
|
|
|
|
14.2% |
Contribution to FY19E proportionately consolidated underlying EBITDA
Share price range, ZAR:
|
Driefontein |
Kloof |
|
|
|
0% |
12% |
|
|
Stillwater |
|
|
Beatrix |
Cooke |
44% |
|
|
7% |
|
|
|
|
|
-2% |
|
|
|
DRD Gold |
|
|
|
|
|
1% |
Plat Mile |
Mimosa |
|
Rustenburg |
|
0% |
Kroondal |
22% |
|
|
|
5% |
|
|
|
|
|
7% |
|
|
12-month high on 20-3-2019 |
18 |
12-month low on 19-7-2018 |
7 |
|||
Price move since high |
-3.5% |
Price move since low |
|
154.8% |
||
Calculation of WACC |
|
|
|
|
|
|
WACC |
10.2% |
Cost of debt |
|
|
5.0% |
|
Risk-free rate |
4.0% |
Tax rate |
|
|
28% |
|
Equity risk premium |
6.0% |
After-tax cost of debt |
|
0.7% |
||
Beta |
1.30 |
Debt weighting |
|
20% |
||
Cost of equity |
11.8% |
Terminal growth rate |
|
2.0% |
||
Valuation ratios |
|
|
|
|
|
|
Dec-YE, $mn |
2017 |
2018 |
|
2019E |
2020E |
2021E |
Dividend yield |
0.0% |
0.0% |
|
0.0% |
8.4% |
7.6% |
P/B |
1.5x |
1.0x |
|
1.3x |
1.0x |
0.8x |
FCF yield |
-50.6% |
14.7% |
|
11.8% |
19.9% |
23.0% |
NAV per share, $ |
0.9 |
0.8 |
|
0.9 |
1.2 |
1.4 |
NAV per share, ZAR |
12 |
10 |
|
13 |
18 |
21 |
Source: Bloomberg, Thomson Reuters, Renaissance Capital estimates
83