

vk.com/id446425943
Limited lives weighing down IRR
Miners ranked by average remaining lives
Renaissance Capital
1 April 2019
Metals & Mining
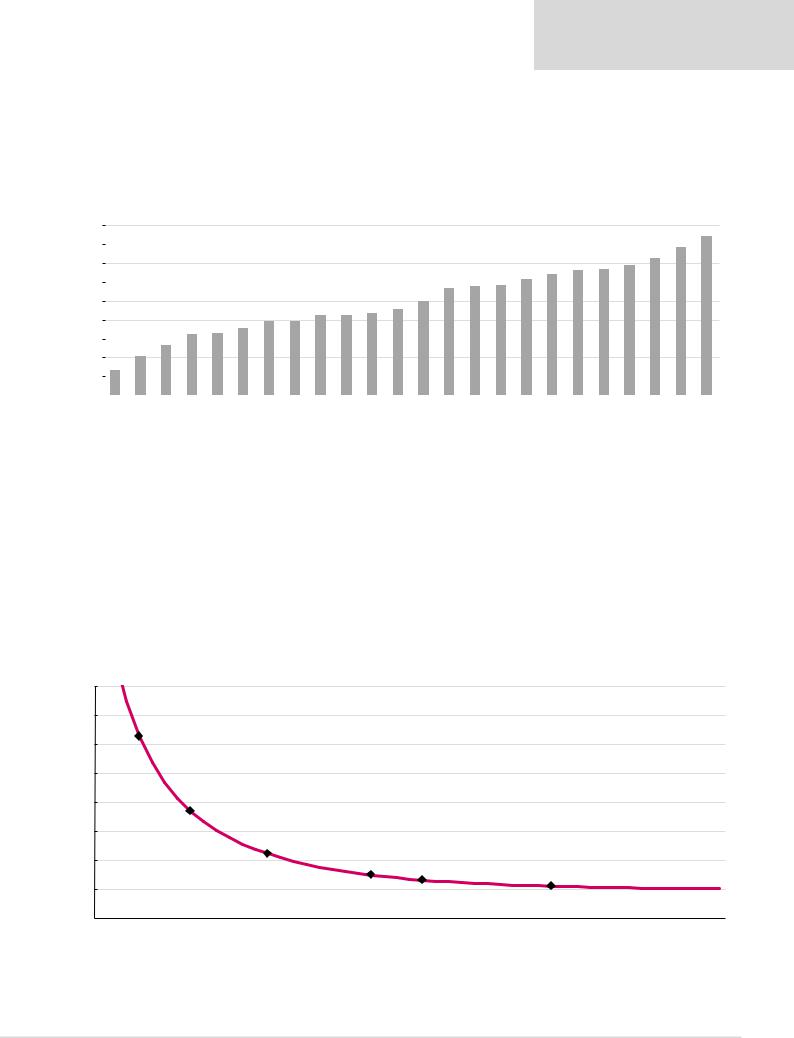
Miners with long reserve lives usually offer capital-efficient expandability and optionality, while shorter-life miners face pressure to replace reserves, often in a value-destructive way. We calculate the longest lives for Amplats, Northam, Exxaro, Rio Tinto and BHP, while the shortest-life miners are AngloGold, Lonmin, Harmony and Polymetal.
Figure 44: Estimated average mine lives for miners under coverage* |
|
|
|
|
|
|
|
|
|
|
|
|
|
|
|
||||||||||
45 |
|
|
|
|
|
|
|
|
|
|
|
|
|
|
|
|
|
|
|
|
|
|
39 |
42 |
|
|
|
|
|
|
|
|
|
|
|
|
|
|
|
|
|
|
|
|
|
|
|
||||
40 |
|
|
|
|
|
|
|
|
|
|
|
|
|
|
|
|
|
|
|
|
|
|
|
||
|
|
|
|
|
|
|
|
|
|
|
|
|
|
|
|
|
|
|
|
|
|
|
|
||
|
|
|
|
|
|
|
|
|
|
|
|
|
|
|
|
|
|
|
|
34 |
36 |
|
|
||
35 |
|
|
|
|
|
|
|
|
|
|
|
|
|
|
|
|
|
32 |
33 |
33 |
|
|
|
||
|
|
|
|
|
|
|
|
|
|
|
|
|
|
|
|
31 |
|
|
|
|
|||||
|
|
|
|
|
|
|
|
|
|
|
|
|
28 |
29 |
29 |
|
|
|
|
|
|
||||
|
|
|
|
|
|
|
|
|
|
|
|
|
|
|
|
|
|
|
|
|
|||||
30 |
|
|
|
|
|
|
|
|
|
|
|
|
|
|
|
|
|
|
|
|
|
||||
|
|
|
|
|
|
|
|
|
|
|
|
|
|
|
|
|
|
|
|
|
|
|
|||
|
|
|
|
|
|
|
|
|
|
|
23 |
25 |
|
|
|
|
|
|
|
|
|
|
|
||
|
|
|
|
|
|
|
|
|
|
|
|
|
|
|
|
|
|
|
|
|
|
|
|||
25 |
|
|
|
|
|
|
|
|
21 |
21 |
22 |
|
|
|
|
|
|
|
|
|
|
|
|
||
|
|
|
|
|
|
20 |
20 |
|
|
|
|
|
|
|
|
|
|
|
|
|
|||||
20 |
|
|
|
|
|
18 |
|
|
|
|
|
|
|
|
|
|
|
|
|
|
|
|
|||
|
|
|
16 |
17 |
|
|
|
|
|
|
|
|
|
|
|
|
|
|
|
|
|
|
|||
|
|
|
|
|
|
|
|
|
|
|
|
|
|
|
|
|
|
|
|
|
|
||||
15 |
|
|
13 |
|
|
|
|
|
|
|
|
|
|
|
|
|
|
|
|
|
|
|
|
|
|
|
11 |
|
|
|
|
|
|
|
|
|
|
|
|
|
|
|
|
|
|
|
|
|
|
||
|
|
|
|
|
|
|
|
|
|
|
|
|
|
|
|
|
|
|
|
|
|
|
|
||
10 |
7 |
|
|
|
|
|
|
|
|
|
|
|
|
|
|
|
|
|
|
|
|
|
|
|
|
5 |
|
|
|
|
|
|
|
|
|
|
|
|
|
|
|
|
|
|
|
|
|
|
|
|
|
|
|
|
|
|
|
|
|
|
|
|
|
|
|
|
|
|
|
|
|
|
|
|
|
||
0 |
|
|
|
|
|
|
|
|
|
|
|
|
|
|
|
|
|
|
|
|
|
|
|
|
|
AngloGold |
Lonmin |
Harmony |
Polymetal |
Sibanye |
South32 |
Gold Fields |
Kumba |
Vale |
Fortescue |
Impala |
Alrosa |
Glencore |
Anglo |
Norilsk |
ARM |
RBPlats |
Polyus |
Assore |
BHP |
Rio Tinto |
Exxaro |
Northam |
Amplats |
||
|
|||||||||||||||||||||||||
*Group average calculated using FY18 Cu eq. reserves or resources/FY21 Cu eq. production. (except for Northam where we use Group average calculated using FY18 Cu eq. reserves or resources/FY22 Cu eq. production)
Source: Renaissance Capital estimates
Short-life miners need higher FCF yields to meet required returns
Miners with shorter reserve lives require higher annual FCF yields to achieve IRR that meets cost of equity. The chart below shows the annual FCF yields required to achieve a 10% IRR over the average lives of a selection of mining companies. For example, AngloGold requires annual FCF yields of 20.5% over its 10-year remaining life to achieve a 10% IRR, while Amplats requires FCF yields of only 10.2% over its 40-year life for a 10% IRR.
Figure 45: Annual yield required for a 10% IRR
24%
22%
AngloGold, 20.5%
20%
18%
16% |
|
|
|
Lonmin, 15.4% |
|
|
|
|
|
|
|
|
|
|
|
|
|
|
|
|
|
|
||
|
|
|
|
|
|
|
|
|
|
|
|
|
|
|
|
|
|
|
|
|
|
|||
14% |
|
|
|
|
|
|
|
|
|
|
|
|
|
|
|
|
|
|
|
|
|
|
|
|
|
|
|
|
|
|
|
Sibanye, 12.5% |
|
|
|
|
|
|
|
|
|
|
|
|
|
|
|
||
12% |
|
|
|
|
|
|
|
|
|
Glencore, 11.0% |
|
|
|
|
|
Amplats, 10.2% |
|
|
|
|
|
|
||
|
|
|
|
|
|
|
|
|
|
|
|
|
|
|
|
|
|
|
|
|
|
|
||
10% |
|
|
|
|
|
|
|
|
|
|
Anglo American, 10.7% |
|
|
|
|
|
|
|
|
|
|
|||
|
|
|
|
|
|
|
|
|
|
|
|
|
|
|
|
|
|
|
|
|
||||
8% |
|
|
|
|
|
|
|
|
|
|
|
|
|
|
|
|
|
|
|
|
|
|
|
|
4 |
6 |
8 |
10 |
12 |
14 |
16 |
18 |
20 |
22 |
24 |
26 |
28 |
30 |
32 |
34 |
36 |
38 |
40 |
42 |
44 |
46 |
48 |
50 |
52 |
Source: Renaissance Capital estimates
25