

vk.com/id446425943
African Rainbow Minerals – BUY
Renaissance Capital
1 April 2019
Metals & Mining
Figure 110: African Rainbow Minerals, ZARmn (unless otherwise noted)
|
|
|
|
African Rainbow Minerals |
ARIJ.J |
Target price, ZAR: |
190 |
Market capitalisation, ZARmn: |
36,833 |
Last price, ZAR: |
166 |
Enterprise value, ZARmn: |
39,928 |
Potential 12-month return: |
23.1% |
Jun-YE |
2017 |
2018 |
2019E |
2020E |
2021E |
Income statement |
|
|
|
|
|
Revenue |
8,158 |
8,142 |
9,048 |
11,701 |
13,028 |
Underlying EBITDA |
922 |
1,799 |
2,333 |
4,250 |
5,098 |
Underlying EBIT |
214 |
1,058 |
1,579 |
3,487 |
4,192 |
Net interest |
-185 |
-183 |
-16 |
164 |
402 |
Equity accounted income |
3,446 |
4,129 |
5,345 |
5,177 |
3,910 |
Taxation |
409 |
-573 |
-321 |
-1,022 |
-1,286 |
Other |
-2,512 |
131 |
-1,639 |
-821 |
-850 |
Net profit for the year |
1,372 |
4,562 |
4,948 |
6,984 |
6,368 |
Headline earnings |
3,215 |
4,851 |
5,870 |
6,984 |
6,368 |
HEPS, ZAc |
1,684 |
2,526 |
3,033 |
3,613 |
3,294 |
Thomson Reuters consensus EPS, ZAc |
|
|
2,734 |
2,862 |
2,202 |
DPS declared, ZAc |
650 |
1,000 |
1,200 |
1,500 |
1,500 |
Underlying EBIT |
832 |
1,026 |
2,025 |
3,588 |
3,658 |
Platinum |
|||||
EBIT margin |
16% |
19% |
30% |
40% |
39% |
Nkomati |
120 |
18 |
-404 |
27 |
751 |
EBIT margin |
6% |
1% |
-34% |
2% |
29% |
Goedgevonden |
78 |
408 |
253 |
252 |
206 |
EBIT margin |
9% |
40% |
22% |
23% |
19% |
Other |
-816 |
-394 |
-295 |
-380 |
-423 |
Underlying EBIT |
214 |
1,058 |
1,579 |
3,487 |
4,192 |
Income statement ratios* |
|
|
|
|
|
EBITDA margin |
31% |
34% |
39% |
41% |
38% |
EBIT margin |
3% |
13% |
17% |
30% |
32% |
HEPS growth |
241% |
50% |
20% |
19% |
-9% |
Dividend payout ratio |
39% |
40% |
40% |
42% |
46% |
Input assumptions |
|
|
|
|
|
$/ZAR |
13.60 |
12.85 |
14.18 |
14.40 |
14.41 |
Platinum, $/oz |
988 |
940 |
827 |
875 |
920 |
Iron ore (62%Fe, CIF China), $/t |
69 |
67 |
75 |
88 |
83 |
Manganese ore (44%, CIF China), $/mtu |
5.72 |
6.79 |
6.45 |
5.24 |
5.41 |
Nickel, $/t |
10,134 |
12,474 |
12,504 |
13,584 |
15,496 |
Required breakeven price |
|
|
|
|
|
3PGMs, $/3PGM oz |
811 |
860 |
848 |
932 |
960 |
Nickel, $/t |
9,132 |
12,384 |
17,396 |
14,165 |
9,637 |
Iron ore, $/t |
37 |
46 |
32 |
41 |
50 |
Manganese ore, $/mtu |
3.84 |
4.71 |
5.34 |
4.47 |
4.53 |
Export thermal coal, $/t |
62 |
68 |
72 |
67 |
70 |
Sales volumes |
|
|
|
|
|
PGMs in concentrate - attributable, k oz |
324 |
316 |
309 |
312 |
316 |
Iron ore, kt |
8,638 |
8,937 |
8,726 |
8,700 |
8,700 |
Manganese ore, kt |
1,487 |
1,589 |
1,628 |
1,750 |
1,860 |
Nickel, t |
7,938 |
6,651 |
6,481 |
6,581 |
7,875 |
Attributable Cu eq volumes, kt |
287 |
287 |
274 |
282 |
290 |
Volume growth |
-1.3% |
0.2% |
-4.7% |
2.9% |
2.8% |
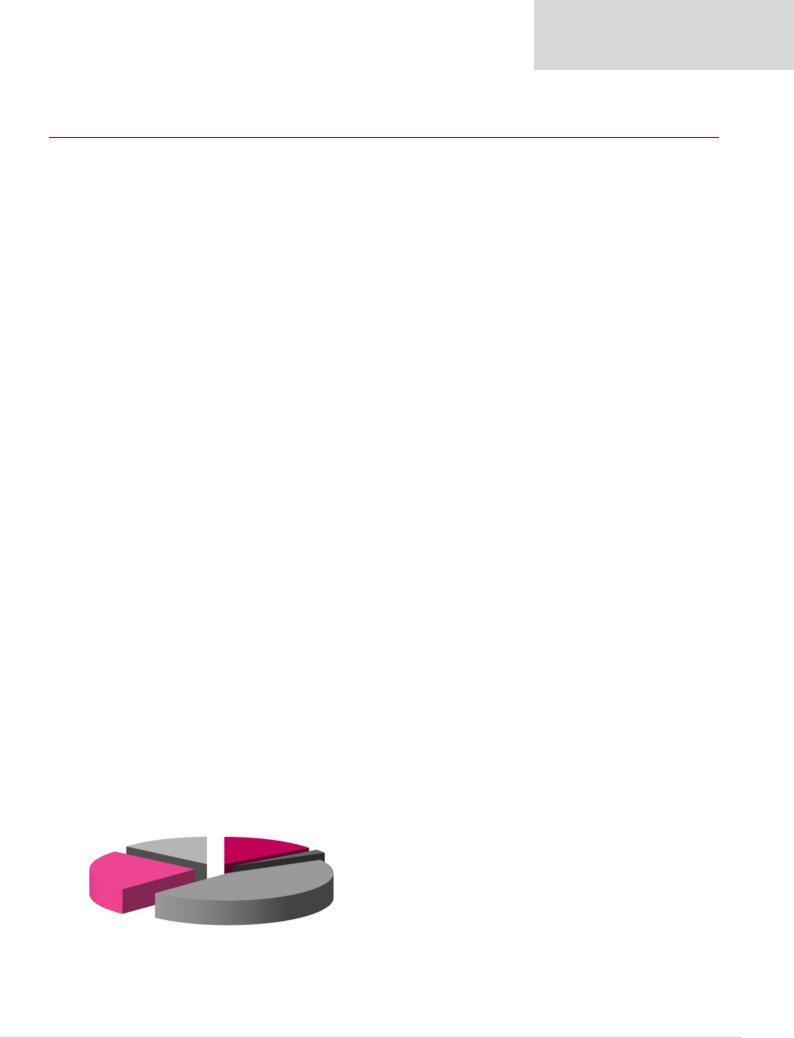
Contribution to FY19E attributable underlying EBITDA
Jun-YE |
|
|
2019E |
2020E |
2021E |
2017 |
2018 |
||||
Balance sheet |
|
|
|
|
|
Net operating assets |
23,738 |
24,822 |
26,231 |
25,998 |
26,082 |
Investments |
1,573 |
1,561 |
2,165 |
2,165 |
2,165 |
Equity |
23,497 |
25,907 |
29,069 |
32,915 |
36,145 |
Minority interest |
543 |
1,471 |
1,674 |
1,838 |
2,008 |
Net debt (cash) |
1,271 |
-995 |
-2,347 |
-6,590 |
-9,906 |
Balance sheet ratios |
|
|
|
|
|
Gearing* |
5.1% |
-4.0% |
-8.8% |
-25.0% |
-37.8% |
Net debt to EBITDA plus equity income |
0.3x |
-0.2x |
-0.3x |
-0.7x |
-1.1x |
RoCE (excluding Harmony) |
19.9% |
23.5% |
32.7% |
37.6% |
33.7% |
RoIC |
15.9% |
22.1% |
31.3% |
35.4% |
30.4% |
RoE |
13.5% |
19.5% |
21.3% |
22.5% |
18.4% |
*net debt/(net debt+equity) |
|
|
|
|
|
Cash flow statement |
|
|
|
|
|
Operating cash flow |
2,312 |
3,914 |
4,801 |
9,341 |
8,345 |
Capex (net of disposals) |
-981 |
-944 |
-1,287 |
-1,445 |
-1,524 |
Other cash flows |
2,030 |
1,179 |
215 |
0 |
0 |
FCF |
3,361 |
4,149 |
3,730 |
7,896 |
6,821 |
Equity shareholders' cash |
3,390 |
3,980 |
3,622 |
7,381 |
6,454 |
Dividends and share buy-backs |
-426 |
-1,714 |
-2,270 |
-3,138 |
-3,138 |
Movement in net debt |
2,964 |
2,266 |
1,352 |
4,243 |
3,316 |
Cash flow ratios |
|
|
|
|
|
Working capital days |
66 |
90 |
96 |
100 |
96 |
Capex/EBITDA |
106.4% |
52.5% |
55.1% |
34.0% |
29.9% |
Cash conversion |
1.1x |
0.8x |
0.6x |
1.1x |
1.0x |
FCF yield |
16.8% |
19.1% |
11.7% |
28.4% |
27.7% |
Equity shareholders' yield |
18.7% |
18.7% |
11.1% |
22.7% |
19.8% |
Valuation |
|
|
|
|
|
SoTP DCF valuation and calculation of target price |
|
|
ZARmn |
ZAR/sh |
|
Iron ore |
|
|
|
13,486 |
64.5 |
Manganese |
|
|
|
9,210 |
44.0 |
Two Rivers (effective interest = 54%) |
|
|
|
4,096 |
19.6 |
Modikwa (41.5%) |
|
|
|
2,061 |
9.8 |
Nkomati |
|
|
|
1,990 |
9.5 |
PCB Coal less debt (effective interest = 20.2%) |
|
|
1,838 |
8.8 |
|
Goedgevonden (effective interest = 26%) |
|
|
|
1,122 |
5.4 |
Copper and exploration |
|
|
|
0 |
0.0 |
Harmony at listed market value |
|
|
|
2,339 |
11.2 |
Corporate and other |
|
|
|
-1,929 |
-9.2 |
Enterprise value |
|
|
|
34,212 |
163.5 |
Net cash and other |
|
|
|
1,795 |
8.6 |
Equity value |
|
|
|
36,007 |
172.1 |
Plus: equity shareholders' cash/share |
|
|
|
|
33.2 |
Less: DPS |
|
|
|
|
-14.2 |
TP, rounded to |
|
|
|
|
190.0 |
Share price on 26/3/2019 |
|
|
|
|
166.0 |
Expected share price return |
|
|
|
|
14.5% |
Plus: expected dividend yield |
|
|
|
|
8.6% |
Total implied one-year return |
|
|
|
|
23.1% |
Share price range, ZAR:
|
|
|
12-month high on 28/3/2019 |
175 |
12-month low on 4/4/2018 |
90 |
|||
|
|
|
Price move since high |
-3.7% |
Price move since low |
|
86.6% |
||
|
Coal |
Platinum |
Calculation of discount rate |
|
|
|
|
|
|
|
15% |
|
|
|
|
|
|
||
|
14% |
|
|
|
|
|
|
|
|
|
|
WACC |
16.8% |
Cost of debt |
|
|
10.0% |
||
|
|
|
|
|
|||||
|
|
Nickel |
Risk-free rate |
9.0% |
Tax rate |
|
|
28% |
|
|
|
-2% |
Equity risk premium |
6.0% |
After-tax cost of debt |
|
7.2% |
||
|
|
|
Beta |
1.30 |
Debt weighting |
|
0.0% |
||
|
|
|
Cost of equity |
16.8% |
Terminal growth rate |
|
2.0% |
||
|
|
|
Valuation ratios |
|
|
|
|
|
|
Manganese |
|
|
Jun-YE |
2017 |
2018 |
|
2019E |
2020E |
2021E |
24% |
|
Iron ore |
P/E multiple |
5.7x |
4.4x |
|
5.6x |
4.7x |
5.1x |
|
|
Dividend yield |
6.8% |
9.0% |
|
7.1% |
8.9% |
8.9% |
|
|
|
45% |
|
||||||
|
|
EV/EBITDA |
4.6x |
3.7x |
|
4.2x |
3.0x |
2.7x |
|
|
|
|
|
||||||
|
|
|
P/B |
0.8x |
0.8x |
|
1.1x |
1.0x |
0.9x |
|
|
|
NAV per share, ZAR |
124 |
136 |
|
150 |
170 |
187 |
* Proportionately consolidated
Source: Bloomberg, Thomson Reuters, Company data, Renaissance Capital estimates
64