

- •Contents
- •Revisions to our forecasts, TPs and ratings
- •Investment stance
- •Capital cycle favours rising returns
- •Comfortable balance sheets and supportive dividend potential
- •Value relative to other stocks
- •Yield potential through the cycle
- •Mid-cycle cash generation offers supportive yields
- •Where to hide if you are bearish
- •What to buy if you are bullish
- •Limited lives weighing down IRR
- •Yields should compensate for limited lives
- •Positive earnings momentum continues to support share prices
- •Commodity price revisions
- •Commodity section
- •Commodity section
- •Preference for base metals over steelmaking materials
- •Earnings revisions
- •Risks and catalysts
- •Peer comp charts
- •Commodity price and exchange rate forecasts
- •Important publications
- •African Rainbow Minerals
- •Alrosa
- •Anglo American
- •Assore
- •Exxaro
- •Glencore
- •Kumba Iron ore
- •NorNickel
- •Rio Tinto
- •Rusal
- •Vale
- •Gold Fields
- •Harmony
- •Polymetal
- •Anglo American Platinum
- •Lonmin
- •Northam
- •Royal Bafokeng Platinum
- •Sasol
- •Disclosures appendix
vk.com/id446425943
Rusal – BUY
Renaissance Capital
1 April 2019
Metals & Mining
Figure 121: Rusal, $mn (unless otherwise noted) |
|
|
|
Rusal |
0486.HK |
Target price, HKD: |
6.6 |
Market capitalisation, $mn: |
6,854 |
Share price, HKD: |
3.5 |
Enterprise value, $mn: |
14,296 |
Potential 12-month return: |
90.4% |
Dec-YE |
2017 |
2018 |
2019E |
2020E |
2021E |
Income statement |
|
|
|
|
|
Revenue |
9,969 |
10,280 |
10,239 |
10,834 |
11,522 |
Underlying EBITDA |
2,120 |
2,163 |
1,376 |
2,031 |
2,056 |
Underlying EBIT |
1,607 |
1,638 |
852 |
1,456 |
1,481 |
EBIT |
1,523 |
1,481 |
852 |
1,456 |
1,481 |
Net interest |
-855 |
-483 |
-538 |
-452 |
-357 |
Equity accounted income |
620 |
955 |
1,370 |
1,531 |
1,453 |
Taxation |
-66 |
-255 |
-53 |
-171 |
-191 |
Other |
0 |
0 |
0 |
0 |
0 |
Net profit for the year |
1,222 |
1,698 |
1,631 |
2,364 |
2,386 |
Underlying earnings |
1,222 |
1,698 |
1,631 |
2,364 |
2,386 |
Underlying EPS, USc |
8.04 |
11.18 |
10.73 |
15.56 |
15.70 |
Thomson Reuters consensus EPS, USc |
|
|
10.88 |
11.94 |
13.46 |
DPS declared, USc |
1.97 |
0.00 |
1.66 |
2.22 |
2.83 |
Income statement ratios |
|
0.389525 |
|
|
|
|
|
|
|
|
|
EBITDA margin |
21% |
21% |
13% |
19% |
18% |
EBIT margin |
15% |
14% |
8% |
13% |
13% |
EPS growth |
4% |
39% |
-4% |
45% |
1% |
Dividend payout ratio |
24% |
0% |
15% |
14% |
18% |
Input assumptions |
|
|
|
|
|
Aluminium, $/t |
1,968 |
2,110 |
1,950 |
2,200 |
2,307 |
Alumina, $/t |
376 |
480 |
390 |
418 |
388 |
RUB/$ |
58 |
63 |
67 |
69 |
68 |
Estimated aluminium breakeven price, $/t |
1,588 |
1,626 |
1,720 |
1,792 |
1,903 |
Production volumes, kt |
|
|
|
|
|
Aluminium |
|
|
|
|
|
Russia Aluminium |
3,584 |
3,621 |
3,616 |
3,621 |
3,716 |
Other |
144 |
127 |
136 |
136 |
136 |
Total |
3,728 |
3,754 |
3,752 |
3,757 |
3,852 |
Alumina |
|
|
|
|
|
Ireland |
1,938 |
1,875 |
1,872 |
1,872 |
1,872 |
Jamaica |
582 |
501 |
520 |
520 |
520 |
Ukraine |
1,675 |
1,715 |
1,756 |
1,756 |
1,756 |
Russia |
2,821 |
2,762 |
2,620 |
2,620 |
2,620 |
Australia (JV) |
755 |
739 |
744 |
744 |
744 |
Total |
7,772 |
7,774 |
7,892 |
7,992 |
7,992 |
Bauxite |
|
|
|
|
|
Jamaica |
1,954 |
1,792 |
1,920 |
1,920 |
1,920 |
Russia |
5,524 |
5,650 |
5,056 |
5,056 |
5,056 |
Guinea |
3,123 |
4,129 |
5,680 |
6,980 |
6,980 |
Guyana |
1,044 |
1,395 |
1,380 |
1,380 |
1,380 |
Total |
11,646 |
13,847 |
16,736 |
18,336 |
18,336 |
Nepheline |
4,333 |
4,293 |
3,268 |
3,268 |
3,268 |
Aluminium foil and packaging |
101 |
89 |
76 |
76 |
76 |
Sales volumes |
|
|
|
|
|
Aluminium, kt |
3,955 |
3,671 |
4,012 |
3,757 |
3,852 |
Value added products, % of total |
47% |
45% |
46% |
50% |
52% |
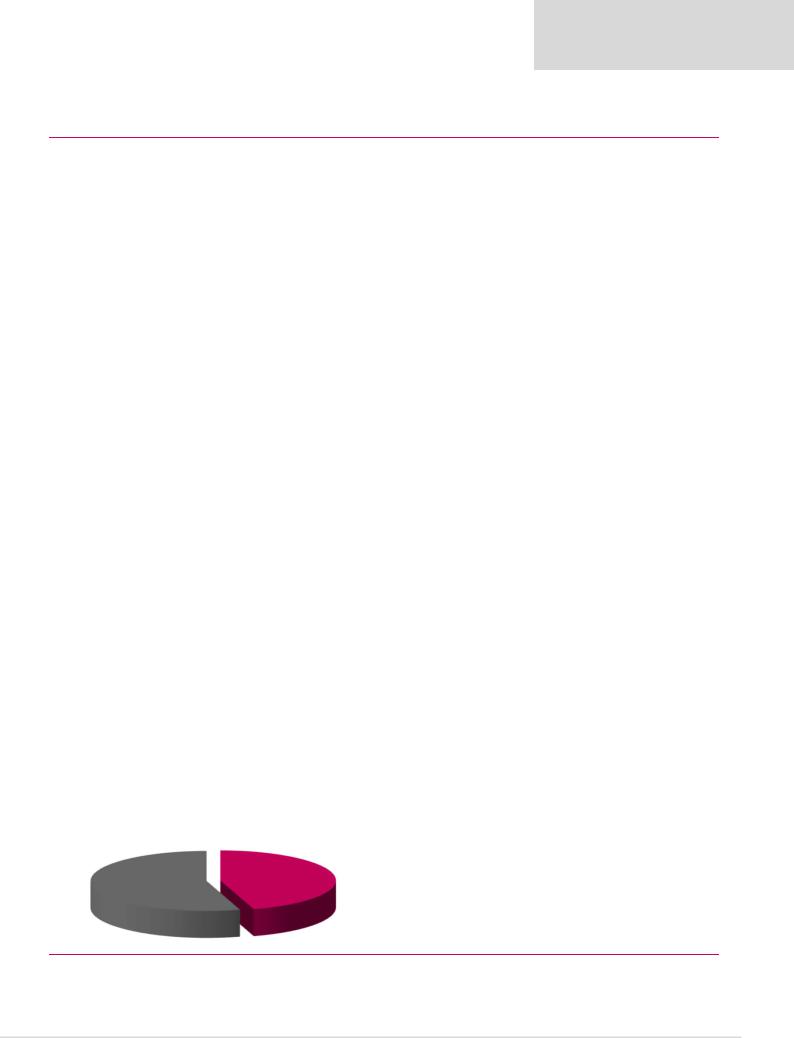
Contribution to enterprise value of $20bn
Norilsk Nickel |
Aluminium |
|
55% |
||
45% |
||
|
Dec-YE |
|
|
|
2019E |
2020E |
2021E |
2017 |
2018 |
|
||||
Balance sheet |
|
|
|
|
|
|
Net operating assets |
12,139 |
12,640 |
|
12,370 |
12,560 |
12,805 |
Financial instruments |
-50 |
11 |
|
11 |
11 |
11 |
Equity |
4,441 |
5,209 |
|
6,588 |
8,615 |
10,570 |
Minority interest |
0 |
0 |
|
0 |
0 |
0 |
Net debt |
7,648 |
7,442 |
|
5,793 |
3,956 |
2,246 |
Balance sheet ratios |
|
|
|
|
|
|
Gearing (net debt/(net debt+equity)) |
63.3% |
58.8% |
|
46.8% |
31.5% |
17.5% |
Net debt/(EBITDA+dividends from associat |
2.6x |
2.4x |
|
2.3x |
1.2x |
0.6x |
RoCE |
12.6% |
12.4% |
|
6.4% |
10.9% |
10.9% |
RoIC (after tax) |
10.3% |
9.1% |
|
5.5% |
9.3% |
9.2% |
RoE |
32.9% |
35.2% |
|
27.6% |
31.1% |
24.9% |
Cash flow statement |
|
|
|
|
|
|
Operating cash flow |
2,561 |
1,462 |
|
3,208 |
3,409 |
3,144 |
Capex |
-842 |
-834 |
|
-850 |
-850 |
-700 |
Other FCF |
-3 |
49 |
|
0 |
0 |
0 |
FCF |
1,717 |
678 |
|
2,358 |
2,559 |
2,444 |
Equity shareholders' cash |
1,072 |
206 |
|
1,901 |
2,175 |
2,141 |
Dividends and share buy backs |
-299 |
0 |
|
-252 |
-337 |
-430 |
Surplus (deficit) cash |
773 |
206 |
|
1,649 |
1,838 |
1,710 |
Cash flow ratios |
|
|
|
|
|
|
Working capital days |
64 |
104 |
|
76 |
64 |
64 |
Cash conversion |
0.9x |
0.1x |
|
1.2x |
0.9x |
0.9x |
FCF yield |
10.4% |
5.1% |
|
18.6% |
23.7% |
26.9% |
Equity shareholders' yield |
12.2% |
3.6% |
|
27.7% |
31.7% |
31.2% |
Capex/(EBITDA+Norilsk dividends) |
28.8% |
27.1% |
|
33.7% |
25.0% |
20.0% |
Valuation |
|
|
|
|
|
|
SoTP DCF valuation and calculation of target price |
|
$mn |
HKD/sh |
|||
Aluminium |
|
|
|
|
9,195 |
4.8 |
Norilsk Nickel |
|
|
|
|
11,084 |
5.7 |
Total enterprise value |
|
|
|
|
20,279 |
10.5 |
Net debt as at 31 December 2018 |
|
|
|
|
-7,442 |
-3.8 |
Cash used in share buy-backs |
|
|
|
|
0 |
0.0 |
Other investments |
|
|
|
|
11 |
0.0 |
Minority interest |
|
|
|
|
0 |
0.0 |
Equity value as at 27/3/2019 |
|
|
|
|
12,848 |
6.6 |
TP |
|
|
|
|
|
6.6 |
Share price on 26/3/2019 |
|
|
|
|
|
3.5 |
Expected share price return |
|
|
|
|
|
86.4% |
Plus: expected dividend yield |
|
|
|
|
|
4.0% |
Total implied one-year return |
|
|
|
|
|
90.4% |
Share price range, HKD: |
|
|
|
|
|
|
12-month high on 27/3/2018 |
4.8 |
12-month low on 17/4/2018 |
1.3 |
|||
Price move since high |
-26.9% Price move since low |
|
170.2% |
|||
Calculation of discount rate |
|
|
|
|
|
|
WACC |
12.5% |
Cost of debt |
|
|
6.0% |
|
Risk-free rate |
4.0% |
Tax rate |
|
|
15% |
|
Equity risk premium |
8.0% After-tax cost of debt |
|
5.1% |
|||
Beta |
1.30 |
Debt weighting |
|
20% |
||
Cost of equity |
14.4% |
Terminal growth rate |
|
2.0% |
||
Valuation ratios |
|
|
|
|
|
|
Dec-YE |
2017 |
2018 |
|
2019E |
2020E |
2021E |
P/E multiple |
7.2x |
3.4x |
|
4.2x |
2.9x |
2.9x |
Dividend yield |
3.4% |
0.0% |
|
3.7% |
4.9% |
6.3% |
EV/(EBITDA+Equity income) |
6.0x |
4.2x |
|
4.6x |
3.0x |
2.6x |
P/B |
2.0x |
1.1x |
|
1.0x |
0.8x |
0.6x |
NAV per share, USc |
29.2 |
34.3 |
|
43.4 |
56.7 |
69.6 |
NAV per share, HKD |
2.3 |
2.7 |
|
3.4 |
4.5 |
5.5 |
Source: Bloomberg, Thomson Reuters, Company data, Renaissance Capital estimates
75

vk.com/id446425943
South32 – HOLD
Renaissance Capital
1 April 2019
Metals & Mining
Figure 122: South32, $mn (unless otherwise noted)
|
|
|
|
South32 (Pro forma historic financials) |
S32J.J |
Target price, ZAR: |
40.0 |
Market capitalisation, $mn: |
13,214 |
Share price, ZAR: |
38.1 |
Enterprise value, $mn: |
10,927 |
Potential 12-month return: |
11.6% |
Jun-YE |
|
|
2017 |
2018 |
2019E |
2020E |
2021E |
Income statement |
|
|
|
|
|
|
|
Revenue |
|
|
6,950 |
7,549 |
7,772 |
7,895 |
8,238 |
Underlying EBITDA |
|
|
2,411 |
2,516 |
2,559 |
2,378 |
2,521 |
Underlying EBIT |
|
|
1,648 |
1,774 |
1,771 |
1,559 |
1,698 |
Net interest |
|
|
-171 |
-100 |
-97 |
-91 |
-72 |
Taxation |
|
|
-393 |
-287 |
-411 |
-356 |
-414 |
Minority interest in profit |
|
|
0 |
0 |
0 |
0 |
0 |
Attributable profit |
|
|
1,231 |
1,332 |
1,246 |
1,112 |
1,212 |
Underlying earnings |
|
|
1,146 |
1,327 |
1,253 |
1,112 |
1,212 |
Underlying EPS, USc |
|
|
21.6 |
25.7 |
24.8 |
22.2 |
24.2 |
Thomson Reuters consensus, USc |
|
|
|
25.7 |
25.6 |
25.7 |
|
DPS declared, USc |
|
|
10.0 |
13.5 |
16.6 |
17.8 |
19.4 |
Underlying EBIT |
|
|
520 |
870 |
868 |
941 |
1,003 |
Aluminium |
|
|
|||||
EBIT margin |
|
|
16% |
21% |
20% |
21% |
22% |
Manganese |
|
|
577 |
837 |
786 |
470 |
409 |
EBIT margin |
|
|
46% |
52% |
48% |
33% |
29% |
Nickel |
|
|
-16 |
120 |
30 |
55 |
101 |
EBIT margin |
|
|
-4% |
21% |
6% |
11% |
18% |
Cannington |
|
|
308 |
183 |
107 |
164 |
201 |
EBIT margin |
|
|
40% |
31% |
22% |
29% |
33% |
Energy Coal South Africa |
|
|
212 |
276 |
78 |
114 |
149 |
EBIT margin |
|
|
19% |
20% |
6% |
9% |
11% |
Illawarra Metallurgical Coal |
|
|
358 |
-62 |
304 |
122 |
121 |
EBIT margin |
|
|
32% |
-9% |
27% |
11% |
11% |
Other |
|
|
-311 |
-450 |
-401 |
-306 |
-287 |
Underlying EBIT |
|
|
1,648 |
1,774 |
1,771 |
1,559 |
1,698 |
Income statement ratios |
|
|
|
|
|
|
|
EBITDA margin |
|
|
35% |
33% |
33% |
30% |
31% |
EBIT margin |
|
|
24% |
23% |
23% |
20% |
21% |
EPS growth |
|
|
731% |
19% |
-4% |
-10% |
9% |
Dividend payout ratio |
|
|
46% |
53% |
67% |
80% |
80% |
Input assumptions |
|
|
|
|
|
|
|
Aluminium, $/t |
|
|
1,772 |
2,133 |
1,945 |
2,080 |
2,277 |
Manganese ore (44%, CIF China), $/mtu |
|
5.72 |
6.79 |
6.45 |
5.24 |
5.41 |
|
Silver, $/oz |
|
|
18 |
17 |
16 |
18 |
18 |
Hard coking coal, $/t |
|
|
190 |
200 |
204 |
170 |
167 |
$/AUD |
|
|
0.75 |
0.78 |
0.72 |
0.76 |
0.80 |
Required breakeven price |
|
|
|
|
|
|
|
Aluminium, $/t |
|
|
1,389 |
1,747 |
1,861 |
1,774 |
1,824 |
Manganese ore, $/dmtu |
|
|
2.36 |
2.96 |
3.15 |
3.11 |
3.31 |
Silver, $/oz |
|
|
-2.34 |
1.90 |
5.90 |
1.12 |
-0.23 |
Metallurgical coal, $/t |
|
|
117 |
206 |
129 |
136 |
133 |
Sales volumes (South32's share) |
|
|
|
|
|
|
|
Aluminium, kt |
|
|
986 |
985 |
983 |
988 |
988 |
Silver, mn oz |
|
|
16.3 |
12.0 |
12.0 |
10.9 |
11.5 |
Metallurgical coal, mnt |
|
|
6.0 |
2.9 |
5.1 |
5.8 |
6.0 |
Manganese ore, mnt |
|
|
5.1 |
5.4 |
5.3 |
5.4 |
5.4 |
Attributable Cu eq volumes, kt |
|
1,227 |
1,166 |
1,195 |
1,219 |
1,222 |
|
Volume growth |
|
|
-6.6% |
-5.0% |
2.5% |
2.0% |
0.3% |
|
|
|
|
|
|
||
Contribution to FY19E underlying EBITDA |
|
|
|
|
|
||
|
Illawarra |
|
|
|
|
|
|
Metallurgical Coal |
|
|
|
Aluminium |
|
||
Cannington |
17% |
|
|
|
|
39% |
|
6% |
|
|
|
|
|
|
|
Energy Coal South
Africa
5%
Nickel
4%
Manganese
29%
Jun-YE |
|
|
|
|
|
|
|
|
2017 |
2018 |
|
2019E |
2020E |
2021E |
|
Balance sheet |
|
|
|
|
|
|
|
Net operating assets |
|
8,027 |
7,977 |
|
9,580 |
9,507 |
9,507 |
Rehab provision net of investments |
|
568 |
691 |
|
394 |
402 |
410 |
Equity |
|
10,236 |
10,710 |
|
10,965 |
11,157 |
11,428 |
Minority interest |
|
-1 |
-1 |
|
-1 |
-1 |
-1 |
Net debt (cash) |
|
-1,640 |
-2,041 |
|
-990 |
-1,247 |
-1,510 |
Balance sheet ratios |
|
|
|
|
|
|
|
Gearing (net debt/(net debt+equity)) |
|
-19.1% |
-23.5% |
|
-9.9% |
-12.6% |
-15.2% |
Net debt to EBITDA |
|
-0.7x |
-0.8x |
|
-0.4x |
-0.5x |
-0.6x |
RoCE |
|
15.7% |
17.3% |
|
16.1% |
13.3% |
14.5% |
RoIC (after tax) |
|
15.1% |
15.5% |
|
11.7% |
10.1% |
10.9% |
RoE |
|
12.5% |
12.7% |
|
11.5% |
10.1% |
10.7% |
Cash flow statement |
|
|
|
|
|
|
|
Operating cash flow |
|
2,350 |
2,015 |
|
2,145 |
2,042 |
2,075 |
Capex (net of disposals) |
|
-316 |
-430 |
|
-667 |
-643 |
-813 |
Other cash flow |
|
162 |
-29 |
|
-1,805 |
-150 |
0 |
FCF |
|
2,196 |
1,556 |
|
-327 |
1,249 |
1,262 |
Equity shareholders' cash |
|
1,783 |
1,363 |
|
-97 |
1,177 |
1,204 |
Dividends and share buy backs |
|
-455 |
-962 |
|
-953 |
-920 |
-940 |
Excess cash |
|
1,328 |
401 |
|
-1,051 |
257 |
263 |
Cash flow ratios |
|
|
|
|
|
|
|
Working capital days |
|
38 |
46 |
|
41 |
39 |
38 |
Capex/EBITDA |
|
15.1% |
21.2% |
|
32.0% |
30.7% |
35.7% |
FCF yield |
|
26.4% |
13.7% |
|
-2.7% |
10.4% |
10.8% |
Equity shareholders' yield |
|
17.9% |
10.2% |
|
-0.7% |
8.9% |
9.1% |
Cash conversion |
|
1.6x |
1.0x |
|
-0.1x |
1.1x |
1.0x |
Capital returns/market cap |
|
4.6% |
7.2% |
|
7.2% |
7.0% |
7.1% |
Valuation |
|
|
|
|
|
|
|
Calculation of TP |
|
|
|
|
$mn |
ZAR/sh |
|
Aluminium |
|
|
|
|
7,142 |
20.6 |
|
Manganese |
|
|
|
|
1,833 |
5.3 |
|
Nickel |
|
|
|
|
673 |
1.9 |
|
Cannington |
|
|
|
|
927 |
2.7 |
|
Hermosa |
|
|
|
|
1,867 |
5.4 |
|
Energy Coal South Africa |
|
|
|
|
621 |
1.8 |
|
Illawarra Metallurgical Coal |
|
|
|
|
868 |
2.5 |
|
Corporate and other |
|
|
|
|
-2,610 |
-7.5 |
|
Enterprise value as at 27-3-2019 |
|
|
|
|
11,321 |
32.6 |
|
Investments as at 30 June 2018 |
|
|
|
|
691 |
2.0 |
|
Cash used in share buy-backs during 2019E |
|
|
|
|
-294 |
-0.8 |
|
Net cash (debt) as at 30 June 2018 |
|
|
|
|
2,041 |
5.9 |
|
Equity value as at 2-9-2016 |
|
|
|
|
13,759 |
39.6 |
|
Rounded to |
|
|
|
|
|
40.0 |
|
Share price on 26/3/2019 |
|
|
|
|
|
38.1 |
|
Expected share price return |
|
|
|
|
|
5.1% |
|
Plus: expected dividend yield |
|
|
|
|
|
6.4% |
|
Total implied one-year return |
|
|
|
|
|
11.6% |
|
Share price range, ZAR: |
|
|
|
|
|
|
|
12-month high on 4/10/2018 |
45 |
12-month low on 28/3/2018 |
29 |
||||
Price move since high |
-14.6% Price move since low |
|
32.6% |
||||
Calculation of discount rate |
|
|
|
|
|
|
|
WACC |
10.1% |
Cost of debt |
|
|
4.0% |
||
Risk-free rate |
4.0% |
Tax rate |
|
|
30% |
||
Equity risk premium |
5.0% After-tax cost of debt |
|
2.8% |
||||
Beta |
1.30 |
Debt weighting |
|
5% |
|||
Cost of equity |
10.5% |
Terminal growth rate |
|
2.0% |
|||
Valuation ratios |
|
|
|
|
|
|
|
Jun-YE |
|
2017 |
2018 |
|
2019E |
2020E |
2021E |
P/E multiple |
|
8.8x |
10.2x |
|
10.7x |
11.9x |
10.9x |
Dividend yield |
|
5.2% |
5.2% |
|
6.3% |
6.7% |
7.3% |
Capital returns/market cap |
|
4.6% |
7.2% |
|
7.2% |
7.0% |
7.1% |
EV/EBITDA |
|
3.4x |
4.5x |
|
4.8x |
5.0x |
4.6x |
P/B |
|
1.0x |
1.3x |
|
1.2x |
1.2x |
1.2x |
NAV per share, $ |
|
2.0 |
2.1 |
|
2.2 |
2.2 |
2.3 |
NAV per share, ZAR |
|
27 |
27 |
|
31 |
32 |
33 |
Source: Bloomberg, Thomson Reuters, Company data, Renaissance Capital estimates
76