

vk.com/id446425943
Investment stance
Renaissance Capital
1 April 2019
Metals & Mining
We have a neutral outlook on the metals & mining sector following strong share-price recoveries since 2016’s lows. While the mining sector still screens cheaply on near-term valuation multiples, we believe margin forecasts are approaching optimistic levels in some cases, which may not be sustainable over the long term.
Sector capex has been cut to a level that could result in supply deficits over the medium term. This could support favourable commodity prices and sector returns. We believe management teams continue to focus on value-creation through productivity, costcontainment and capital efficiency rather than volume growth, which is often valuedestructive. However, we see a risk that a cyclical slowdown in commodity demand could result in falling commodity prices.
Sector capex has been cut to a level that could result in supply deficits
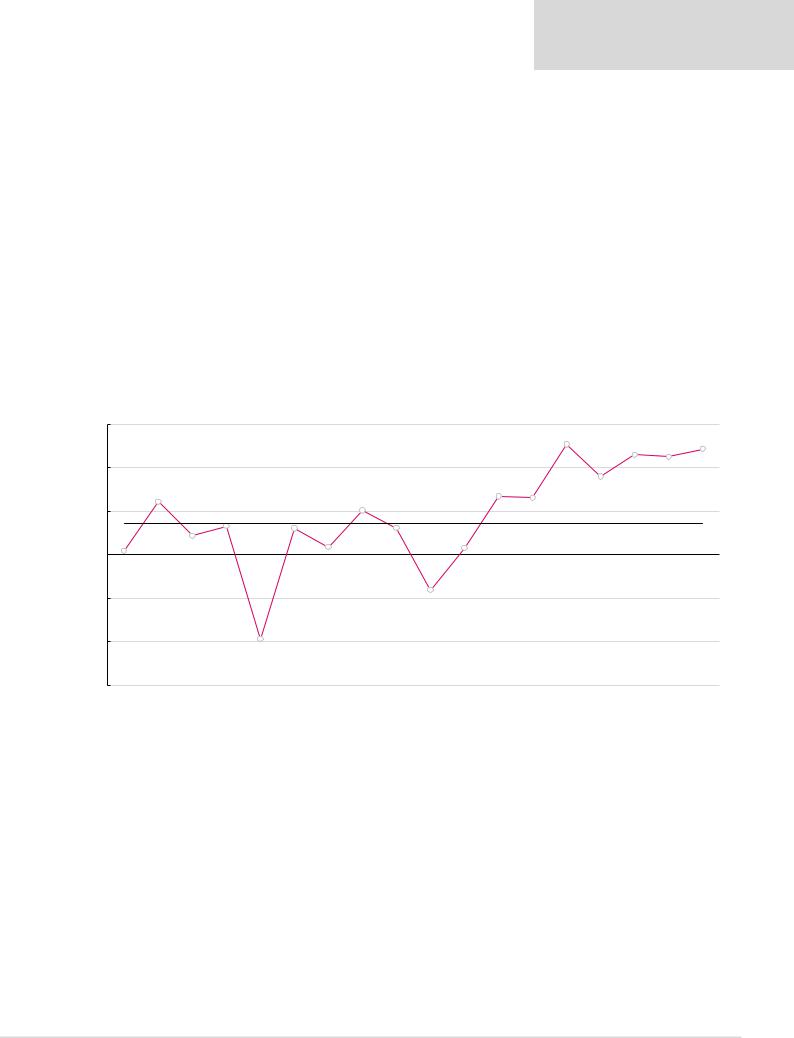
Attractive spot FCF yields
We calculate that the sector generated higher FCF yields over the past three years than anything achieved in the previous decade. Spot FCF is still at attractive levels, in our view, compared with the previous decade.
Figure 2: Market cap-weighted FCF yield*, % per calendar year ($ terms)
15% |
|
|
|
|
|
|
|
|
|
|
|
|
13% |
|
|
|
|
|
|
|
|
|
|
|
|
|
|
|
|
|
|
|
|
|
|
|
|
|
|
|
|
|
|
|
|
|
|
|
|
|
12% |
|
|
10% |
|
|
|
|
|
|
|
|
|
|
|
|
|
|
|
11% |
12% |
|
|
|
|
|
|
|
|
|
|
|
|
|
|
|
|
||
|
|
|
|
|
|
|
|
|
|
|
|
|
|
|
|
|
|
|
6% |
|
|
|
|
|
|
|
|
|
7% |
|
|
9% |
|
|
|
|
|
|
|
|
|
5% |
|
|
|
|
|
|
|
|
|
||
|
|
|
|
|
|
|
|
|
|
|
|
|
|
|
|
||
|
|
|
|
|
|
|
|
|
|
|
|
|
|
|
|
|
|
5% |
|
|
3% |
|
3% |
|
|
3% |
|
|
|
7% |
|
Average, 2003-18, 3.6% |
|
||
0% |
|
2% |
|
|
|
|
|
|
|
|
|
|
|
|
|
|
|
|
|
|
|
|
1% |
|
|
|
1% |
|
|
|
|
|
|
|
|
0% |
|
|
|
|
|
|
|
|
|
|
|
|
|
|
|
||
|
|
|
|
|
|
|
|
|
|
|
|
|
|
|
|
|
|
-5% |
|
|
|
|
|
|
|
|
-4% |
|
|
|
|
|
|
|
|
|
|
|
|
|
|
|
|
|
|
|
|
|
|
|
|
|
|
-10% |
|
|
|
|
|
|
|
|
|
|
|
|
|
|
|
|
|
|
|
|
|
-10% |
|
|
|
|
|
|
|
|
|
|
|
|
|
-15% |
|
|
|
|
|
|
|
|
|
|
|
|
|
|
|
2019E |
|
2003 |
2004 |
2005 |
2006 |
2007 |
2008 |
2009 |
2010 |
2011 |
2012 |
2013 |
2014 |
2015 |
2016 |
2017 |
2018 |
Spot |
|
Note: Priced at market close on 26 March 2019.
*FCF yield is determined using equity shareholders' cash flow.
Source: Company data, Thomson Reuters Datastream, Renaissance Capital estimates
4
vk.com/id446425943
Renaissance Capital
1 April 2019
Metals & Mining
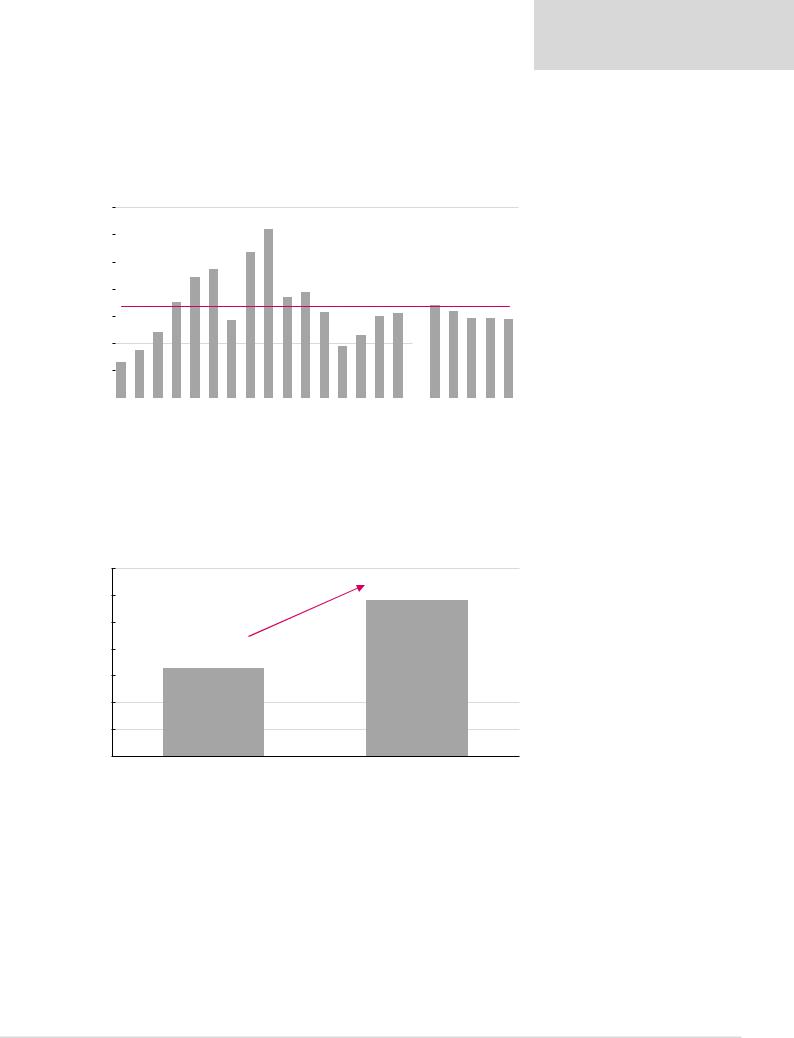
But margin outlook is approaching optimistic levels
We forecast near-term margins exceeding the average over the past 16 years, which included the commodity super-cycle. Our long-term margin forecasts are now only slightly below the average over the past 16 years.
Figure 3: EBITDA per copper equivalent unit (2019 real) for diversified miners under coverage, $/t
7,000
6,000
5,000
4,000
$/t
3,000
2,000
1,000
0
|
|
|
|
|
|
|
|
6,209 |
|
|
|
|
|
|
|
|
|
|
|
|
|
|
|
|
|
|
|
|
|
|
|
|
|
|
|
|
|
|
|
|
|
|
|
|
|
|
|
|
|
|
|
|
|
|
|
|
|
|
|
|
|
|
|
|
|
|
|
|
|
|
|
|
|
4,744 |
|
|
|
|
|
|
|
|
|
|
|
|
|
|
|
|
|
|
|
|
|
|
|
|
|
|
|
|
|
|
|
|
|
3,691 |
|
|
|
|
2,905 |
|
|
|
Average 2003-18, 3,353 |
|
|
|
|
|
|
|
|
|
|
|
|
|
|
|
|||||
|
|
|
|
|
|
|
|
|
|
|
|
|
|
|
|
|
|
|
|
|
|
|
1,320 |
|
|
|
|
|
|
|
|
|
|
|
1,889 |
|
|
|
|
|
|
|
|
|
|
|
|
|
|
|
|
|
|
|
|
|
|
|
|
|
|
|
|
|
|
|
|
|
|
|
|
|
|
|
|
|
|
|
|
|
|
|
|
|
|
|
|
|
|
|
|
|
|
|
|
|
|
|
|
|
|
|
|
|
|
|
|
|
|
|
|
|
|
|
2003 |
2004 |
2005 |
2006 |
2007 |
2008 |
2009 |
2010 |
2011 |
2012 |
2013 |
2014 |
2015 |
2016 |
2017 |
2018 |
2019E |
2020E |
2021E |
2022E |
2023E |
2024E |
|
Source: Company data, Renaissance Capital estimates
Since January 2016 we have increased our long-term margin forecasts (beyond 2023) for the mining sector by 77% on the back of the industry’s supply discipline, recovering commodity prices and a more optimistic demand outlook.
Figure 4: Increase in long-term EBITDA per copper equivalent tonne margin forecasts since January 2016
3,500
|
3,000 |
2,905 |
|
|
|
||
|
2,500 |
|
|
|
|
||
|
2,000 |
|
|
$/t |
1,645 |
||
|
|||
|
|
||
|
1,500 |
|
|
|
|
1,000
500
0
January 2016 |
Current |
Source: Renaissance Capital estimates
Our long-term margin forecasts have increased over 70% since 2016
5
vk.com/id446425943
Renaissance Capital
1 April 2019
Metals & Mining
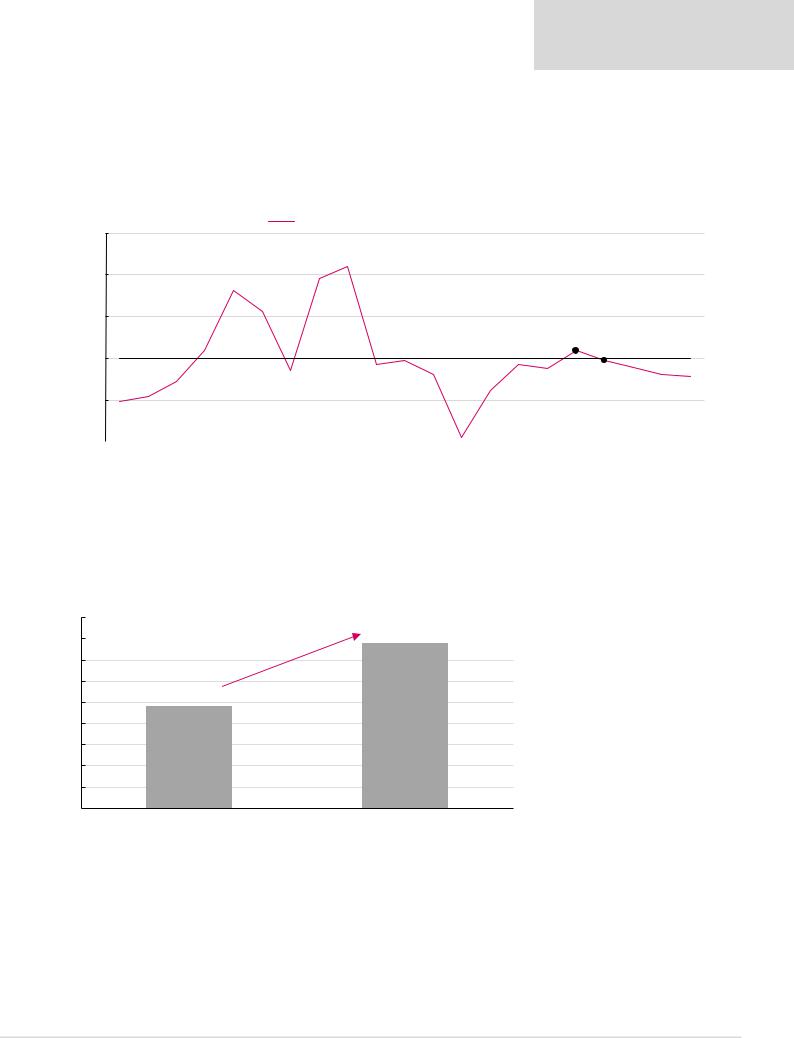
And our return forecasts are approaching levels which could incentivise new supply…
While our long-term commodity price and return forecasts are below super-cycle averages, we believe low cost producers may be incentivised to add new supply when industry average returns are around 8%.
Figure 5: Return on incremental capital (RoIC), based on assets at estimated replacement cost |
|
|
|
|
|
RoIC, based on assets at estimated replacement cost |
|
|
|
25% |
|
|
|
|
|
21.0% |
|
|
|
20% |
18.1% |
|
|
|
|
|
|
|
|
15% |
|
|
|
|
|
Estimated incentive return, 10% |
10.9% |
|
|
|
|
|
|
|
10% |
|
|
|
|
|
8.5% |
8.8% |
9.7% |
7.8% |
|
|
|
||
|
|
|
|
|
5% |
4.9% |
|
|
|
|
|
|
|
|
0% |
|
|
|
|
|
|
|
|
|
|
|
|
|
0.5% |
|
|
|
|
|
|
|
|
|
|
|
|
|
|
|
|
|
|
|
|
|
|
|
|
|
|
|
|
|
|
|
|
|
|
|
|
|
|
|
|
|
|
|
|
|
2019E |
2020E |
2021E |
2022E |
2023E |
|
2003 |
2004 |
2005 |
2006 |
2007 |
2008 |
2009 |
2010 |
2011 |
2012 |
2013 |
2014 |
2015 |
2016 |
2017 |
2018 |
||||||
Note: Chart includes Alrosa, Anglo American, ARM, Assore, BHP, Exxaro, Fortescue, Glencore, Kumba, Norilsk, Rio Tinto, South32 and Vale.
Source: Company data, Renaissance Capital estimates
Since January 2016 our long-term average sector return forecasts have increased from 4.8% to 7.8%. This was driven by an increase in our long-term commodity price and margin forecasts as discussed.
Figure 6: Increase in long-term returns at replacement cost forecasts since January 2016 |
Our long-term return forecasts have |
||
|
|
||
9% |
|
increased over 60% since 2016 |
|
7.8% |
|||
8% |
|
||
|
|
||
7%
6%
4.8%
5%
4%
3%
2%
1%
0%
January 2016 |
Current |
Source: Renaissance Capital estimates
6
vk.com/id446425943
Renaissance Capital
1 April 2019
Metals & Mining
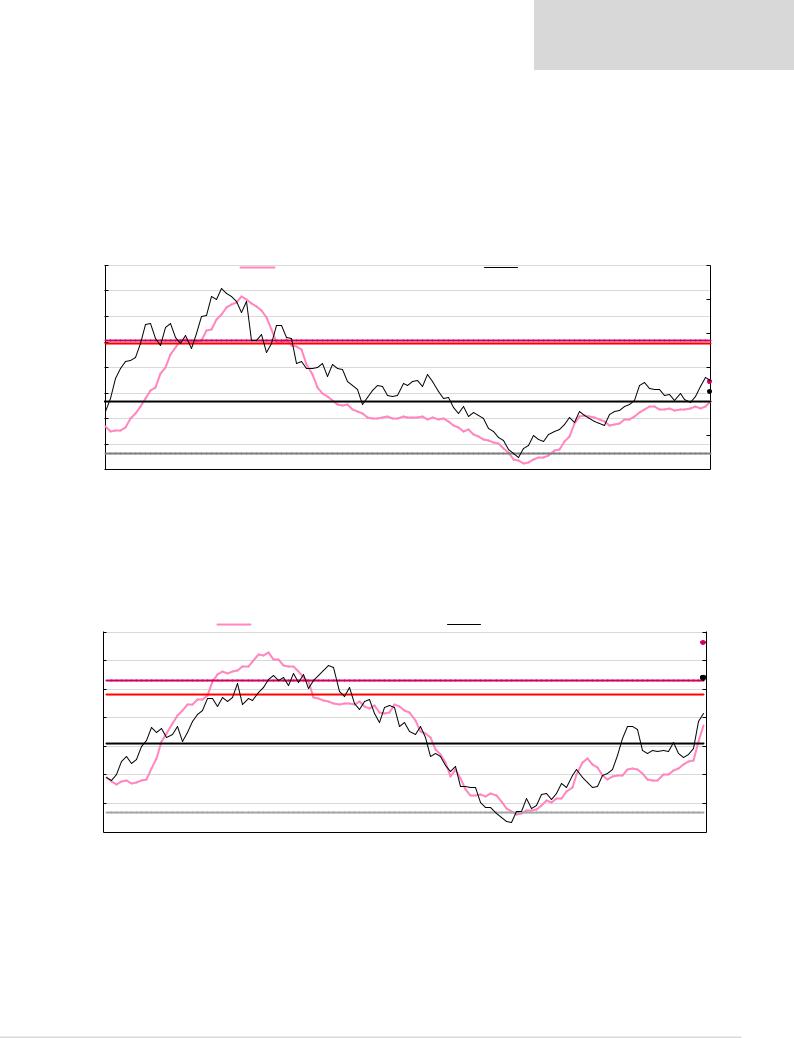
Positive earnings momentum, but earnings now above our mid-cycle estimate
Positive earnings momentum
Earnings momentum remains positive and we calculate further upside risk to consensus earnings forecasts if spot commodity prices prevail. In chart below we calculate ‘mid-cycle EPS’ using our long-term commodity price forecasts, which are around the 90th percentile of cost curves. We calculate ‘peak EPS using incentive prices’ using commodity prices which will result in a 10% IRR on greenfield projects with industry average cash costs and capital intensity.
Figure 7: Anglo American – consensus earnings momentum vs share price |
|
|
|
|
|
|
|||||
|
8 |
|
|
Forward 12M EPS |
|
|
Share price, $ (RHS) |
|
60 |
||
|
7 |
|
|
|
|
|
|
|
|
|
50 |
|
|
|
|
|
|
|
|
|
|
|
|
|
6 |
|
|
|
|
|
|
|
|
|
|
|
|
2011 reported peak EPS, 5.06 |
|
|
|
|
|
|
|
40 |
|
|
5 |
|
|
|
|
|
|
|
|
|
|
|
|
|
|
|
|
|
|
|
|
|
|
$/share |
|
Peak EPS using incentive prices, |
4.96 |
|
|
|
|
|
|
|
|
4 |
|
|
|
|
|
|
|
|
|
30 |
|
|
|
|
|
|
|
|
|
12M forward spot EPS est., 3.44 |
|
||
|
3 |
Mid cycle EPS, 2.67 |
|
|
|
|
|
|
12M forward RenCap EPS est., 3.05 |
20 |
|
|
|
|
|
|
|
|
|
|
|
|
|
|
2 |
|
|
|
|
|
|
|
|
|
|
|
1 |
|
|
|
|
|
|
|
|
|
10 |
|
2015 reported trough EPS, 0.64 |
|
|
|
|
|
|
|
|
||
|
0 |
|
|
|
|
|
|
|
|
|
0 |
|
2009 |
2010 |
2011 |
2012 |
2013 |
2014 |
2015 |
2016 |
2017 |
2018 |
2019 |
Source: Company data, Thomson Reuters Datastream, Bloomberg, Renaissance Capital
Kumba’s estimated spot EPS of ZAR66.20 implies what we view as a cheap P/E multiple of only 6.1x. However, spot earnings are well above previously reported peak levels during the super-cycle and may not be sustained over the long term.
Figure 8: Kumba Iron Ore – consensus earnings momentum vs share price
|
70 |
|
|
Forward 12M EPS |
|
|
|
Share price, ZAR (RHS) |
700 |
|
|
|
|
|
|
|
|
|
|
||
|
|
|
|
|
|
|
|
|
12M forward spot EPS est., 66.20 |
|
|
60 |
|
|
|
|
|
|
|
|
600 |
|
|
2011 reported peak EPS, 53.13 |
|
|
|
|
12M forward RenCap EPS est., 53.97 |
|||
|
50 |
|
|
|
|
|
|
|
|
500 |
ZAR/share |
|
|
|
|
|
|
Peak EPS using incentive prices, |
48.25 |
||
40 |
|
|
|
|
|
|
|
|
400 |
|
|
Mid-cycle EPS, 31.14 |
|
|
|
|
|
|
|
|
|
30 |
|
|
|
|
|
|
|
|
300 |
|
|
|
|
|
|
|
|
|
|
||
|
20 |
|
|
|
|
|
|
|
|
200 |
|
10 |
2006 reported trough EPS, 6.77 |
|
|
|
|
|
|
100 |
|
|
0 |
|
|
|
|
|
|
|
|
0 |
|
2009 |
2010 |
2011 |
2012 |
2013 |
2014 |
2015 |
2016 |
2017 |
2018 |
Source: Company data, Thomson Reuters Datastream, Bloomberg, Renaissance Capital
7

vk.com/id446425943
Renaissance Capital
1 April 2019
Metals & Mining
Diversified miners seem almost fairly valued considering midcycle earnings generation potential
Anglo American’s (as a proxy for diversified miners) P/E multiple based on mid-cycle |
|
Anglo on 1.7x P/E in 2016 |
||||||||
earnings of $2.67/share is 10.3x, which is slightly below its long-term average of 11.3x. In |
|
|
|
|||||||
January 2016 Anglo American traded at only 1.7x its normalised earnings. |
|
|
|
|
|
|||||
Figure 9: Anglo American – P/E multiple using mid-cycle EPS |
|
|
|
|
|
|
|
|||
30x |
|
|
|
|
|
|
|
|
|
|
25x |
|
22.6x |
|
|
|
|
|
|
|
|
20x |
|
|
|
|
|
|
|
|
|
|
15x |
|
|
|
|
|
|
|
|
|
|
|
|
|
|
|
|
|
10year average, 11.3x |
|
|
10.3x |
|
|
|
|
|
|
|
|
|
|
|
10x |
|
|
|
|
|
|
|
|
|
|
5x |
|
|
|
|
|
|
|
|
|
|
0x |
|
|
|
|
|
|
1.7x |
|
|
|
|
|
|
|
|
|
|
|
|
|
|
Mar 09 |
Mar 10 |
Mar 11 |
Mar 12 |
Mar 13 |
Mar 14 |
Mar 15 |
Mar 16 |
Mar 17 |
Mar 18 |
Mar 19 |
Source: Thomson Reuters DataStream, Renaissance Capital
BHP’s P/E multiple based on mid-cycle earnings of $2.00/share is 12.5x, which is also below its long-term average of 13.2x.
Figure 10: BHP – P/E multiple using mid-cycle EPS
25x |
|
|
|
|
|
|
23.1x |
|
|
|
|
|
|
|
|
|
|
|
|
21.5x |
|
|
|
|
|
|
|
|
|
|
|
|
|
|
|
|
|
|
|
|
|
|
|
|
|
|
|
20x |
|
|
|
|
|
|
|
|
|
|
18.5x |
|
|
|
|
|
|
|
|
|
|
|
|
|
|
|
|
|
|
|
|
15x |
|
|
|
|
|
|
|
|
|
|
|
|
|
|
12.5x |
|
|
|
|
|
|
|
|
|
|
|
|
|
|
|
|
|
|
|
|
|
|
|
10year average, 13.2x |
|
|
|
|
|
|
||
10x |
|
|
|
|
|
|
|
|
|
|
|
|
|
|
|
5x |
|
|
|
|
|
|
|
|
|
|
|
5.4x |
|
|
|
|
|
|
|
|
|
|
|
|
|
|
|
|
|
|
|
0x |
|
|
|
|
|
|
|
|
|
|
|
|
|
|
|
Mar-04 |
Mar-05 |
Mar-06 |
Mar-07 |
Mar-08 |
Mar-09 |
Mar-10 |
Mar-11 |
Mar-12 |
Mar-13 |
Mar-14 |
Mar-15 |
Mar-16 |
Mar-17 |
Mar-18 |
Mar-19 |
Source: Thomson Reuters DataStream, Renaissance Capital
8
vk.com/id446425943
Renaissance Capital
1 April 2019
Metals & Mining
Kumba’s P/E multiple based on its mid-cycle earnings of ZAR31.14/share is 14.4x, which looks expensive to us considering its relatively shorter remaining mine life of around 20 years. However, surprisingly it’s in line with its long-term average of 14.2x.
We believe the market may be willing to pay a premium for Kumba given its capital efficiency |
Market seems willing to pay a |
and high dividend payout ratio, which usually translates into supportive dividend yields. |
premium for Kumba |
Figure 11: Kumba Iron Ore – P/E multiple using mid-cycle EPS
30x |
|
|
|
|
|
|
|
|
|
|
|
|
|
|
|
|
|
|
|
|
|
|
|
|
|
|
|
26.1x |
|
|
|
|
|
|
|
|
|
|
|
|
|
25x |
|
|
|
|
|
|
|
|
|
|
|
|
|
|
|
|
|
|
|
|
20x |
|
|
|
|
|
|
|
|
|
|
|
|
|
|
|
|
|
|
|
|
15x |
|
|
|
|
10year average, 14.2x |
|
|
|
|
|
|
|
|
|
|
|
|
14.4x |
||
|
|
|
|
|
|
|
|
|
|
|
|
|
|
|
|
|
|
|
||
|
|
|
|
|
|
|
|
|
|
|
|
|
|
|
|
|
|
|
|
|
10x |
|
|
|
|
|
|
|
|
|
|
|
|
|
|
|
|
|
|
|
|
5x |
|
|
|
|
|
|
|
|
|
|
|
|
|
|
|
|
|
|
|
|
0x |
|
|
|
|
|
|
|
|
|
|
|
|
|
1.6x |
|
|
|
|
|
|
|
|
|
|
|
|
|
|
|
|
|
|
|
|
|
|
|
|
|
|
|
Mar-09 |
Sep-09 |
Mar-10 |
Sep-10 |
Mar-11 |
Sep-11 |
Mar-12 |
Sep-12 |
Mar-13 |
Sep-13 |
Mar-14 |
Sep-14 |
Mar-15 |
Sep-15 |
Mar-16 |
Sep-16 |
Mar-17 |
Sep-17 |
Mar-18 |
Sep-18 |
Mar-19 |
Source: Thomson Reuters, Renaissance Capital estimates
However, many miners still offer more upside if spot prices persist over the medium term
The graph below shows the potential share-price upside we calculate for mining companies relative to our NPV for the stocks if spot commodity prices hold for five years before reverting to our mid-cycle assumptions, which are lower in most cases.
Figure 12: % upside to stocks relative to our NPV if spot prices hold for five years and then revert to mid-cycle FCF generation
150% |
|
102% |
94% |
93% |
86% |
|
|
|
|
|
|
|
|
|
|
|
|
|
|
|
|
|
|
|
|
|
|
|
|
|
|
|
|
|
|
|
|
|
|
|
|||||
100% |
|
|
|
|
|
|
|
|
|
|
|
|
|
|
|
|
|
|
||||
50% |
|
|
|
|
44% |
43% |
41% |
33% |
28% |
26% |
24% |
23% |
13% |
10% |
5% |
1% |
|
|
|
|
|
|
|
|
|
|
|
|
|
|
|
|
|
|
|
|
|
|
|
|
|
|
|
|
|
0% |
|
|
|
|
|
|
|
|
|
|
|
|
|
|
|
|
|
|
|
|
|
|
-50% |
|
|
|
|
|
|
|
|
|
|
|
|
|
|
|
-5% |
-16% |
-17% |
-20% |
27%- |
36%- |
45%- |
|
|
|
|
|
|
|
|
|
|
|
|
|
|
|
|
|
|
|
|
|
|
|
-100% |
|
|
|
|
|
|
|
|
|
|
|
|
|
|
|
|
|
|
|
|
|
|
-150% |
|
|
|
|
|
|
|
|
|
|
|
|
|
|
|
|
|
|
|
|
|
|
|
|
|
|
|
|
|
|
|
|
|
|
|
|
|
|
|
|
|
|
|
|
-73%
Fortescue |
Vale |
ARM |
Sibanye |
Exxaro |
Harmony |
Norilsk |
Kumba |
Assore |
Implats |
Gold Fields |
Glencore |
Anglo |
Rio Tinto |
Polymetal |
BHP |
Polyus |
Amplats |
South32 |
AngloGold |
Northam |
RBPlats |
Alrosa |
Lonmin |
Note: Priced as at market close on 26 March 2019
Source: Company data, Thomson Reuters, Renaissance Capital estimates
9