

vk.com/id446425943
Capital cycle favours rising returns
Renaissance Capital
1 April 2019
Metals & Mining
Stretched balance sheets and poor operating cash generation from low commodity prices have forced management teams to focus on cash preservation and capital efficiency. This limited investment in new supply. Capex for the 32 companies in Figure 13 fell by around 60% from 2012-2018.
Figure 13: Resource sector capex, $mn
Mining capex has fallen by around 60% since 2012…
Capex, $mn
|
|
Anglo |
|
|
ARM |
|
|
|
Assore |
|
|
|
BHP |
|
|
South32 |
|
|
|
Exxaro |
|
|
Kumba |
|
||
|
|
|
|
|
|
|
|
|
|
|
|
|
|
|
|
|||||||||||
|
|
|
|
|
|
|
|
|
|
|
|
|
|
|
|
|||||||||||
|
|
Rio Tinto |
|
|
Fortescue |
|
|
|
Glencore |
|
|
Vale |
|
|
Amplats |
|
|
|
Impala |
|
|
Lonmin |
|
|||
|
|
|
|
|
|
|
|
|
|
|
|
|
|
|
|
|
||||||||||
|
|
|
|
|
|
|
|
|
|
|
|
|
|
|
|
|
||||||||||
|
|
Northam |
|
|
RBPlats |
|
|
|
Tharisa* |
|
|
AngloGold |
|
|
Gold Fields |
|
|
Harmony |
|
|
Polymetal |
|||||
|
|
|
|
|
|
|
|
|
|
|
|
|
|
|
||||||||||||
|
|
|
|
|
|
|
|
|
|
|
|
|
|
|
||||||||||||
|
|
Polyus |
|
|
Sibanye |
|
|
|
Merafe |
|
|
|
Codelco* |
|
|
Freeport* |
|
|
Southern Copper* |
|
Teck Resources* |
|||||
|
|
|
|
|
|
|
|
|
|
|
|
|
|
|
||||||||||||
|
|
|
|
|
|
|
|
|
|
|
|
|
|
|
||||||||||||
|
|
Norilsk |
|
|
Alrosa |
|
|
|
PhosAgro |
|
|
Acron |
|
|
|
|
|
|
|
|
|
|
|
|
||
|
|
|
|
|
|
|
|
|
|
|
|
|
|
|
|
|
|
|
|
|
||||||
|
|
|
|
|
|
|
|
|
|
|
|
|
|
|
|
|
|
|
|
|
||||||
100,000 |
|
|
|
|
|
|
|
|
|
|
|
|
|
|
|
|
|
|
|
|
|
|
|
|
||
|
|
|
|
|
|
|
|
|
|
|
|
|
|
|
|
|
|
|
|
|
|
|
|
|||
80,000 |
|
|
|
|
|
|
|
|
|
|
|
|
|
|
|
|
|
|
|
|
|
|
|
|
||
|
|
|
|
|
|
|
|
|
|
|
|
|
|
|
|
|
|
|
|
|
|
|
|
|||
60,000 |
|
|
|
|
|
|
|
|
|
|
|
|
|
|
|
|
|
|
|
|
|
|
|
|
||
|
|
|
|
|
|
|
|
|
|
|
|
|
|
|
|
|
|
|
|
|
|
|
|
|||
40,000 |
|
|
|
|
|
|
|
|
|
|
|
|
|
|
|
|
|
|
|
|
|
|
|
|
||
|
|
|
|
|
|
|
|
|
|
|
|
|
|
|
|
|
|
|
|
|
|
|
|
|||
20,000 |
|
|
|
|
|
|
|
|
|
|
|
|
|
|
|
|
|
|
|
|
|
|
|
|
||
|
|
|
|
|
|
|
|
|
|
|
|
|
|
|
|
|
|
|
|
|
|
|
|
|||
0 |
|
|
|
|
|
|
|
|
|
|
|
|
|
|
|
|
|
|
|
|
|
|
|
|
||
|
|
|
|
|
|
|
|
|
|
|
|
|
|
|
|
|
|
|
|
|
|
|
|
|||
2006 |
2007 |
2008 |
2009 |
2010 |
2011 |
2012 |
2013 |
2014 |
2015 |
2016 |
2017 |
2018 |
2019E |
|
2020E |
2021E |
||||||||||
*Not covered by Renaissance Capital; estimates based on company guidance.
|
Source: Company data, Renaissance Capital estimates |
Sector capex/depreciation, which averaged around 2.0x over the past 16 years, is still |
…and is not enough to replace |
only at around 1.3x, which is not enough to replace depleting mines, in our view. |
depleting mines |
Figure 14: Capex/depreciation ratio over time
3.5x |
|
|
|
|
|
|
|
|
|
|
|
|
|
|
|
|
|
|
|
|
|
|
|
|
|
|
|
|
3.2x |
|
|
|
|
|
|
|
|
3.0x |
|
|
|
|
|
|
|
|
|
|
|
|
|
|
|
|
|
|
|
|
|
|
|
|
2.8x |
|
|
|
|
|
|
|
|
|
|
|
|
2.5x |
|
|
|
|
|
|
|
|
|
|
|
|
|
|
|
|
|
|
|
|
2.3x |
|
|
|
|
|
|
|
|
|
|
|
Average, 2003-18, 2.0x |
|
|
||
2.0x |
|
|
|
|
|
|
|
|
|
|
|
|
|
|
|
|
|
|
1.5x |
1.5x |
|
|
|
|
|
|
|
|
|
|
|
|
|
|
1.3x |
|
|
|
|
|
|
|
|
|
|
|
|
|
|
|
1.3x |
|
|
|
|
|
1.0x |
|
|
|
|
|
|
|
|
|
|
|
|
|
|
|
|
|
1.1x |
|
|
|
|
|
|
|
|
|
|
|
|
|
|
0.9x |
|
|
|
|
|
|
|
|
|
|
|
|
|
|
|
|
|
|
|
|
|
|
|
0.5x |
|
|
|
|
|
|
|
|
|
|
|
|
|
|
|
2019E |
2020E |
2021E |
2003 |
2004 |
2005 |
2006 |
2007 |
2008 |
2009 |
2010 |
2011 |
2012 |
2013 |
2014 |
2015 |
2016 |
2017 |
2018 |
|||
Note: Chart includes Alrosa, Anglo American, Antofagasta*, ARM, Assore, BHP, Codelco*, Exxaro, Fortescue, Freeport*, Glencore, Kumba, Norilsk, Rio Tinto, South32, Southern Copper*, Teck*, Vale, Amplats, Impala, Lonmin, Northam, RB Plat, AngloGold, Gold Fields, Harmony, Polymetal, Polyus and Sibanye.
*Not covered by Renaissance Capital; estimates based on company guidance.
Source: Company data, Renaissance Capital estimates
10
vk.com/id446425943
Renaissance Capital
1 April 2019
Metals & Mining
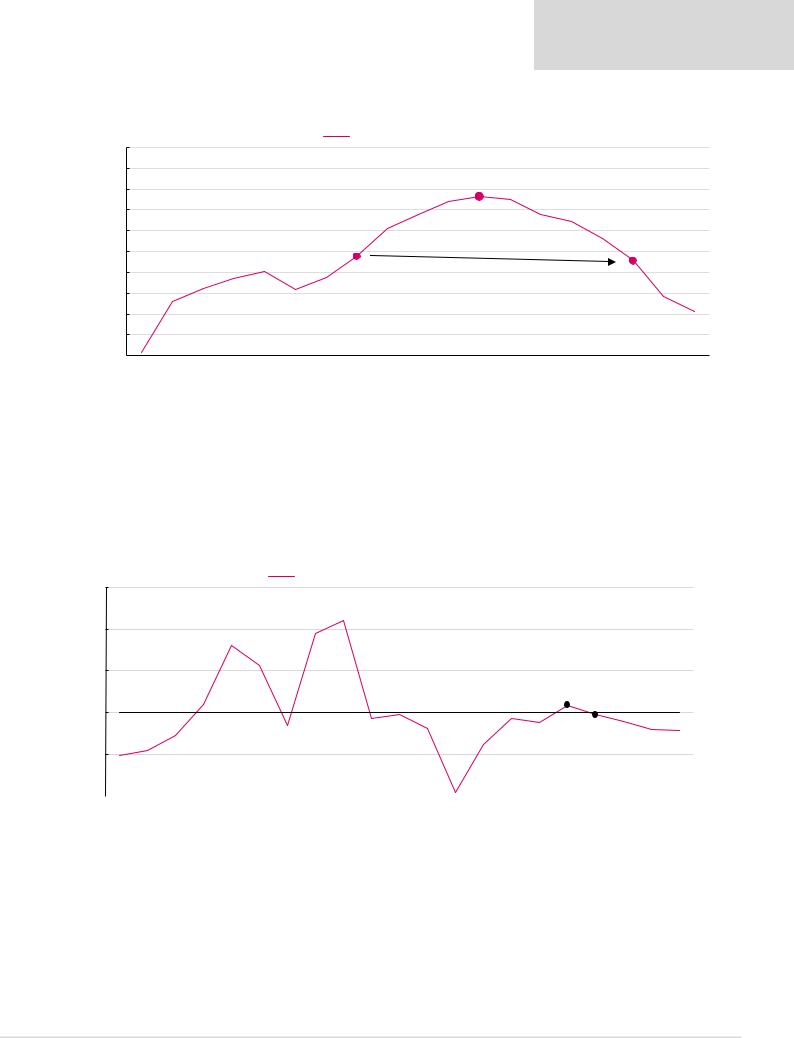
We therefore forecast mine production to decline over the next 10 years.
Figure 15: Copper equivalent production*, kt
Copper equivalent production, kt
|
50,000 |
|
|
|
|
|
|
|
|
|
|
|
|
|
|
|
|
|
|
|
49,000 |
|
|
|
|
|
|
|
|
|
|
|
|
|
|
|
|
|
|
kt |
|
|
|
|
|
|
|
|
|
|
|
2023E, 47,624 |
|
|
|
|
|
|
|
production, |
48,000 |
|
|
|
|
|
|
|
|
|
|
|
|
|
|
|
|
||
|
|
|
|
|
|
|
|
|
|
|
|
|
|
|
|
|
|
||
47,000 |
|
|
|
|
|
|
|
|
|
|
|
|
|
|
|
|
|
|
|
46,000 |
|
|
|
|
|
|
|
|
|
|
|
|
|
|
|
|
|
|
|
equivalent |
45,000 |
|
|
|
|
2019E, 44,762 |
|
|
|
|
|
|
|
|
|
|
2028E, 44,562 |
||
|
|
|
|
|
|
|
|
|
|
|
|
|
|
|
|
|
|||
44,000 |
|
|
|
|
|
|
|
|
|
|
|
|
|
|
|
|
|
|
|
|
|
|
|
|
|
|
|
|
|
|
|
|
|
|
|
|
|
|
|
Copper |
43,000 |
|
|
|
|
|
|
|
|
|
|
|
|
|
|
|
|
|
|
42,000 |
|
|
|
|
|
|
|
|
|
|
|
|
|
|
|
|
|
|
|
|
|
|
|
|
|
|
|
|
|
|
|
|
|
|
|
|
|
|
|
|
41,000 |
|
|
|
|
|
|
|
|
|
|
|
|
|
|
|
|
|
|
|
40,000 |
|
|
|
|
|
|
2019E |
2020E |
2021E |
2022E |
2023E |
2024E |
2025E |
2026E |
2027E |
2028E |
2029E |
2030E |
|
2012 |
2013 |
2014 |
2015 |
2016 |
2017 |
2018 |
||||||||||||
*All volumes converted to copper equivalent tonnes using RenCap long-term commodity price forecasts.
Source: Company data, Renaissance Capital estimates
This could underpin rising commodity prices and sector returns over the medium term. Supply disruptions and increasing regulation and scrutiny with regard to permitting are adding to supply constraints.
However, many commodity prices are no longer supported by costs and in some cases incentivise new supply. We therefore forecast declining margins over the longer term.
Figure 16: RoIC, based on assets at estimated replacement cost |
|
|
|
|
|
RoIC, based on assets at estimated replacement cost |
|
|
|
25% |
|
|
|
|
|
21.0% |
|
|
|
20% |
18.1% |
|
|
|
|
|
|
|
|
15% |
|
|
|
|
|
Estimated incentive return, 10% |
10.9% |
|
|
|
|
|
|
|
10% |
|
|
|
|
|
8.5% |
8.8% |
9.7% |
7.8% |
|
|
|
||
|
|
|
|
|
5% |
4.9% |
|
|
|
|
|
|
|
|
0% |
|
|
|
|
|
|
|
|
|
|
|
|
|
0.5% |
|
|
|
|
|
|
|
|
|
|
|
|
|
|
|
|
|
|
|
|
|
|
|
2019E |
2020E |
2021E |
2022E |
2023E |
|
2003 |
2004 |
2005 |
2006 |
2007 |
2008 |
2009 |
2010 |
2011 |
2012 |
2013 |
2014 |
2015 |
2016 |
2017 |
2018 |
||||||
Note: Chart includes Alrosa, Anglo American, ARM, Assore, BHP, Exxaro, Fortescue, Glencore, Kumba, Norilsk, Rio Tinto, South32 and Vale.
Source: Company data, Renaissance Capital estimates
11