

vk.com/id446425943
Yield potential through the cycle
Peak, trough and mid-cycle commodity prices
Renaissance Capital
1 April 2019
Metals & Mining
The mining sector remains highly cyclical and spot commodity prices will not prevail. We therefore calculate mining companies’ FCF yields, based on cash generation potential at different points in the cycle at current share prices. We calculate mining companies’ peak, trough and mid-cycle cash generation based on supply-side fundamentals.
The mining sector attracts capital during bull markets, when commodity and asset prices are elevated. New projects are approved based on return expectations that are often based on an optimistic outlook for commodity prices, capital intensity or unit costs. Once built, marginal operations do not shut when returns fail to meet the cost of capital, but only when they become cash-burning. This results in oversupplied commodity industries delivering poor returns for extended periods.
Our peak, trough and mid-cycle commodity prices are therefore based on the following assumptions:
▪Peak commodity prices – based on incentive prices where we assume that the average producer will achieve a 10% IRR on the average greenfield project.
▪Trough commodity prices – assume that around 50% of production is cashburning, resulting in capacity closures to balance oversupplied markets. We use a price that is close to industry average cash costs.
▪Mid-cycle commodity prices – we use our long-term (real) commodity price forecasts, which are based around the 90th percentile of industry cash costs and imply poor average returns below 8% on new projects, presenting capital barriers to supply growth, in our view.
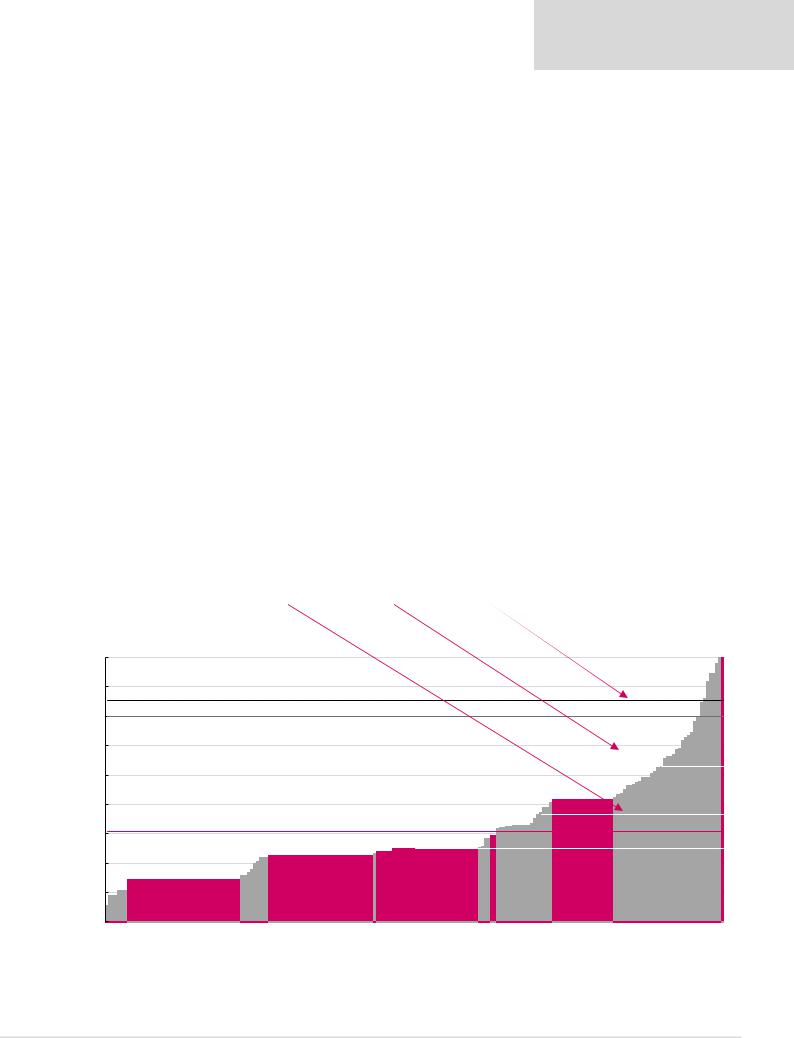
The table and chart below illustrate our peak, trough and mid-cycle iron ore price assumptions and their relation to the 2018E iron ore cost curve as an example of our methodology.
Figure 23: Peak, trough and mid-cycle iron ore price assumptions
|
Trough |
Mid-cycle |
Peak |
Iron ore, $/t |
42 |
65 |
80 |
Source: Renaissance Capital estimates
Figure 24: 2018E iron ore cash costs plus sustaining capex, quality adjusted, $/t
100 |
|
|
|
|
|
|
|
90 |
Spot price: $85/t* |
|
|
|
|
|
|
|
|
|
|
|
|
|
|
80 |
|
|
|
|
|
|
Incentive price: $80/t |
|
|
|
|
|
|
|
|
70 |
|
|
|
|
|
|
|
|
|
|
|
|
|
|
90th percentile: $63/t |
60 |
|
|
|
|
|
|
|
$/t |
|
|
|
|
|
|
|
50 |
|
|
|
|
|
52 |
70th percentile: $47/t |
|
|
|
|
|
|
|
|
40 |
|
|
|
|
|
Fortescue, |
Average cash cost: $41/t |
|
|
|
|
|
|
||
30 |
|
Rio Tinto, 33 |
Kumba , 34 |
BHP, 35 |
Assmang, 39 |
50th percentile: $35/t |
|
|
|
||||||
20 |
Vale, 25 |
|
|||||
|
|
||||||
10 |
|
|
|
|
|
|
|
*Priced as at market close on 26 March 2019.
Source: Bloomberg, CRU, Renaissance Capital estimates (in pink)
16
vk.com/id446425943
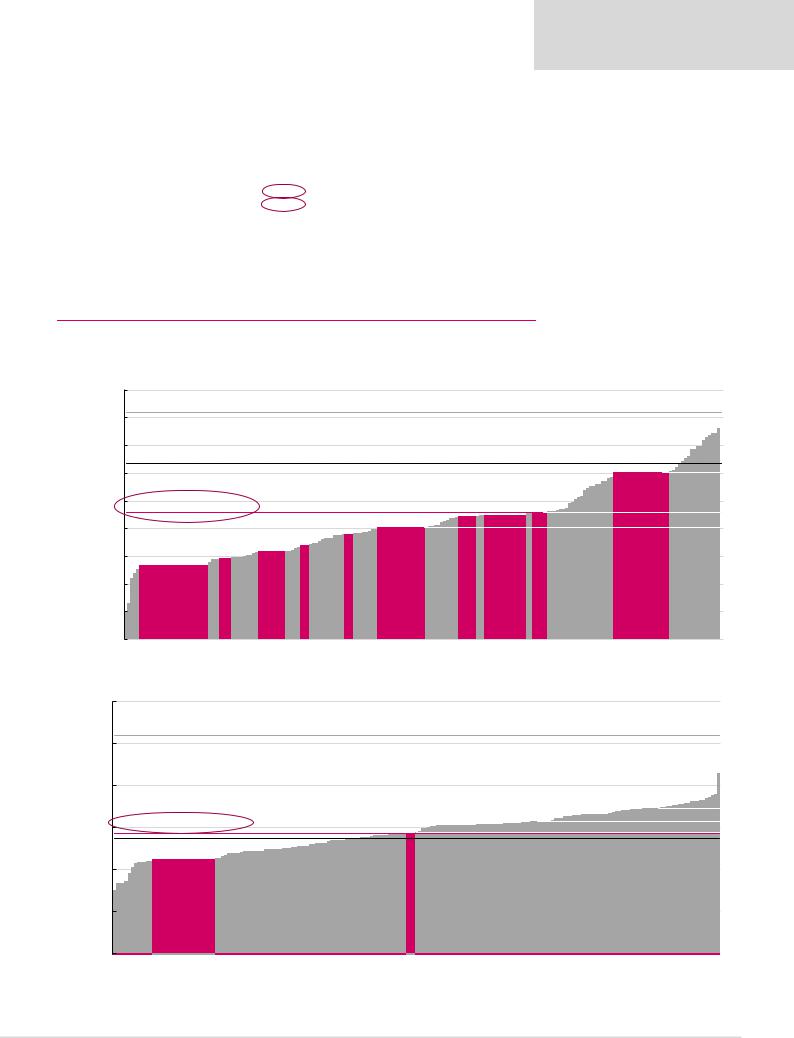
Trough commodity prices – 50% of production cash-burning
Trough commodity prices assume that around 50% of production is cash-burning, resulting in capacity closures to balance oversupplied markets. We use a price that is close to industry average cash costs or around the 50th percentile on the cost curve.
Figure 25: Commodity deck table
|
Trough |
Mid-cycle |
Peak |
3PGM, $/oz* |
800 |
1,127 |
1,400 |
Aluminium, $/t |
1,900 |
2,200 |
3,000 |
Copper, $/t |
4,500 |
6,700 |
8,200 |
Crude oil, $/bl |
43 |
60 |
80 |
Gold, $/oz |
900 |
1,250 |
1,600 |
Iron ore, $/t |
42 |
60 |
80 |
Manganese, $/mtu |
4.60 |
5.20 |
6.00 |
Metallurgical coal, $/t |
120 |
150 |
180 |
Nickel, $/t |
10,000 |
15,000 |
17,400 |
Thermal coal, $/t |
65 |
80 |
90 |
Zinc, $/t |
2,100 |
2,800 |
3,000 |
Diamonds, $/ct |
148 |
205 |
260 |
*3PGM basket price calculated using 57% Pt, 36% Pd, 7% Rh.
Source: Renaissance Capital estimates
Renaissance Capital
1 April 2019
Metals & Mining
Figure 26: 2018E copper cash costs net of by-product credits plus sustaining capex, $/t
9,000
|
|
Incentive price: $8,200/t |
|
|
|
|
|
|
|
|
|
8,000 |
|
|
|
|
|
|
|
|
|
|
7,000 |
Spot price: $6,338/t* |
|
|
|
|
|
|
|
|
|
|
|
|
|
|
|
|
|
|
|
|
6,000 |
|
|
|
|
|
|
|
|
|
$/t |
5,000 |
Average cash cost: $4,590/t |
|
|
|
|
|
|
|
|
|
2,669Freeport, |
2,936Norilsk, |
3,163Copper,Southern |
3,385Vale, |
3,804Resources,Teck |
4,029BHP, |
4,427American,Anglo |
4,484Glencore, |
4,603Tinto,Rio |
|
|
4,000 |
|||||||||
|
|
|
|
|
|
|
|
|
|
|
|
3,000 |
|
|
|
|
|
|
|
|
|
|
2,000 |
|
|
|
|
|
|
|
|
|
|
1,000 |
|
|
|
|
|
|
|
|
|
|
0 |
|
|
|
|
|
|
|
|
|
90th percentile: $6,017/t
70th percentile: $4,603/t
50th percentile: $4,029/t 6,017Codelco,
*Priced as at market close on 26 March 2019.
Source: Bloomberg, CRU, Renaissance Capital estimates (in pink)
Figure 27: 2018E aluminium cash costs net of by-product credits plus sustaining capex, $/t
3,500
|
3,000 |
Incentive price: $3,100/t |
|
|
|
2,500 |
|
|
|
$/t |
2,000 |
Average cash cost: $1,932/t |
|
|
|
|
|
||
|
|
Spot price: $1,865/t* |
1,935 |
|
|
|
|
|
|
|
1,500 |
RioTinto, 1,620 |
Rusal, 1,625 |
South32, |
|
1,000 |
|||
|
|
|
|
|
500
*Priced as at market close on 26 March 2019.
90th percentile: $2,231/t 70th percentile: $2,072/t
50th percentile: $1,939/t
Source: Bloomberg, CRU, Renaissance Capital estimates (in pink)
17
vk.com/id446425943
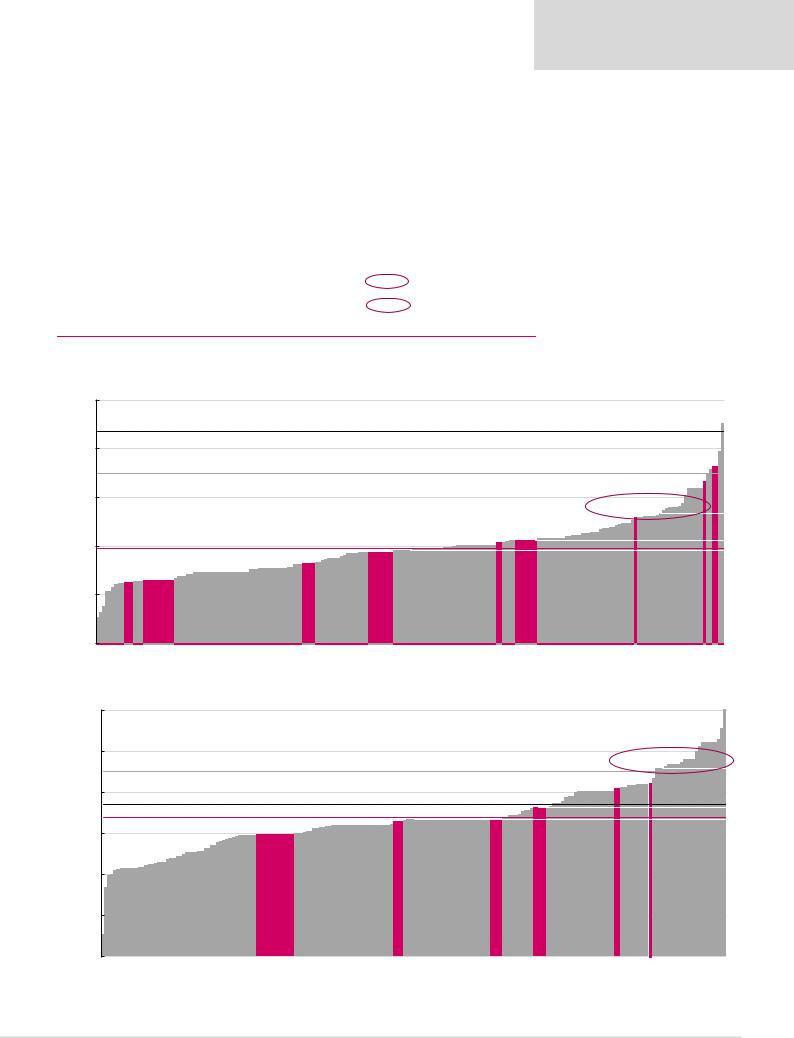
Mid-cycle commodity prices – 90th percentile on cost curve
Renaissance Capital
1 April 2019
Metals & Mining
Our mid-cycle commodity prices are based around the 90th percentile of industry cash costs and imply mediocre average returns below 9% on new projects, presenting capital barriers to supply growth, in our view. We also use these as our long-term real commodity price forecasts.
Figure 28: Commodity deck table
|
Trough |
Mid-cycle |
Peak |
3PGM, $/oz* |
800 |
1,127 |
1,400 |
Aluminium, $/t |
1,900 |
2,200 |
3,000 |
Copper, $/t |
4,500 |
6,700 |
8,200 |
Crude oil, $/bl |
43 |
60 |
80 |
Gold, $/oz |
900 |
1,250 |
1,600 |
Iron ore, $/t |
42 |
60 |
80 |
Manganese, $/mtu |
4.60 |
5.20 |
6.00 |
Metallurgical coal, $/t |
120 |
150 |
180 |
Nickel, $/t |
10,000 |
15,000 |
17,400 |
Thermal coal, $/t |
65 |
80 |
90 |
Zinc, $/t |
2,100 |
2,800 |
3,000 |
Diamonds, $/ct |
148 |
205 |
260 |
*3PGM basket price calculated using 57% Pt, 36% Pd, 7% Rh.
Source: Renaissance Capital estimates
Figure 29: 2018E metallurgical coal cash costs net of by-product credits plus sustaining capex, $/t
240
Spot price: $214/t*
200
Incentive price: $180/t
160
$/t
120 |
Average cash cost: $118/t |
|
|
|
|
|
|
|
|
Resources,Teck 115 |
Glencore,123 |
American,Anglo 125 |
|
80 |
90Mechel, |
92BHP, |
Evraz,106 |
|||
|
|
|
|
|
|
|
40 |
|
|
|
|
|
|
*Priced as at market close on 26 March 2019.
|
186 |
90th percentile: $147/t |
173 |
Vale, |
|
70th percentile: $125/t |
Severstal, |
|
|
50th percentile: $117/t |
|
South32, 143 |
|
Source: Bloomberg, CRU, Renaissance Capital estimates (in pink)
Figure 30: 2018E thermal coal cash costs net of by-product credits plus sustaining capex, $/t
120
100
Incentive price: $90/t
80Spot price: $74/t* Average cash cost: $68/t
$/t |
60 |
Glencore,60 |
66 |
|
40 |
BHP, |
|
|
|
|
|
|
20 |
|
|
0
Note: Coal consists of seaborne supply, including coastal trade in China (i.e. coal that is shipped from northern Chinese ports to southern ports). *Priced as at market close on 26 March 2019.
|
|
|
90th percentile: $92/t |
|
|
82 |
70th percentile: $72/t |
|
|
|
|
|
African Rainbow Minerals, 72 |
Exxaro, |
50th percentile: $67/t |
Anglo American, 67 |
South32, 84 |
Source: Bloomberg, CRU, Renaissance Capital estimates (in pink)
18

vk.com/id446425943
Renaissance Capital
1 April 2019
Metals & Mining
Our mid-cycle commodity price forecasts reflect their historical relationship with industry costs…
Most of our commodity price forecasts are around the 90th percentile of industry cash costs.
The charts below on the left show historical annual average commodity prices compared with the 90th percentile of cost curves over time. The charts on the right show the commodity price premium or discount to the 90th percentile.
Figure 31: Iron ore price vs cash costs at the 90th percentile |
Figure 32: Iron ore price premium relative to the 90th percentile |
|
180 |
|
|
Cash costs, $/t |
|
|
|
Iron ore average price. $/t |
80% |
|
52% |
|
55% |
63% |
|
|
|
|
|
|
|
|
|
|
|||||||||
|
|
|
|
|
175 |
|
|
|
|
|
|
|
|
|
|
60% |
|
|
|
|
|
|
|
|
|
|
|
|
|||||
|
200 |
|
|
|
|
|
|
|
|
|
|
|
|
|
|
|
|
|
|
|
|
|
|
|
|
|
|
|
|
|
|
|
|
$/t |
160 |
91 |
100 |
|
98 |
108 |
111 |
95 |
70 |
70 |
|
|
|
|
|
|
40% |
34% |
|
9% |
|
|
31% |
22% |
2% |
|
|
16% |
5% |
36% |
27% |
13% |
|
|
|
|
|
|
|
|
|
|
|
|
|
|
|
|
|
|
|
|
|
|
|
|
|
|
|
|
|
|
|
|
|
||
|
|
|
|
|
|
|
|
|
|
|
|
|
|
|
|
|
|
|
|
|
|
|
|
|
Historical average, 23% |
|
|
|
|||||
|
140 |
|
|
|
|
|
|
|
|
|
|
|
|
|
|
|
|
|
|
|
|
|
|
|
|
|
|
|
|
|
|
|
|
|
120 |
|
|
|
|
|
101 |
|
|
|
|
|
|
Forecasts |
|
20% |
|
|
|
|
|
|
|
|
|
|
|
|
|
|
|
||
|
|
|
|
|
|
|
|
|
|
|
|
|
|
|
|
|
|
|
|
|
|
|
|
|
|
|
|
|
|
|
|
|
|
|
100 |
|
|
|
|
|
|
|
|
|
|
|
|
88 |
85 |
78 |
|
0% |
|
|
|
|
|
|
|
|
|
|
|
|
|
|
|
|
|
|
|
|
|
|
|
|
|
|
|
|
|
|
|
|
|
|
|
|
|
|
|
|
|
|
|
|
|
|
|
||
|
80 |
|
|
77 |
|
|
|
|
|
|
|
71 |
66 |
|
|
|
65 |
|
|
|
|
|
|
|
|
|
|
|
|
|
|
|
|
|
|
|
|
|
|
|
|
|
|
|
|
|
|
|
|
|
|
|
|
|
|
|
|
|
|
|
|
|
|
|
|
||
|
60 |
|
|
|
|
|
|
|
|
|
|
|
|
|
|
|
-20% |
|
|
|
|
|
|
|
|
|
|
|
|
|
|
|
|
|
|
|
|
|
|
|
|
|
|
|
61 |
|
|
|
|
|
|
|
|
|
|
|
|
|
2015 -21% |
2016 -16% |
|
|
|
|
|
||
|
|
|
|
|
|
|
|
|
|
|
|
|
|
|
|
|
|
|
|
|
|
|
|
|
|
|
|
|
|
|
|||
|
40 |
2007 |
2008 |
2009 |
2010 |
2011 |
2012 |
2013 |
2014 |
2015 |
2016 |
2017 |
2018E |
2019E |
2020E |
2021E |
LT (real) |
-40% |
|
|
|
|
|
|
|
|
|
|
|
|
|
||
|
|
2007 |
2008 |
2009 |
2010 |
2011 |
2012 |
2013 |
2014 |
2017 |
2018E |
2019E |
2020E |
2021E |
|||||||||||||||||||
|
|
|
|||||||||||||||||||||||||||||||
Source: Bloomberg, Renaissance Capital estimates Source: Bloomberg, Renaissance Capital estimates
Figure 33: Copper cash price vs costs at the 90th percentile Figure 34: Copper price premium relative to the 90th percentile
|
|
|
Cash costs, $/t |
|
|
|
Copper average price, $/t |
|
70% |
58% |
|
|
|
|
|
||||||||
|
|
|
|
|
|
|
|
|
|
|
|
|
|||||||||||
$/t |
10,000 |
4,515 |
5,440 |
4,701 |
5,792 |
8,8116,323 |
7,060 |
7,009 |
6,254 |
5,958 |
5,200 |
6,1705,587 |
6,400 |
6,500 |
7,025 |
6,700 |
60% |
28% |
10% |
30% |
39% |
13% |
|
|
|
||||||||||||||||||||||
|
|
|
|
|
|
|
|
|
|
|
|
|
Forecasts |
|
50% |
|
|
|
|
|
|
||
|
9,000 |
|
|
|
|
|
|
|
|
|
|
|
|
|
|
|
|
|
|
|
|
|
|
|
8,000 |
|
|
|
|
|
|
|
|
|
|
|
|
|
|
|
40% |
|
|
|
|
|
|
|
|
|
|
|
|
|
|
|
|
|
6,532 |
|
|
|
|
|
|
|
|
|
|
|
|
|
|
|
|
|
|
|
|
|
|
|
|
|
|
|
|
30% |
|
|
|
|
|
|
|
|
|
|
|
|
|
|
|
|
|
|
|
|
|
|
|
|
|
|
|
|
|
|
|
|
7,000 |
|
|
|
|
|
|
|
|
|
|
|
|
|
|
|
20% |
|
|
|
|
|
|
|
|
|
|
|
|
|
|
|
|
|
|
|
|
|
|
|
|
|
|
|
|
|
|
|
6,000 |
|
|
|
|
|
|
|
|
|
|
|
|
|
|
|
10% |
|
|
|
|
|
|
|
|
|
|
|
|
|
|
|
|
|
|
|
|
|
|
|
|
|
|
|
|
|
|
|
5,000 |
|
|
|
|
|
|
|
|
|
|
|
|
|
|
|
0% |
|
|
|
|
|
|
|
4,000 |
|
|
|
|
|
|
|
|
|
|
|
|
|
|
|
-10% |
|
|
|
|
|
|
|
|
|
|
|
|
|
|
|
|
|
|
|
|
|
|
|
|
|
|
|
|
|
|
|
3,000 |
|
|
|
|
|
|
|
|
|
|
|
|
|
|
|
-20% |
|
|
|
|
|
|
|
2007 |
2008 |
2009 |
2010 |
2011 |
2012 |
2013 |
2014 |
2015 |
2016 |
2017 2018E |
2019E |
2020E |
2021E |
LT (real) |
-30% |
|
|
|
|
|
|
|
|
|
2007 |
2008 |
2009 |
2010 |
2011 |
2012 |
||||||||||||||||
|
|
|
|||||||||||||||||||||
|
|
|
|
|
|
|
|
|
Source: Bloomberg, Renaissance Capital estimates |
|
|
|
|
|
|
|
|||||||
Historical average, 17% |
|
|
|
|
||
5% |
10% |
10% |
9% |
3% |
2% |
7% |
|
|
-7% |
-6% |
|
|
|
|
|
2013 |
2014 |
2015 |
2016 |
2017 |
2018E |
2019E |
2020E |
2021E |
Source: Bloomberg, Renaissance Capital estimates
19
vk.com/id446425943
Renaissance Capital
1 April 2019
Metals & Mining
…and should not incentivise oversupply
Our long-term commodity prices are determined with reference to industry cost support rather than incentive price levels. We use the 90th percentile on cost curves as a reference point for our long-term commodity prices.
Figures 35 and 36 show that at our long-term commodity price and margin forecasts, which are below spot levels in many cases, new greenfield project returns will fall short of WACC, on average.
Our commodity price forecasts over the medium term are well below incentive price levels and could lead to several years of under-investment.
Figure 35: Expected average returns on new greenfield projects
|
Zinc, |
Iron ore, |
PGMs, |
Nickel, |
Met coal, |
Copper, |
Thermal |
Gold, |
Potash, |
Diamonds, |
Pigment, |
Manganese, Aluminium, |
|
|
$/t |
$/t |
$/oz |
$/t |
$/t |
$/t |
coal, $/t |
$/oz |
$/t |
$/ct |
$/t |
$/mtu |
$/t |
Capital intensity* |
5,000 |
170 |
3,000 |
45,000 |
300 |
20,000 |
120 |
3,500 |
900 |
550 |
8,000 |
7.00 |
6,000 |
Long-term prices |
2,800 |
65 |
1,127 |
15,000 |
|
Average unit cash cost |
-1,518 |
-36 |
-712 |
-8,206 |
|
Average EBITDA per unit |
1,282 |
29 |
415 |
6,794 |
|
EBITDA margin |
46% |
45% |
37% |
45% |
|
Maintenance capex |
-551 |
-5 |
-80 |
-2,000 |
|
Tax @ 30% |
-219 |
-7 |
-100 |
-1,438 |
|
Net profit |
511 |
17 |
234 |
3,356 |
|
|
|
|
|
|
|
Annual returns on |
|
|
|
|
|
10.2% |
9.9% |
7.8% |
7.5% |
||
commissioned projects |
|||||
|
|
|
|
||
Estimated IRR (construction |
8.2% |
8.0% |
6.3% |
6.0% |
|
time and limited life) |
|||||
|
|
|
|
||
|
|
|
|
|
|
Implied incentive price |
3,000 |
80 |
1,400 |
18,300 |
|
@10% IRR |
|||||
|
|
|
|
*Cost of new greenfield project in dollars per annual production unit.
Figure 36: Expected average IRRs on new greenfield projects
|
10% |
|
|
|
|
|
|
|
|
|
|
|
|
|
|
|
9% |
|
8.2% |
|
|
|
|
|
|
|
8.0% |
|
|
|
|
|
|
|
|
|
|
|
|
|
8% |
|
|
|
|
|
|
% |
|
|
|
|
|
|
|
return, |
7% |
|
|
|
6.3% |
|
|
|
|
|
|
6.0% |
5.9% |
||
|
|
|
|
|
|||
|
|
|
|
|
|
||
rate of |
6% |
|
|
|
|
|
|
5% |
|
|
|
|
|
|
|
Internal |
|
|
|
|
|
|
|
4% |
|
|
|
|
|
|
|
|
|
|
|
|
|
|
|
|
3% |
|
|
|
|
|
|
|
2% |
|
|
|
|
|
|
|
1% |
|
|
|
|
|
|
|
0% |
|
Zinc |
Iron ore |
PGMs |
Nickel |
Met coal |
|
|
||||||
|
|
|
150 |
6,700 |
80 |
1,250 |
270 |
205 |
3,000 |
5.20 |
2,200 |
-109 |
-3,488 |
-63 |
-667 |
-150 |
-142 |
-2,200 |
-4.49 |
-1,712 |
41 |
3,212 |
17 |
583 |
120 |
63 |
800 |
0.71 |
488 |
27% |
48% |
22% |
47% |
44% |
31% |
0 |
0.14 |
22% |
-9 |
-1,102 |
-5 |
-227 |
-36 |
-16 |
-240 |
-0.30 |
-220 |
-10 |
-633 |
-4 |
-107 |
-25 |
-14 |
-168 |
-0.12 |
-80 |
22 |
1,477 |
9 |
249 |
59 |
33 |
392 |
0.29 |
188 |
|
|
|
|
|
|
|
|
|
|
|
|
|
|
|
|
|
|
7.4% |
7.4% |
7.2% |
7.1% |
6.5% |
6.0% |
4.9% |
0.04 |
3.1% |
|
|
|
|
|
|
|
|
|
5.9% |
5.9% |
5.8% |
5.7% |
5.2% |
4.8% |
3.9% |
0.03 |
2.5% |
|
|
|
|
|
|
|
|
|
|
|
|
|
|
|
|
|
|
180 |
8,200 |
90 |
1,600 |
350 |
260 |
3,900 |
6.00 |
3,100 |
Source Renaissance Capital estimates
WACC, 9%
5.9% 5.8% 5.7%
5.2% 5.2%
4.8%
3.9%
3.3%
2.5%
Copper |
Thermal coal |
Gold |
Potash |
Average |
Diamonds |
Pigment |
Manganese |
Aluminium |
Source: Renaissance Capital estimates
20
vk.com/id446425943
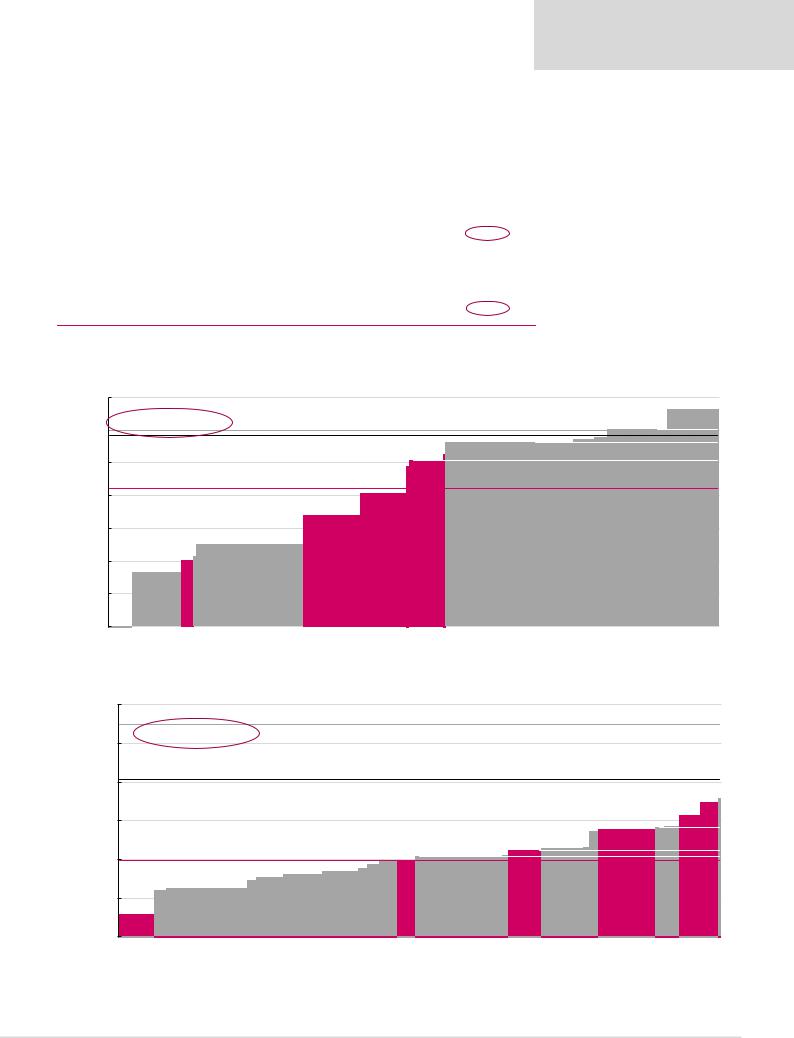
Peak cycle commodity prices – incentive pricing levels for 10% IRR on average greenfield projects
Our peak commodity prices are based on incentive prices, where we assume that the average producer will achieve a 10% IRR on a greenfield project with average capital intensity (see table on previous page).
Figure 37: Commodity deck table
|
Trough |
Mid-cycle |
Peak |
3PGM, $/oz* |
800 |
1,127 |
1,400 |
Aluminium, $/t |
1,900 |
2,200 |
3,000 |
Copper, $/t |
4,500 |
6,700 |
8,200 |
Crude Oil, $/bl |
43 |
60 |
80 |
Gold, $/oz |
900 |
1,250 |
1,600 |
Iron ore, $/t |
42 |
60 |
80 |
Manganese, $/mtu |
4.60 |
5.20 |
6.00 |
Metallurgical coal, $/t |
120 |
150 |
180 |
Nickel, $/t |
10,000 |
15,000 |
17,400 |
Thermal coal, $/t |
65 |
80 |
90 |
Zinc, $/t |
2,100 |
2,800 |
3,000 |
Diamonds, $/ct |
148 |
205 |
260 |
*3PGM basket price calculated using 57% Pt, 36% Pd, 7% Rh.
Source: Renaissance Capital estimates
Figure 38: 2017 zinc cash cost plus sustaining capex, $/t
3,500 |
|
|
|
|
|
|
|
3,000 |
Incentive price: $3,000/t |
|
|
|
|
|
|
|
|
|
|
|
|
|
|
|
Spot price: $2,920/t* |
|
|
|
|
Nyrstar,2,805 |
|
2,500 |
|
|
|
|
|
(SCCO),unitIMMSAMexican2,430 (TECK),MineTrail2,541 (TECK),MineOreillePend2,616 |
|
|
Average cash cost: $2,116/t |
1,253(Vedanta),Hindustan |
1,705(TECK),MineDogRed |
2,039(GLEN),Australia |
|||
2,000 |
828Boliden, |
North |
|||||
|
|
|
|
|
|
|
|
$/t |
|
1,011 |
|
|
|
|
|
1,500 |
|
(GLEN), |
|
|
|
|
|
1,000 |
|
|
|
|
|
|
|
|
America |
|
|
|
|
|
|
|
|
|
|
|
|
|
|
|
|
1,079 |
|
|
|
|
|
500 |
|
Griffin, |
|
|
|
|
|
|
|
|
|
|
|
|
|
0 |
|
|
|
|
|
|
|
* Priced as at market close on 26 March 2019, |
|
|
|
|
|
||
Figure 39: 2017 gold all-in sustaining costs net of by-products, $/oz |
|
|
|
||||
1,700 |
|
|
|
|
|
|
|
|
Incentive price: $1,600/oz |
|
|
|
|
||
1,500 |
|
|
|
|
|
|
|
|
Spot price: $1,315/oz* |
|
|
|
|
|
|
1,300 |
|
|
|
|
|
|
|
$/oz |
|
|
|
|
|
|
|
1,100 |
|
|
|
|
|
|
|
900 |
Average all-in sustaining costs: $894/oz |
|
|
|
Fields, 944 |
||
|
|
|
|
|
|
||
700 |
614 |
|
|
|
|
|
|
|
Polyus, |
|
|
|
|
|
Gold |
500 |
|
|
|
|
|
|
|
*Priced as at market close on 26 March 2019.
Renaissance Capital
1 April 2019
Metals & Mining
90th percentile: $3,017/t |
Estimated top, 3,318 |
|
Noranda, 2,864 Manitoba, 2,889 |
Votorantim, 3,017 |
|
Source: Bloomberg, Renaissance Capital estimates
90th percentile: $1,064/oz |
Sibanye, 1,129 |
Harmony,1195 |
AngloGold, 1,055 |
Source: Bloomberg, Renaissance Capital estimates
21