

- •Contents
- •Revisions to our forecasts, TPs and ratings
- •Investment stance
- •Capital cycle favours rising returns
- •Comfortable balance sheets and supportive dividend potential
- •Value relative to other stocks
- •Yield potential through the cycle
- •Mid-cycle cash generation offers supportive yields
- •Where to hide if you are bearish
- •What to buy if you are bullish
- •Limited lives weighing down IRR
- •Yields should compensate for limited lives
- •Positive earnings momentum continues to support share prices
- •Commodity price revisions
- •Commodity section
- •Commodity section
- •Preference for base metals over steelmaking materials
- •Earnings revisions
- •Risks and catalysts
- •Peer comp charts
- •Commodity price and exchange rate forecasts
- •Important publications
- •African Rainbow Minerals
- •Alrosa
- •Anglo American
- •Assore
- •Exxaro
- •Glencore
- •Kumba Iron ore
- •NorNickel
- •Rio Tinto
- •Rusal
- •Vale
- •Gold Fields
- •Harmony
- •Polymetal
- •Anglo American Platinum
- •Lonmin
- •Northam
- •Royal Bafokeng Platinum
- •Sasol
- •Disclosures appendix
vk.com/id446425943
Rio Tinto – BUY
Renaissance Capital
1 April 2019
Metals & Mining
Figure 120: Rio Tinto, $mn (unless otherwise noted)
|
|
|
|
Rio Tinto |
RIO.LN |
Target price, GBP: |
50.0 |
Market capitalisation, $mn: |
96,223 |
Share price, GBP: |
43.1 |
Enterprise value, $mn: |
105,084 |
Potential 12-month return: |
24.2% |
Dec-YE |
2017 |
2018 |
2019E |
2020E |
2021E |
Income statement |
|
|
|
|
|
Revenue |
41,857 |
42,835 |
48,774 |
50,163 |
48,787 |
Underlying EBITDA |
18,580 |
18,136 |
23,545 |
22,514 |
21,149 |
Underlying EBIT |
13,558 |
13,471 |
18,756 |
17,632 |
16,396 |
EBIT |
14,474 |
18,200 |
18,552 |
17,393 |
16,132 |
Finance items |
-1,658 |
-33 |
-724 |
-641 |
-600 |
Taxation |
-3,965 |
-4,242 |
-5,494 |
-5,045 |
-4,644 |
Minority interest in profit |
-89 |
-287 |
-758 |
-714 |
-666 |
Net profit for the year |
8,762 |
13,638 |
11,575 |
10,993 |
10,221 |
Underlying earnings |
8,627 |
8,808 |
11,575 |
10,993 |
10,221 |
Underlying EPS, USc |
483 |
512 |
682 |
651 |
605 |
Thomson Reuters consensus EPS, USc |
|
|
568 |
498 |
482 |
DPS declared, USc |
290 |
550 |
477 |
456 |
424 |
Underlying EBIT |
10,488 |
10,075 |
16,300 |
14,495 |
12,593 |
Iron ore |
|||||
EBIT margin |
52% |
50% |
61% |
56% |
53% |
Copper |
297 |
1,276 |
1,325 |
1,466 |
1,820 |
EBIT margin |
4% |
15% |
15% |
15% |
17% |
Energy |
1,049 |
873 |
8 |
-2 |
-4 |
EBIT margin |
32% |
62% |
3% |
-7% |
-47% |
Aluminium |
2,224 |
1,973 |
1,698 |
2,219 |
2,596 |
EBIT margin |
20% |
16% |
14% |
16% |
18% |
Minerals |
489 |
413 |
452 |
574 |
598 |
EBIT margin |
18% |
15% |
15% |
17% |
17% |
Other operations |
-989 |
-1,139 |
-1,028 |
-1,120 |
-1,206 |
Underlying EBIT |
13,558 |
13,471 |
18,756 |
17,632 |
16,396 |
Income statement ratios |
|
|
|
|
|
EBITDA margin |
44% |
42% |
48% |
45% |
43% |
EBIT margin |
32% |
31% |
38% |
35% |
34% |
EPS growth |
70% |
6% |
33% |
-5% |
-7% |
Dividend payout ratio |
60% |
107% |
70% |
70% |
70% |
Input assumptions |
|
|
|
|
|
Iron ore fines (62%Fe, CIF China) $/t |
71 |
66 |
88 |
85 |
78 |
Copper, USc/lb |
280 |
296 |
290 |
295 |
319 |
Coking coal, $/t |
188 |
206 |
187 |
170 |
165 |
Aluminium, $/t |
1,968 |
2,110 |
1,950 |
2,200 |
2,307 |
$/AUD |
0.77 |
0.75 |
0.73 |
0.78 |
0.80 |
Required breakeven prices |
|
|
|
|
|
Iron ore, $/t |
33 |
32 |
35 |
38 |
37 |
Copper, USc/lb |
244 |
209 |
198 |
193 |
201 |
Aluminium, $/t |
1,430 |
1,620 |
1,553 |
1,691 |
1,740 |
Sales volumes (RIO's share) |
|
|
|
|
|
Iron ore, mnt |
282 |
291 |
301 |
302 |
302 |
Copper, kt |
455 |
624 |
585 |
639 |
652 |
Aluminium, kt |
3,552 |
3,459 |
3,438 |
3,476 |
3,476 |
Attributable Cu eq volumes, kt |
5,539 |
5,780 |
5,880 |
5,957 |
5,898 |
Volume growth |
-0.2% |
4.4% |
1.7% |
1.3% |
-1.0% |
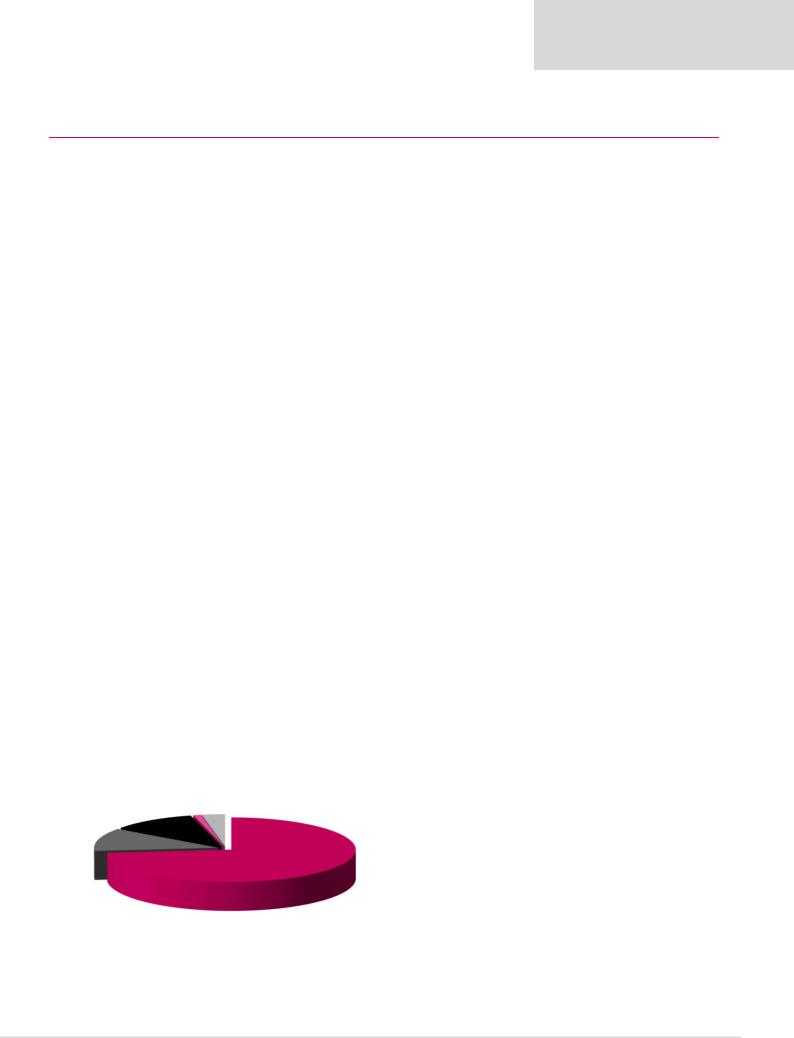
Contribution to FY19E attributable underlying EBITDA
Dec-YE |
|
|
2019E |
2020E |
2021E |
2017 |
2018 |
||||
Balance sheet |
|
|
|
|
|
Net operating assets |
55,023 |
49,464 |
51,518 |
52,768 |
55,247 |
Investments |
-63 |
103 |
103 |
103 |
103 |
Equity |
44,711 |
43,686 |
42,481 |
45,278 |
48,014 |
Minority interest |
6,404 |
6,137 |
6,289 |
6,431 |
6,565 |
Net debt |
3,845 |
-256 |
2,851 |
1,162 |
772 |
Balance sheet ratios |
|
|
|
|
|
Gearing (net debt/(net debt+equity)) |
7.9% |
-0.6% |
6.3% |
2.5% |
1.6% |
Net debt to EBITDA |
0.2x |
0.0x |
0.1x |
0.1x |
0.0x |
RoCE |
19.7% |
20.2% |
29.0% |
26.4% |
24.0% |
RoIC (after tax) |
17.6% |
12.4% |
19.5% |
18.8% |
15.7% |
RoE |
20.9% |
30.9% |
26.9% |
25.1% |
21.9% |
Cash flow statement |
|
|
|
|
|
Operating cash flow |
17,003 |
12,935 |
16,991 |
17,644 |
15,593 |
Capex |
-4,761 |
-5,344 |
-6,000 |
-6,500 |
-6,500 |
Other |
-443 |
7,474 |
-204 |
-239 |
-264 |
FCF |
11,799 |
15,065 |
10,787 |
10,905 |
8,829 |
Equity shareholders' cash |
12,075 |
14,843 |
9,673 |
9,885 |
7,876 |
Dividends and share buy backs |
-6,333 |
-10,742 |
-12,781 |
-8,196 |
-7,486 |
Surplus (deficit) cash |
5,742 |
4,101 |
-3,107 |
1,690 |
390 |
Cash flow ratios |
|
|
|
|
|
Working capital days |
8 |
8 |
10 |
8 |
8 |
Cash conversion |
1.4x |
1.7x |
0.8x |
0.9x |
0.8x |
FCF yield |
13.2% |
15.6% |
10.1% |
10.4% |
8.5% |
Equity shareholders' yield |
15.3% |
16.4% |
9.9% |
10.2% |
8.1% |
Capex/EBITDA |
25.6% |
29.5% |
25.5% |
28.9% |
30.7% |
Valuation |
|
|
|
|
|
SoTP DCF valuation and calculation of target price |
|
$mn |
GBP/sh |
||
Iron ore |
|
|
|
98,762 |
44.3 |
Energy |
|
|
|
37 |
0.0 |
Aluminium |
|
|
|
21,031 |
9.4 |
Copper |
|
|
|
15,502 |
6.9 |
Diamonds |
|
|
|
21 |
0.0 |
Minerals |
|
|
|
4,588 |
2.1 |
Exploration and other |
|
|
|
-17,189 |
-7.7 |
Total enterprise value |
|
|
|
122,753 |
55.0 |
Net debt as at 31 December 2018 |
|
|
|
256 |
0.1 |
Cash used in share buy-backs |
|
|
|
-1,700 |
-0.8 |
Other investments |
|
|
|
103 |
0.0 |
Minority interest |
|
|
|
-9,117 |
-4.1 |
Equity value as at 27/3/2019 |
|
|
|
112,295 |
50.3 |
Rounded to |
|
|
|
|
50.0 |
Share price on 26/3/2019 |
|
|
|
|
43.1 |
Expected share price return |
|
|
|
|
15.9% |
Plus: expected dividend yield |
|
|
|
|
8.3% |
Total implied one-year return |
|
|
|
|
24.2% |
Share price range, GBP: |
|
|
|
|
|
12-month high on 7/6/2018 |
43.5 |
12-month low on 11/9/2018 |
33.2 |
||
Price move since high |
-1.0% |
Price move since low |
|
30.0% |
|
|
Diamonds |
Minerals |
Calculation of discount rate |
|
|
|
|
|
|
Copper |
3% |
WACC |
9.2% |
Cost of debt |
|
|
4.5% |
||
1% |
|
|
|||||||
11% |
|
Risk-free rate |
4.0% |
Tax rate |
|
|
30% |
||
|
|
|
|
||||||
|
|
|
Equity risk premium |
5.0% After-tax cost of debt |
|
3.2% |
|||
|
|
|
Beta |
1.25 |
Debt weighting |
|
15% |
||
Aluminium |
|
|
Cost of equity |
10.3% |
Terminal growth rate |
|
3.5% |
||
12% |
|
|
Valuation ratios |
|
|
|
|
|
|
|
|
|
|
|
|
|
|
|
|
|
|
|
Dec-YE |
2017 |
2018 |
|
2019E |
2020E |
2021E |
|
|
|
P/E multiple |
9.1x |
10.2x |
|
8.4x |
8.7x |
9.4x |
|
|
Iron ore |
Dividend yield |
6.6% |
10.6% |
|
8.4% |
8.0% |
7.4% |
|
|
EV/EBITDA |
4.8x |
5.3x |
|
4.5x |
4.6x |
4.9x |
|
|
|
73% |
P/B |
1.8x |
2.1x |
|
2.3x |
2.1x |
2.0x |
|
|
|
NAV per share, $ |
24.9 |
25.2 |
|
24.9 |
26.6 |
28.2 |
|
|
|
NAV per share, GBP |
19.3 |
18.8 |
|
19.0 |
20.1 |
21.3 |
Source: Bloomberg, Thomson Reuters, Company data, Renaissance Capital estimates
74