


vk.com/id446425943
Positive earnings momentum continues to support share prices
Renaissance Capital
1 April 2019
Metals & Mining
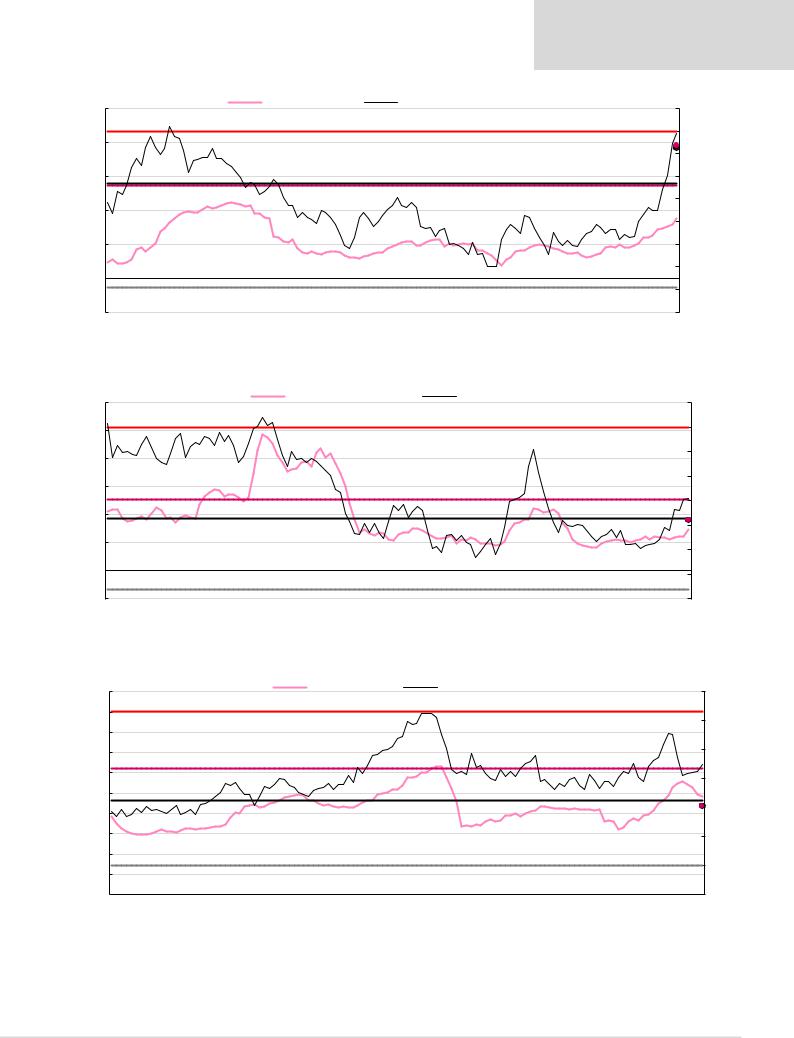
Figures 48-54 show companies’ one-year forward consensus earnings over time relative to share-price performance. They also show: 1) peak reported earnings; 2) trough reported earnings; 3) our estimate of mid-cycle earnings by 2021; 4) our one-year forward earnings estimate; and 5) spot earnings.
We calculate ‘mid-cycle EPS’ using our long-term commodity price forecasts, which are around the 90th percentile of cost curves. We calculate ‘peak EPS using incentive prices’ using commodity prices which will result in a 10% IRR on greenfield projects with industry average cash costs and capital intensity.
ARM’s estimated spot EPS of ZAR42.85 is significantly above its previously reported peak earnings of ZAR25.76 and is even above earnings calculated using incentive prices for all its commodities.
Figure 48: African Rainbow Minerals – consensus earnings momentum vs share price
|
45 |
|
|
Forward 12M EPS |
|
Share price, ZAR (RHS) |
|
250 |
|||
|
|
|
|
|
|
|
|
|
12M forward spot EPS est., 42.85 |
|
|
|
40 |
|
|
|
|
|
|
|
|
|
|
|
35 |
|
|
|
|
|
|
|
12M forward RenCap EPS est., 36.09 |
200 |
|
|
Peak EPS using incentive prices, |
31.89 |
|
|
|
|
|
|
|
||
|
|
|
|
|
|
|
|
|
|||
|
30 |
|
|
|
|
|
|
|
|
|
|
ZAR/share |
25 |
Mid-cycle EPS, 24.84 |
|
|
|
|
|
|
|
|
150 |
|
|
|
|
|
|
|
|
|
|||
|
|
|
|
|
|
|
|
|
|
||
|
2008 reported peak EPS, 25.76 |
|
|
|
|
|
|
|
|
||
20 |
|
|
|
|
|
|
|
|
|
100 |
|
|
|
|
|
|
|
|
|
|
|
||
|
|
|
|
|
|
|
|
|
|
|
|
|
15 |
|
|
|
|
|
|
|
|
|
|
|
10 |
|
|
|
|
|
|
|
|
|
50 |
|
|
|
|
|
|
|
|
|
|
|
|
|
5 |
2009 reported trough EPS, 2.53 |
|
|
|
|
|
|
|
|
|
|
|
|
|
|
|
|
|
|
|
||
|
0 |
|
|
|
|
|
|
|
|
|
0 |
|
2009 |
2010 |
2011 |
2012 |
2013 |
2014 |
2015 |
2016 |
2017 |
2018 |
2019 |
Source: Company data, Thomson Reuters Datastream, Bloomberg, Renaissance Capital
BHP’s estimated spot EPS is between mid-cycle and peak levels. Given supply disruptions in iron ore, we believe this level may be sustainable over the medium term.
Figure 49: BHP – consensus earnings momentum vs share price |
|
|
|
|
|
|
|
|
||||
|
|
|
|
Forward 12M EPS |
|
|
|
Share price, $ (RHS) |
|
|
|
|
|
6 |
|
|
|
|
|
|
|
|
|
|
45 |
|
|
|
|
|
|
|
|
|
|
|
|
40 |
|
5 |
|
|
|
|
|
|
|
|
|
|
|
|
|
|
|
|
|
|
|
|
|
|
|
35 |
$/share |
4 |
|
|
|
|
|
|
|
|
|
|
30 |
|
2011 reported peak EPS, 3.43 |
|
|
|
|
|
|
|
|
25 |
||
|
|
|
|
|
|
|
|
|
|
|
||
|
3 |
Peak EPS using incentive prices, |
3.34 |
|
|
|
|
|
|
|
|
|
|
|
|
|
|
|
|
|
|
12M forward spot EPS est., |
2.56 |
20 |
|
|
|
|
|
|
|
|
|
|
|
|||
|
2 |
Mid-cycle EPS, 2.00 |
|
|
|
|
|
|
12M forward RenCap EPS est., 2.22 |
15 |
||
|
|
|
|
|
|
|
|
|||||
|
|
|
|
|
|
|
|
|
|
|
||
|
|
|
|
|
|
|
|
|
|
|
|
10 |
|
1 |
|
|
|
|
|
|
|
|
|
|
|
|
2015 reported trough EPS, 0.35 |
|
|
|
|
|
|
|
|
5 |
||
|
|
|
|
|
|
|
|
|
|
|||
|
0 |
|
|
|
|
|
|
|
|
|
|
0 |
|
2009 |
2010 |
2011 |
2012 |
2013 |
2014 |
2015 |
2016 |
2017 |
2018 |
|
2019 |
Source: Company data, Thomson Reuters Datastream, Bloomberg, Renaissance Capital
27

vk.com/id446425943
Renaissance Capital
1 April 2019
Metals & Mining
Exxaro’s estimated spot EPS of ZAR29.53 implies what we view as an attractive spot P/E multiple of around 5.6x. However, given elevated spot iron ore prices Exxaro’s spot earnings is well above its earnings potential using mid-cycle commodity prices, and previously reported peak earnings and almost reached estimated peak earnings for the company.
Figure 50: Exxaro – consensus earnings momentum vs share price |
|
|
|
|
|
|
|||||
|
35 |
|
|
|
Forward 12M EPS |
|
|
Share price, ZAR (RHS) |
|
250 |
|
|
|
|
|
|
|
|
|
|
|
||
|
30 |
Peak EPS using incentive prices, |
30.84 |
|
|
|
|
12M forward spot EPS est., 29.53 |
|
||
|
|
|
|
|
|
200 |
|||||
|
|
|
|
|
|
|
|
|
12M forward RenCap EPS est., 28.00 |
||
|
25 |
|
|
|
|
|
|
|
|
|
|
|
20 |
2012 reported peak EPS, 20.69 |
|
|
|
|
|
|
|
150 |
|
|
|
|
|
|
|
|
|
|
|
||
ZAR/share |
Mid-cycle EPS, 20.02 |
|
|
|
|
|
|
|
|
|
|
|
|
|
|
|
|
|
|
|
|
||
15 |
|
|
|
|
|
|
|
|
|
100 |
|
|
|
|
|
|
|
|
|
|
|
||
|
|
|
|
|
|
|
|
|
|
|
|
|
10 |
|
|
|
|
|
|
|
|
|
|
|
|
|
|
|
|
|
|
|
|
|
50 |
|
5 |
2007 reported trough EPS, 3.05 |
|
|
|
|
|
|
|
|
|
|
|
|
|
|
|
|
|
|
|
||
|
0 |
|
|
|
|
|
|
|
|
|
0 |
|
2009 |
2010 |
2011 |
2012 |
2013 |
2014 |
2015 |
2016 |
2017 |
2018 |
2019 |
Source: Company data, Thomson Reuters Datastream, Bloomberg, Renaissance Capital
Glencore’s estimated spot EPS of USc0.34 implies a spot P/E multiple of around 12.2x, but we see recovery potential in Glencore’s earnings as base metal prices recover.
Figure 51: Glencore – consensus earnings momentum vs share price
|
0.9 |
|
|
Forward 12M EPS |
Share price, $ (RHS) |
|
|
|
7.0 |
|
|
|
|
|
|
|
|
||
|
0.8 |
|
|
|
|
|
|
|
6.0 |
|
|
|
Peak EPS using incentive prices, 0.78 |
|
|
|
|
|
|
|
0.7 |
|
|
|
|
|
|
|
|
|
|
|
|
|
|
|
|
|
|
|
0.6 |
|
|
|
|
|
|
|
5.0 |
$/share |
Mid-cycle EPS, 0.52 |
|
|
|
|
|
|
||
|
|
|
|
|
|
|
|||
0.5 |
2012 estimated peak EPS, 0.45 |
|
|
|
|
|
4.0 |
||
|
|
|
|
|
|
||||
|
0.4 |
|
|
|
|
12M forward RenCap EPS est., 0.41 |
3.0 |
||
|
|
|
|
|
|
|
|
||
|
|
|
|
|
|
12M forward spot EPS est., |
0.34 |
||
|
|
|
|
|
|
|
|||
|
0.3 |
|
|
|
|
|
|
|
2.0 |
|
|
|
|
|
|
|
|
|
|
|
0.2 |
|
|
|
|
|
|
|
|
|
0.1 |
2015 estimated trough EPS, 0.10 |
|
|
|
|
|
1.0 |
|
|
|
|
|
|
|
|
|
|
|
|
0.0 |
|
|
|
|
|
|
|
0.0 |
|
|
2013 |
2014 |
2015 |
2016 |
2017 |
2018 |
|
|
Source: Company data, Thomson Reuters Datastream, Bloomberg, Renaissance Capital
28
vk.com/id446425943
Figure 52: Amplats – consensus earnings momentum vs share price
100 Forward 12M EPS Peak EPS using incentive prices, 86.59
|
80 |
|
|
|
|
ZAR/share |
60 |
Mid-cycle EPS, 55.90 |
|
|
|
|
2008 reported peak EPS, 54.58 |
|
|
||
|
|
|
|
||
|
40 |
|
|
|
|
|
20 |
|
|
|
|
|
0 |
|
|
|
|
|
|
2012 reported trough EPS, (5.63) |
|
|
|
|
-20 |
|
|
|
|
|
2009 |
2010 |
2011 |
2012 |
2013 |
Renaissance Capital
1 April 2019
Metals & Mining
Share price, ZAR (RHS) |
|
|
|
900.00 |
|
|
|
|
|
|
|
|
|
|
|
|
800.00 |
|
|
|
12M forward spot EPS est., 78.07 |
|
|
|
|
12M forward RenCap EPS est., 76.53 |
700.00 |
||
|
|
|
|
|
600.00 |
|
|
|
|
|
500.00 |
|
|
|
|
|
400.00 |
|
|
|
|
|
300.00 |
|
|
|
|
|
200.00 |
|
|
|
|
|
100.00 |
|
|
|
|
|
- |
2014 |
2015 |
2016 |
2017 |
2018 |
2019 |
Source: Company data, Thomson Reuters Datastream, Bloomberg, Renaissance Capital
Figure 53: AngloGold Ashanti – consensus earnings momentum vs share price
ZAR/share
60 |
|
|
Forward 12M EPS |
|
Share price, ZAR (RHS) |
|
400 |
|||
|
|
|
|
|
|
|
|
|
||
|
Peak EPS using incentive prices, |
51.04 |
|
|
|
|
|
|
350 |
|
50 |
|
|
|
|
|
|
|
|
|
|
|
|
|
|
|
|
|
|
|
|
|
40 |
|
|
|
|
|
|
|
|
|
300 |
|
|
|
|
|
|
|
|
|
|
|
|
|
|
|
|
|
|
|
|
|
250 |
30 |
2011 reported peak EPS, 25.29 |
|
|
|
|
|
|
|
|
|
|
|
|
|
|
|
|
|
12M forward spot EPS est., 18.16 |
200 |
|
20 |
|
|
|
|
|
|
|
|
||
|
|
|
|
|
|
|
|
|
|
|
|
Mid-cycle EPS, 18.67 |
|
|
|
|
|
12M forward RenCap EPS est., 18.01 |
150 |
||
10 |
|
|
|
|
|
|
|
|
|
100 |
|
|
|
|
|
|
|
|
|
|
|
0 |
2013 reported trough EPS, (6.56) |
|
|
|
|
|
|
|
50 |
|
|
|
|
|
|
|
|
|
|||
|
|
|
|
|
|
|
|
|
||
-10 |
|
|
|
|
|
|
|
|
|
0 |
2009 |
2010 |
2011 |
2012 |
2013 |
2014 |
2015 |
2016 |
2017 |
2018 |
2019 |
Source: Company data, Thomson Reuters Datastream, Bloomberg, Renaissance Capital
Figure 54: Sasol – consensus earnings momentum vs share price
|
100 |
|
|
|
|
Forward 12M EPS |
|
Share price, ZAR (RHS) |
|
|
|
700 |
|
|
|
|
|
|
|
|
|
|
|
|
|
||
|
90 |
|
Peak EPS using incentive prices, |
90 |
|
|
|
|
|
|
|
600 |
|
|
|
|
|
|
|
|
|
|
|
||||
|
80 |
|
|
|
|
|
|
|
|
|
|
|
|
|
70 |
|
|
|
|
|
|
|
|
|
|
|
500 |
|
|
2014 reported peak EPS, 62 |
|
|
|
|
|
|
|
|
|
||
ZAR/share |
|
|
|
|
|
|
|
|
|
|
|
||
60 |
|
|
|
|
|
|
|
|
|
|
|
400 |
|
|
|
|
|
|
|
|
|
|
|
|
|
||
50 |
|
|
|
|
|
|
|
|
|
|
|
|
|
|
|
Mid-cycle EPS, 47 |
|
|
|
|
|
|
12M forward Spot HEPS est., 43.6 |
|
300 |
||
|
40 |
|
|
|
|
|
|
|
|
||||
|
|
|
|
|
|
|
|
|
12M forward RenCap HEPS est., 43.8 |
|
|||
|
30 |
|
|
|
|
|
|
|
|
|
|
|
200 |
|
|
|
|
|
|
|
|
|
|
|
|
|
|
|
20 |
|
|
|
|
|
|
|
|
|
|
|
|
|
10 |
2009 reported trough EPS, 14 |
|
|
|
|
|
|
|
|
100 |
||
|
|
|
|
|
|
|
|
|
|
||||
|
0 |
|
|
|
|
|
|
|
|
|
|
|
0 |
|
|
2009 |
2010 |
2011 |
2012 |
2013 |
2014 |
2015 |
2016 |
2017 |
2018 |
2019 |
|
Source: Company data, Thomson Reuters Datastream, Bloomberg, Renaissance Capital estimates
29
vk.com/id446425943
Renaissance Capital
1 April 2019
Metals & Mining
We calculate further upside to consensus earnings
Despite significant consensus earnings upgrades since the trough, we calculate a further 24% potential upside to average consensus earnings forecasts for the miners we cover if spot commodity prices prevail.
Figure 55: Upside/(downside) potential to one-year forward consensus earnings if spot prices prevail
150% |
|
|
|
|
|
|
|
|
|
|
|
|
|
|
|
|
|
|
|
|
|
|
|
100%+ |
100%+ |
100%+ |
100%+ |
100%+ |
96% |
89% |
75% |
65% |
63% |
52% |
46% |
38% |
29% |
28% |
26% |
24% |
22% |
21% |
20% |
11% |
11% |
6% |
1% |
100% |
|
|
|
|
|
|
|
|
|
|
|
|
|
|
|
|
|
|
|
|
|
|
|
50% |
|
|
|
|
|
|
|
|
|
|
|
|
|
|
|
|
|
|
|
|
|
|
|
0% |
|
|
|
|
|
|
|
|
|
|
|
|
|
|
|
|
|
|
|
|
|
|
|
-3% -5% -7% -10% -11% -17%
-50% 36% -
-100%
Lonmin |
Impala |
RBPlats |
Fortescue |
Amplats |
Sibanye |
Platinum* |
Kumba |
Assore |
ARM |
Vale |
Gold Fields |
Harmony |
BHP |
Rio Tinto |
Diversified* |
W. average* |
Gold* |
AngloGold |
Anglo |
Norilsk |
Exxaro |
Polyus |
Polymetal |
South32 |
Northam** |
Sasol |
Alrosa |
Glencore |
Merafe |
Rusal |
Note: Priced on 26 March 2019. *Weighted by market cap.
Source: Bloomberg, Thomson Reuters Datastream, Renaissance Capital
30

vk.com/id446425943
Renaissance Capital
1 April 2019
Metals & Mining
The table below ranks miners in our global coverage universe by spot FCF yield. Some miners are trading at what we view as attractive spot FCF yields of 10%-plus.
However, in some cases (iron ore producers in particular) we believe these FCF yields depend on elevated margins, which may not be sustained in the long term.
Figure 56: Summary sector ratings and TPs (ranked by spot FCF yield)
Company |
|
Share price* |
TP |
|
Spot P/E, x |
|
Consensus |
|
Spot FCF |
|
Spot DY |
Rating |
|
|
|
P/E, x |
|
yield |
|
||||||
|
|
|
|
|
|
|
|
|
|
|
||
Lonmin, ZAR |
|
15.5 |
17.0 |
|
1.6 |
|
6.7 |
|
37.4% |
|
0.0% |
HOLD |
Fortescue, AUD |
6.6 |
7.1 |
3.8 |
8.4 |
31.7% |
22.2% |
BUY |
|||||
ARM, ZAR |
|
166.0 |
190.0 |
|
3.9 |
|
6.3 |
|
20.8% |
|
8.6% |
BUY |
Rusal, HKD |
3.5 |
6.6 |
6.3 |
4.1 |
19.8% |
2.8% |
BUY |
|||||
Kumba Iron Ore, ZAR |
|
405.4 |
330.0 |
|
6.1 |
|
10.7 |
|
19.0% |
|
16.4% |
SELL |
Impala Platinum, ZAR |
64.8 |
83.0 |
4.8 |
18.4 |
16.7% |
0.0% |
BUY |
|||||
Alrosa, RUB |
|
94.3 |
109.0 |
|
7.5 |
|
6.8 |
|
14.7% |
|
14.2% |
BUY |
BHP, ZAR |
339.9 |
340.0 |
9.4 |
12.1 |
14.2% |
9.6% |
HOLD |
|||||
Merafe, ZAR |
|
1.4 |
1.5 |
|
7.9 |
|
6.5 |
|
14.0% |
|
13.3% |
BUY |
Harmony, ZAR |
29.6 |
22.0 |
7.2 |
10.0 |
12.6% |
0.0% |
SELL |
|||||
Vale, $ |
|
13.0 |
15.5 |
|
4.4 |
|
6.7 |
|
12.2% |
|
0.0% |
HOLD |
Sibanye-Stillwater, ZAR |
17.4 |
19.5 |
6.0 |
11.7 |
11.9% |
1.8% |
BUY |
|||||
Exxaro, ZAR |
|
164.2 |
190.0 |
|
5.6 |
|
6.1 |
|
11.8% |
|
10.8% |
BUY |
Polyus, RUB |
5,434.0 |
6,600.0 |
7.3 |
7.8 |
11.5% |
6.0% |
BUY |
|||||
Assore, ZAR |
|
361.2 |
350.0 |
|
4.2 |
|
6.9 |
|
11.4% |
|
11.8% |
HOLD |
Anglo American, ZAR |
378.1 |
400.0 |
7.6 |
9.1 |
11.2% |
7.1% |
HOLD |
|||||
Rio Tinto, GBP |
|
43.1 |
50.0 |
|
8.1 |
|
10.3 |
|
10.6% |
|
8.7% |
BUY |
Northam, ZAR |
67.3 |
60.0 |
9.8 |
50.9 |
10.3% |
0.0% |
SELL |
|||||
South32, ZAR |
|
38.1 |
40.0 |
|
11.2 |
|
10.9 |
|
10.1% |
|
6.4% |
HOLD |
Gold Fields, ZAR |
57.7 |
46.0 |
12.7 |
18.5 |
9.9% |
2.7% |
SELL |
|||||
Norilsk, $ |
|
22.4 |
31.0 |
|
7.3 |
|
8.1 |
|
8.9% |
|
12.0% |
BUY |
AngloGold Ashanti, ZAR |
205.3 |
115.0 |
11.4 |
13.8 |
8.7% |
1.0% |
SELL |
|||||
Polymetal, GBP |
|
8.7 |
8.4 |
|
9.7 |
|
9.9 |
|
7.9% |
|
5.1% |
HOLD |
Glencore, ZAR |
59.4 |
65.0 |
12.2 |
10.8 |
7.6% |
4.4% |
HOLD |
|||||
Amplats, ZAR |
|
795.0 |
780.0 |
|
10.2 |
|
20.6 |
|
7.3% |
|
3.9% |
HOLD |
Sasol, ZAR |
444.5 |
510.0 |
10.2 |
9.5 |
1.4% |
3.6% |
BUY |
|||||
RBPlats, ZAR |
|
35.0 |
37.0 |
|
6.0 |
|
17.3 |
|
-3.5% |
|
0.0% |
HOLD |
*Priced at market close on 26 March 2019.
Source: Company data, Renaissance Capital estimates
31