

vk.com/club152685050Cyclic Symmetry Analysis | vk.com/id446425943
The iteration strategy yields the following results:
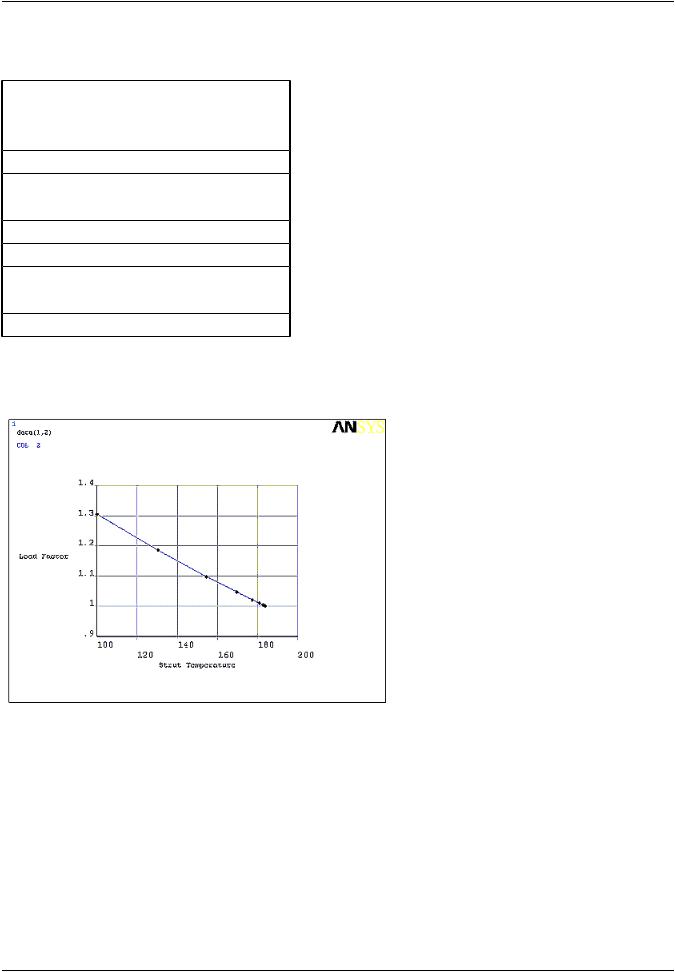
Table 7.2: Buckling Cyclic Symmetry: Load Factor Iteration Results
Iteration |
T° (Strut) |
Load Factor |
1 |
100.00 |
1.3039 |
2 |
130.39 |
1.1845 |
3 |
154.44 |
1.0972 |
4 |
169.45 |
1.0461 |
5 |
177.27 |
1.0206 |
6 |
180.91 |
1.0089 |
7 |
182.52 |
1.0038 |
8 |
183.21 |
1.0016 |
9 |
183.50 |
1.0007 |
10 |
183.62 |
1.0003 |
A graph of the results shows the convergence at Load Factor = 1.0:
Figure 7.24: Buckling Cyclic Symmetry Results: Load Factor Results Graph
7.7. Example Harmonic Cyclic Symmetry Analysis
This section introduces the harmonic cyclic symmetry analysis capability with an example problem. The example presents a simplified ring-strut-ring structure used in many rotating-machinery applications.
7.7.1.Problem Description
7.7.2.Problem Specifications
7.7.3.Input File for the Analysis
7.7.4.Analysis Steps
|
Release 15.0 - © SAS IP, Inc. All rights reserved. - Contains proprietary and confidential information |
210 |
of ANSYS, Inc. and its subsidiaries and affiliates. |

vk.com/club152685050 | vk.com/id446425943 |
Example Harmonic Cyclic Symmetry Analysis |
7.7.1. Problem Description
The component is a simplified fan inlet case for a military aircraft engine. As part of the design process for the assembly, the harmonic response characteristics of the inlet case may be investigated, as shown in this example.
7.7.2. Problem Specifications
The geometric and material properties used for the harmonic cyclic analysis are the same as used in Example Modal Cyclic Symmetry Analysis (p. 198).
All applicable degrees of freedom are used for the cyclic symmetry edge-component pairs. The harmonic response to a pressure load applied on the assembly is computed.
7.7.3. Input File for the Analysis
Use the input file given below (named harm_cyc_symm.inp) to perform the example modal cyclic symmetry analysis. The file contains the complete geometry, material properties and solution options for the finite element model.
!Harmonic Cyclic Symmetry Analysis Example ! Ring-Strut-Ring Configuration
!STEP #1
!Start an interactive session
!STEP #2
!Read in this input file: harm_cyc_symm.inp
finish /clear
r1=5
r2=10
d1=2
nsect=24 alpha_deg=360/nsect alpha_rad=2*acos(-1)/nsect
/view,1,1,1,2
/plopts,minm,0
/plopts,date,0
/pnum,real,1
/number,1
/prep7
csys,1
k,1,0,0,0
k,2,0,0,d1
k,3,r1,0,0
k,4,r1,0,d1
l,3,4 arotat,1,,,,,,1,2,alpha_deg/2 k,7,r2,0,0
k,8,r2,0,d1
l,7,8 arotat,5,,,,,,1,2,alpha_deg/2 arotat,2,,,,,,1,2,alpha_deg/2 arotat,6,,,,,,1,2,alpha_deg/2 a,5,6,10,9
mshkey,1
et,1,181
r,1,0.20
r,2,0.1
mp,ex,1,10e6
Release 15.0 - © SAS IP, Inc. All rights reserved. - Contains proprietary and confidential information |
|
of ANSYS, Inc. and its subsidiaries and affiliates. |
211 |

vk.com/club152685050Cyclic Symmetry Analysis | vk.com/id446425943
mp,prxy,1,0.3 mp,dens,1,1e-4 esize,0.5 asel,,,,1,4 aatt,,1 asel,,,,5 aatt,,2 allsel
dk,5,all,0
aplot /prep7
!/eof
!STEP #3
!Configure the database for a cyclic symmetry analysis
cyclic
!STEP #4
!Mesh the areas
amesh,all
!STEP #5
!Turn on cyclic symmetry graphical expansion
/cycexpand,,on
!STEP #6
!Plot the elements
eplot
!STEP #7
!List the cyclic status
cyclic,status
!STEP #8
!List the cyclic solution option settings
cycopt,status fini
!STEP #9
!Solve the harmonic cyclic symmetry analysis
/solution
!Specify harmonic analysis option and frequency sweep values antype,harmic
hropt,full
harfrq,860,878
nsub,9
!Apply pressure load on the outer surface area asel,s,area,,2
asel,a,area,,4
!Loading to be applied on sector number 3
cycopt,ldsect,3 sfa,all,,pres,-124 asel,all
solve fini
!STEP #10
!Go to database results post processor
/post1
|
Release 15.0 - © SAS IP, Inc. All rights reserved. - Contains proprietary and confidential information |
212 |
of ANSYS, Inc. and its subsidiaries and affiliates. |
vk.com/club152685050 | vk.com/id446425943 |
Example Harmonic Cyclic Symmetry Analysis |
set,list
!STEP #11
!Read results for "substep 3 - excitation freq. of 866 HZ"
set,,3
plns,u,sum,1 fini
!STEP #12
!Go to time/freq. history postprocessor
/post26
!STEP #13
!Store X and Y disp. of node #34 on sector #3"
nsol,2,34,U,x,UX_34,3 nsol,3,34,U,y,UY_34,3
!STEP #14
!Plot UX and UY disp. of node #34 as a function of freq.
plvar,2,3
7.7.4. Analysis Steps
The following table describes the input listing and the steps involved in the example modal cyclic symmetry analysis in detail.
Step |
Step Description |
Description |
1. |
Start an interactive session. |
--- |
2. |
Read the input file: harm_cyc_symm.inp. |
/INPUT,HARM,CYC_SYMM.INP |
3.Specify a cyclic symmetry analysis and configure CYCLIC the database accordingly.
4. |
Mesh the areas. |
AMESH,ALL |
5. |
Activate cyclic symmetry graphical expansion. |
/CYCEXPAND,,ON |
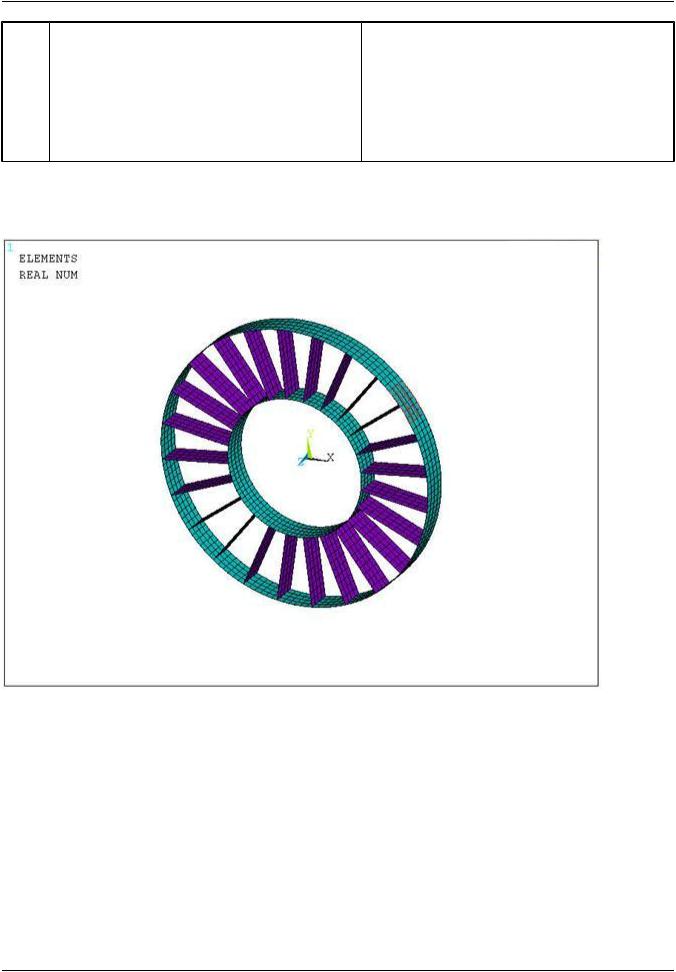
6. |
Plot the elements. Figure 7.25: Element Plot |
EPLOT |
|
Showing Pressure Load on Sector 3 (p. 214) |
|
|
shows an element plot showing pressure load |
|
|
on sector 3. |
|
7. |
List the cyclic status. |
CYCLIC,STATUS |
8. |
List the cyclic solution option settings. |
CYCOPT,STATUS |
9. |
Solve the modal cyclic symmetry analysis. |
/SOLU |
|
|
SOLVE |
10. |
Enter database results postprocessor. |
/POST1 |
11. |
Read results for sub step 3 – Frequency = 866. |
SET,1,3 |
12. |
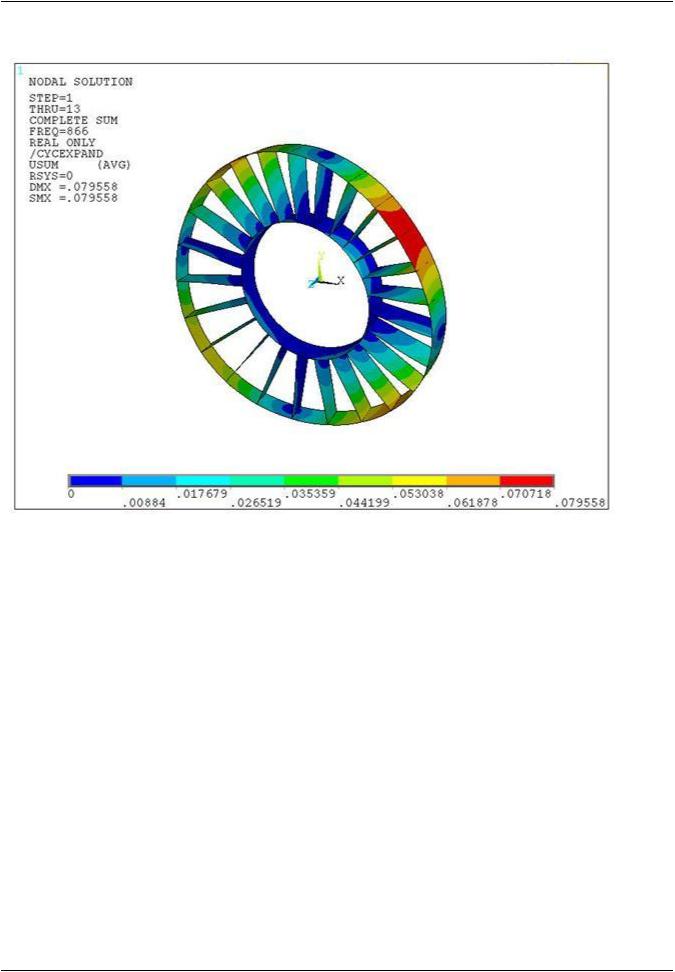
Plot the displacement sum contour. Fig- |
PLNSOL,U,SUM |
|
ure 7.26: Contour Plot of Displacement Sum at |
|
|
Frequency of 866 HZ (p. 215) shows a contour |
|
|
plot of displacement sum at frequency = 866 |
|
|
HZ. |
|
13. |
Enter time/frequency history postprocessor. |
/POST26 |
Release 15.0 - © SAS IP, Inc. All rights reserved. - Contains proprietary and confidential information |
|
of ANSYS, Inc. and its subsidiaries and affiliates. |
213 |
vk.com/club152685050Cyclic Symmetry Analysis | vk.com/id446425943
14. |
Store nodal data from results file for node 34. |
NSOL,2,34,u,x,UX_34,3 |
NSOL,3,34,u,y,UY_34,3
15.Plot frequency versus displacement. Plot at node PLVAR,2,3 34. Figure 7.27: Displacement Plot as a Function
of Excitation Frequency (p. 216) shows the displacement plot as a function of the excitation frequency.
The results of your analysis should match those shown below:
Figure 7.25: Element Plot Showing Pressure Load on Sector 3
|
Release 15.0 - © SAS IP, Inc. All rights reserved. - Contains proprietary and confidential information |
214 |
of ANSYS, Inc. and its subsidiaries and affiliates. |
vk.com/club152685050 | vk.com/id446425943 |
Example Harmonic Cyclic Symmetry Analysis |
Figure 7.26: Contour Plot of Displacement Sum at Frequency of 866 HZ
Release 15.0 - © SAS IP, Inc. All rights reserved. - Contains proprietary and confidential information |
|
of ANSYS, Inc. and its subsidiaries and affiliates. |
215 |