

vk.com/club152685050Probabi istic Design | vk.com/id446425943
Young's modulus (E) = 30E6 psi
The following geometric properties are used for this analysis. These properties are the initial cross-sec- tional areas for each truss member:
ARE1 = 5.0
ARE2 = 5.0
ARE3 = 5.0
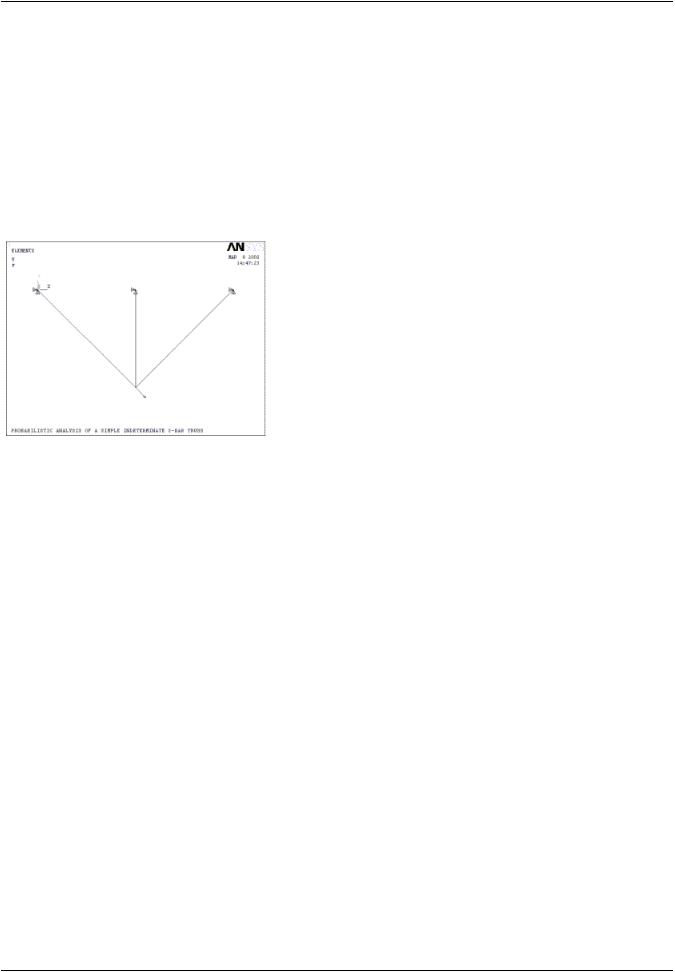
1.8.2.1. Problem Sketch
Figure 1.15: The Simple Indeterminate Three-Bar Truss for the Example Problem
1.8.3. Using a Batch File for the Analysis
You can perform the example probabilistic design analysis of this three-bar truss using the commands shown below.
The analysis file is created for use during the probabilistic analysis. It is a parametric model of the problem geometry, materials, and loads. Within the analysis file, input variables are initialized and output variables are retrieved. If you prefer, you can perform the second pass of the example analysis using
the GUI method rather than commands. See Using the GUI for the PDS Analysis (p. 72) for details.
The following input listing sets up the analysis file for the three-bar truss.
/com
/com, Create an analysis file to be used during looping
/com |
|
*create,pds3bar,pdan |
|
*SET,ARE1,5.00 |
!INITIALIZE CROSS SECTIONAL AREAS |
*SET,ARE2,5.00 |
|
*SET,ARE3,5.00 |
|
/PREP7
/title, PROBABILISTIC ANALYSIS OF A SIMPLE INDETERMINATE THREE-BAR TRUSS
ET,1,1 |
|
EX,1,30E6 |
|
R,1,ARE1 |
|
R,2,ARE2 |
|
R,3,ARE3 |
|
N,1 |
|
N,2,10 |
|
N,3,20 |
|
N,4,10,-10,,-45 |
! ROTATE TIPNODE 45° |
REAL,1 |
|
E,1,4 |
|
REAL,2 |
|
E,2,4 |
|
|
Release 15.0 - © SAS IP, Inc. All rights reserved. - Contains proprietary and confidential information |
70 |
of ANSYS, Inc. and its subsidiaries and affiliates. |

vk.com/club152685050 | vk.com/id446425943 |
Example Probabilistic Design Analysis |
REAL,3
E,3,4
D,1,ALL,,,3
F,4,FX,20000 FINISH
/SOLU SOLVE FINISH /POST1
SET,1 |
|
ETABLE,VOLU,VOLU |
! STORE MEMBER VOLUMES |
ETABLE,AXST,LS,1 |
! STORE MEMBER AXIAL STRESSES |
*GET,SIG1,ELEM,1,ETAB,AXST |
! SIG1 IS DEFINED TO BE AXIAL STRESS IN ELEMENT 1 |
*GET,SIG2,ELEM,2,ETAB,AXST |
! SIG2 IS DEFINED TO BE AXIAL STRESS IN ELEMENT 2 |
*GET,SIG3,ELEM,3,ETAB,AXST |
! SIG3 IS DEFINED TO BE AXIAL STRESS IN ELEMENT 3 |
SSUM |
|
*GET,TVOL,SSUM,,ITEM,VOLU |
|
FINI |
|
*end |
|
After the analysis file has been created, you can proceed with the probabilistic design analysis. You can do this though commands or though the GUI. If you prefer using commands, the following input sets up the probabilistic analysis for the three-bar truss example.
/inp,pds3bar,pdan |
|
|
/com |
|
|
/com, Enter PDS and specify |
the analysis file |
|
/com |
|
|
/PDS |
! enter probabilistic design system |
|
pdanl,pds3bar,pdan |
|
|
/com |
|
|
/com, Declare random input variables |
|
|
/com |
|
|
PDVAR,ARE1,GAUS,5,0.5 |
! define |
area1 with Gaussian distribution |
|
! having |
mean of 5 and std. dev of 0.5 |
PDVAR,ARE2,tria,10,11,12 |
! define |
area2 with triangular distribution |
|
! having |
low bound of 10, most likely point of 11 |
|
! and high bound of 12 |
|
PDVAR,ARE3,unif,5,6 |
! define |
area3 with uniform distribution |
|
! with low bound of 5 and high bound of 6 |
|
/com
/com, Specify any correlations between the random variables
/com |
|
PDCOR,ARE1,ARE3,0.25 |
! define a correlation coef of 0.25 between ARE1 and ARE3 |
/com |
|
/com, Declare random output variables |
|
/com |
|
PDVAR,SIG1,resp |
! define SIG1 a response parameter |
PDVAR,SIG2,resp |
! define SIG2 a response parameter |
PDVAR,SIG3,resp |
! define SIG3 a response parameter |
PDVAR,TVOL,resp |
! define TVOL a response parameter |
/com
/com, Select the probabilistic design tool or method
/com |
|
PDMETH,MCS,DIR |
! specify direct Monte Carlo simulation |
PDDMCS,100,NONE,ALL,,,,123457 ! use all 100 samples, initial seed of 123457 /com
/com, Execute the loops required for the probabilistic design analysis
/com |
|
PDEXE,mcs3bar |
! run analysis and define solution label 3bar_mcs |
/com |
|
/com, Review the results of the probabilistic analysis /com
PDSENS,MCS3BAR,TVOL,BOTH,RANK,0.025 !Create Sensitivity plot fini
/exit
Release 15.0 - © SAS IP, Inc. All rights reserved. - Contains proprietary and confidential information |
|
of ANSYS, Inc. and its subsidiaries and affiliates. |
71 |

vk.com/club152685050Probabi istic Design | vk.com/id446425943
1.8.4. Using the GUI for the PDS Analysis
Because of the parametric definition of some variables in the analysis file, the GUI method is not recommended for analysis file creation and is not presented here. It is acceptable, however, to perform the probabilistic design analysis of the three-bar truss example via the GUI method. The GUI procedure for performing the probabilistic design analysis follows. Using a Batch File for the Analysis (p. 70) describes how to create an analysis file. The GUI procedure for performing the probabilistic design analysis pass follows.
Step 1: Test Analysis File
To test the analysis file, you clear the database and then read input from the pds3bar.pdan file.
1.Select menu path Utility Menu> File> Clear & Start New. Click OK.
2.In the Verify dialog box, click Yes.
3.Change the jobname. Select menu path Utility Menu> File> Change Jobname. The Change Jobname dialog box appears.
4.Change the jobname to pds3bar.pdan and click OK.
5.Select menu path Utility Menu> File> Read Input from. In the Files list, click on pds3bar.pdan. Then click OK. You see a replay of the entire analysis. Click on Close when the “Solution is done!” message appears.
In the next several steps of this problem, you explore the effects of variation in the parameters.
Step 2: Enter the Probabilistic Design Module and Identify Analysis File
First, enter the optimizer and identify the analysis file.
1.Select menu path Main Menu> Prob Design> Analysis File> Assign. The Assign Analysis File dialog box appears.
2.In the Files list, click once on pds3bar.pdan and then clickOK.
Step 3: Identify the Probabilistic Design Variables
1.Select menu path Main Menu>Prob Design>Prob Definitions>Random Input. The Random Input Variables dialog box appears.
2.Click Add. The Define a Random Variable dialog box appears.
3.In the list of parameter names, click ARE1. Select GAUSS in the distribution type list. Click OK.
4.Type 5 in the MEAN VALUE field and 0.5 in the STANDARD DEVIATION field. Click OK.
5.Click Add. The Define a Random Variable dialog box appears.
6.In the list of parameter names, click ARE2. Select TRIANGULAR in the distribution type list. Click OK.
7.Type 10 in the LOWER BOUNDARY field, 11 in the MOST LIKELY VALUE field, and 12 in the UPPER BOUNDARY field. Click OK.
|
Release 15.0 - © SAS IP, Inc. All rights reserved. - Contains proprietary and confidential information |
72 |
of ANSYS, Inc. and its subsidiaries and affiliates. |
vk.com/club152685050 | vk.com/id446425943 |
Example Probabilistic Design Analysis |
8.Click Add. The Define a Random Variable dialog box appears.
9.In the list of parameter names, click ARE3. Select UNIFORM in the distribution type list. Click OK.
10.Type 5 in the LOW BOUND field, and 6 in the HIGH BOUND field. Click OK.
11.Click on Close to close the Define a Random Variable dialog box.
12.Select menu path Main Menu> Prob Design> Prob Definitions> Correlation. The Add/Edit or Delete Correlation dialog box appears.
13.Select ARE1 and ARE2 from the list of variable names. Click OK. Type 0.25 in the Correlation Coeff field.
14.Select menu path Main Menu> Prob Design> Prob Definitions> Random Output. The Random Output Parameters dialog box appears.
15.Click Add. The Define a Random Output Parameter dialog box appears. In the list of parameter names, click on SIG1. Click OK.
16.Click Add. The Define a Random Output Parameter dialog box appears. In the list of parameter names, click on SIG2. Click OK.
17.Click Add. The Define a Random Output Parameter dialog box appears. In the list of parameter names, click on SIG3. Click OK.
18.Click on Close to close the Random Output Parameters dialog box.
Step 4: Run the Probabilistic Design Analysis
This step involves specifying the probabilistic design method, executing the run, and saving the data.
1.Select menu path Main Menu> Prob Design> Prob Method> Monte Carlo Sims. The Monte Carlo Simulation dialog box appears.
2.Select Direct Sampling from Sampling Methods.
3.Type 100 in the Number of Simulations field. Select Use 123457 from the Random Seed Option. Click OK.
4.Select menu path Main Menu> Prob Design> Run> Exec Serial> Run Serial. Type mcs3bar in the Solution Set Label field. Click OK.
5.The Run Monte Carlo Simulations dialog box appears. Click OK.
6.Select menu path Main Menu> Prob Design> Prob Database> Save. Type mcs3bar in the selection field. Click OK.
When the data is saved, you are ready to review the results.
Step 5: Review the Probabilistic Results
In this step, you visualize the probabilistic results.
Release 15.0 - © SAS IP, Inc. All rights reserved. - Contains proprietary and confidential information |
|
of ANSYS, Inc. and its subsidiaries and affiliates. |
73 |

vk.com/club152685050Probabi istic Design | vk.com/id446425943
1.Select menu path Main Menu> Prob Design> Prob Results> Trends> Sensitivities. The Sensitivity of a Response Parameter dialog box appears.
2.Select MCS3BAR in the Select Results Set field. Select SIG1 in the Select Response Parameter field. Click OK.
3.A Rank-Order Correlation Sensitivity bar and pie chart is shown in the Graphics window.
Step 6: Exit
1.Click on Quit in the Toolbar.
2.Select an option to save, then click OK.
|
Release 15.0 - © SAS IP, Inc. All rights reserved. - Contains proprietary and confidential information |
74 |
of ANSYS, Inc. and its subsidiaries and affiliates. |