

Biomolecular Sensing Processing and Analysis - Rashid Bashir and Steve Wereley
.pdf136 |
ABRAHAM P. LEE, JOHN COLLINS, AND ASUNCION V. LEMOFF |
challenges for the following reasons. First, the fluid being pumped is far from being uniform in properties or homogeneous in its constituents. The fluids routed not only are different depending on the application, but their properties change over time as they are being processed. Second, it is much more important to consider the three-dimensional aspects of the flow channels versus the virtually one-dimensional thin film wires in ICs. Third, microfluidic channels function not only as resistors, due to fluid viscosity and interfacial forces between fluid and the solid channel walls, but they also store mechanical energy in a way analogous to capacitors and inductors. Microfluidic devices with parallel electrodes can address many of these challenges since they have the following desirable features: large scale integration of flow control elements, compatible with biological samples (low ac voltage), generates continuous volume flow instead of pulsatile surface flow, and establishes a common microfabrication platform for multi-functional elements such as flow rate sensors, viscosity sensors, impedance sensors, micro mixers, and droplet generators. In addition, it can manipulate unprocessed biofluids with wide ranges of properties as long as the solution is slightly conductive.
In the 1960s MHD was investigated as a method to generate quiet propulsion of marine vehicles (ships and submarines) using the conducting characteristics of seawater [19, 23, 29]. However, the propulsion efficiency was low at the large scales necessary for practical applications, requiring superconducting magnets and heavy weight structural materials. Other applications of large-scale MHD instruments include generators, heat extractors (using liquid metals in nuclear reactors), high temperature plasma controllers, spacecraft propulsion, and metallurgy for casting [4]. Recently, the advent of MEMS and microfluidics has enabled the implementation and application of MHD in the micro-scale.
This chapter introduces the various components to manipulate biological fluids enabled by parallel electrodes in microchannels. Components include MHD microfluidic pumps (AC micropump [16] and microfluidic switch [17], mixers, droplet generators), impedance based sensors, and biomolecular separation/extraction devices. In addition, various applications of these integrated microfluidics platforms are introduced to motivate those interesting in further developing this exciting technology.
7.2. MHD MICROPUMP FOR SAMPLE TRANSPORT USING MICROCHANNEL PARALLEL ELECTRODES
7.2.1. Principle of Operation
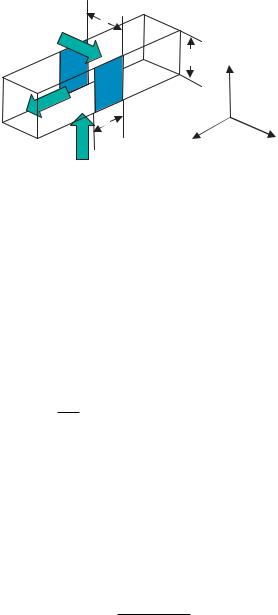
The pumping mechanism for a magnetohydrodynamic pump results from the Lorentz force produced when an electrical current is applied across a channel filled with conducting solution in the presence of a perpendicular magnetic field (Fig. 7.1). The Lorentz force is both perpendicular to the current in the channel and the magnetic field, and is given by
F |
= J × B |
(7.1a) |
Ve |
||
P = J × Ble |
(7.1b) |
|
where F is the MHD propulsion force in the channel, J the electrical current density across the channel, B the magnetic field (or magnetic flux density in webers/m2), Ve the fluid
A MULTI-FUNCTIONAL MICRO TOTAL ANALYSIS SYSTEM (µTAS) PLATFORM |
137 |
w
I
h
z
F
le |
x |
y |
B
FIGURE 7.1. Vector diagram of MHD pump. I is the current between the blue electrodes, B is the magnetic field perpendicular to the substrate, and F is the Lorentz force generated in the microchannel.
volume in between the electrodes, P the MHD generated pressure drop in the channel, and le the length of the electrodes. This geometry is shown in Fig. 7.1. As Eq. 7.1 shows, the MHD force scales poorly with fluid volume (length cubed) but the pressure drop scales more favorably with only one length unit, le . Since the total current across the electrodes, I = J Lh, Eq. 7.1b becomes:
P = IB/ h |
(7.2) |
where h is the height of the electrode. For flow analysis the Navier-Stokes partial differential equation can be written as [22, 25, 31]:
DU |
= − P + µ 2U + J × B |
(7.3) |
ρ Dt |
where ρ is the fluid density, U the velocity as a function of x and t, and τ the viscosity of the fluid. This equation is provided for those interested in solving more complex MHD flow problems. In this chapter a simplified analysis is provided.
In microchannels, assuming laminar, Newtonian flow then Poiseuille’s law governs that the pressure drop P is:
P = Q R |
(7.4) |
where Q is the volumetric flow rate and R is the fluidic resistance which is dependent on the geometry of the channels [31]. For rectangular channels, the fluidic resistance is given by
R |
= |
|
8µL(w + h)2 |
(7.5) |
|
w3h3 |
|||||
|
|
|
where w is the distance between the electrodes, L the total length of the channel and µ is the viscosity of the fluid. Substituting Eq. 7.5 into Eq. 7.4 and then equating with Eq. 7.2 gives the flow rate as
Q = |
IBw3h2 |
(7.6) |
||
8µL(w |
+ |
h)2 |
||
|
|
|
|
|
138 |
ABRAHAM P. LEE, JOHN COLLINS, AND ASUNCION V. LEMOFF |
||
|
|
|
|
|
|
|
|
+ |
+v |
F |
|
||
|
|
I
B |
- |
- |
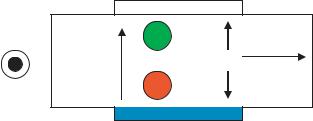
FIGURE 7.2. Top-view of MHD pump with magnetic field coming out of the page. Positive and negative charges are pumped in the same direction.
An equivalent expression for the Lorentz force is given by
F = qv × B |
(7.7) |
where q is the charge, ν the velocity and B the magnetic field. Unlike electrophoresis, both the positive and negative charges are pumped in the same direction (since qν is always same sign). This is shown in Fig. 7.2.
In our micropump design, an AC electrical current is applied in a perpendicular, synchronous AC magnetic field from an electromagnet. When an AC current of sufficiently high frequency is passed through an electrolytic solution, the chemical reactions are reversed rapidly such that there isn’t sufficient electrochemical ionic exchange to form bubbles and cause electrode degradation. In this case, the time-averaged Lorentz force not only depends on the amplitudes of the electrical current or the magnetic field but also depends on the phase of the magnetic field, relative to the electrode current, and is given by
2π
F = IBw sin ωt sin(ωt + φ)dωt (7.8)
0
The ability to control the phase allows for controlling not only the flow speeds but also flow direction. The integrand can have a value between −1/2 to 1/2. At 0◦, the integrand is positive and corresponds to a flow in one direction. At 180◦, the integrand is negative and correponds to flow in the opposite direction and at 90◦, the integrand is zero corresponding to no flow.
7.2.2. Fabrication of Silicon MHD Microfluidic Pumps
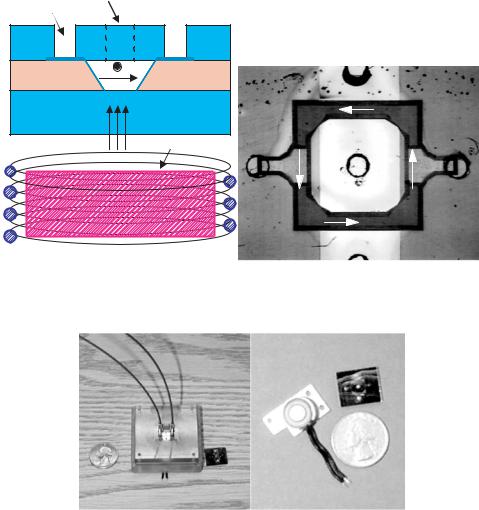
The microchannels were fabricated by etching a v-groove through a silicon wafer 380 µm thick (see Fig. 7.3). A thin oxide was grown for electrical insulation before metal electrodes (200A◦ Ti / 2000A◦ Pt) were deposited on to the side-walls of the channel using a shadow mask. The silicon wafer was then anodically bonded between two glasses. The top glass has holes that were ultrasonically drilled for fluidic input and electrical contact. Figure 7.3 shows a photograph of a fluidic chip in which liquid is pumped around a square loop.
The electromagnet is positioned underneath the fluidic chip as shown in Fig. 7.3. The magnetic field strength is measured underneath the device and above the device. The
A MULTI-FUNCTIONAL MICRO TOTAL ANALYSIS SYSTEM (µTAS) PLATFORM |
139 |
hole for fluid input and hole for electrical contact
pyrex glass |
|
|
silicon with |
|
F |
I |
electrical |
|
thin oxide |
contact |
|
|
|
pyrex glass
Magnetic core fluid inlet |
electrical |
|
||
contact |
|
|
||
B |
|
|
||
|
|
|
||
|
-V |
|
fluid outlet |
|
|
|
flow |
|
|
(a) |
+V |
electrical |
(b) |
|
contact |
||||
|
|
|||
FIGURE 7.3. (a) Cross-section of AC MHD micropump set-up. The Lorentz force produced is directed into the paper. (b) Photograph of top view of circular pump. Channel depth of 380 µm and top width of 800 µm. Electrode width of 4 mm.
Silicon fluidic chip
electromagnet
Photos of the MHD system. Left Actual MHD package. Right The mini-electromagnet and the silicon fluidic chip compared to a US quarter dollar coin.
electromagnet used is commercially available through Edmund Scientific and is shown in 0 along with the MHD packaging used. The core measures 1/4” in diameter and 1/4” in height. The actual core material is not known.
7.2.3. Measurement Setup and Results
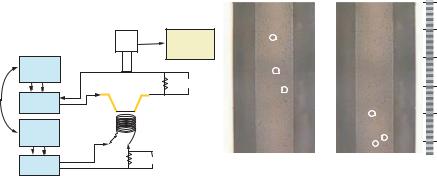
The measurement set-up is shown in Fig. 7.4. The MHD components (microchannel electrodes and electromagnet) have the same basic electrical circuit. The electrodes and the electromagnet are driven separately by a function generator which is connected to an
140 |
|
|
|
ABRAHAM P. LEE, JOHN COLLINS, AND ASUNCION V. LEMOFF |
|||||
|
|
|
|
|
|
|
|
|
microns |
|
|
|
|
|
|
|
|
|
0 |
|
|
|
|
|
Computer with |
A |
|
|
300 |
|
|
|
|
|
|
|
|
||
|
|
Camera |
|
|
video capture |
|
|
|
|
|
|
Microscope |
|
|
software |
|
|
|
600 |
|
Function |
|
|
|
|
|
|
||
|
|
|
|
B |
|
|
|
||
|
|
|
|
|
|
|
|
||
|
Generator |
|
|
|
|
|
|
|
|
|
|
|
|
|
|
|
|
|
|
|
|
+ Channel |
− |
V |
|
C |
|
900 |
|
Phase |
|
|
|
A |
|
||||
controller |
Amplifier |
|
|
|
|
|
|
|
|
|
|
|
|
|
|
|
|
||
|
|
|
|
|
|
|
|
|
1200 |
|
Function |
Electromagnet |
|
|
|
|
|
C |
|
|
+ |
|
|
|
|
|
|
||
|
Generator |
− |
|
|
|
|
|
||
|
|
|
|
|
B |
1500 |
|||
|
|
|
|
|
|
|
|
||
|
Amplifier |
|
|
|
V |
t = 0 |
|
t = 0.87 sec |
|
|
|
|
|
|
|
|
|||
|
|
|
|
|
|
|
|
||
FIGURE 7.4. (a) Left: Measurement set-up for MHD micropump; (b) Right: Video capture of 5 µm polystyrene beads flowing through a microchannel 800 µm wide. Flow velocities for the three particles measured in mm/s are: A = 1.06, B = 1.02, C = 0.67
amplifier. A resistor is used in series with the MHD components to measure the current and phase going through the device. The two function generators are locked to enable phasecontrol. A microscope is positioned above the fluidic chip for viewing. This microscope has a CCD camera which is hooked up to a computer with video capture software.
The solutions used are mixed with 5 µm polystyrene beads. Flow measurements are done by recording a 3–5 second movie using video capture software. This allows us track the beads frame by frame. The distance a particle has travelled can be measured within a given time which enables flow speeds to be deduced. Fig. 7.4 shows the evolution of three beads between two frames 0.87 seconds apart. The resulting velocity profile is consistent with pressure-driven flow.
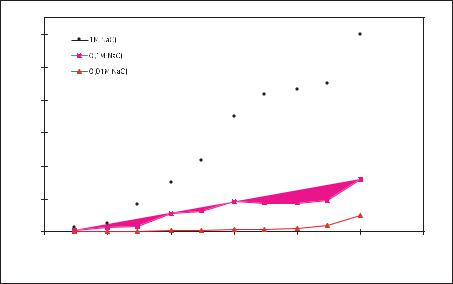
Measurements were done on varying concentrations of NaCl solution to determine the maximum current allowed in the microchannels before bubble formation is observed. This is shown in Fig. 7.5. Bubbles are observed at lower currents in solutions of lower concentrations. One possible explanation is that solutions with lower concentrations have much longer Debye length, and hence larger volumes near the electrodes where hydrolysis can occur [22]. Increasing the frequency allows higher currents to be achieved without bubble formation. All measurements were done with a top channel width of 800 µm and an electrode area of 4 mm×380 µm. For channels of different width but the same electrode area, the same bubble current threshold is observed. For smaller widths, there is a lower voltage drop and for larger widths, there is a higher voltage drop across the solution, since the resistance depends upon the length of the current path in the solution. Another consequence of hydrolysis is a change in pH very near to the electrodes. Neither the magnitude nor the spatial extent of this pH variation was measured in our system. Since biological specimens are quite sensitive to pH, it will be necessary to consider this aspect when designing practical systems.
7.2.3.1. Electromagnet Field Strength Since there were no technical specifications available on the electromagnet, the magnetic field strength of the electromagnet was measured as a function of frequency given the same driving voltage using a gauss meter.
A MULTI-FUNCTIONAL MICRO TOTAL ANALYSIS SYSTEM (µTAS) PLATFORM |
141 |
600 |
|
|
|
|
|
|
500 |
|
|
|
|
|
|
400 |
|
|
|
|
|
|
300 |
|
|
|
|
|
|
200 |
|
|
|
|
|
|
100 |
|
|
|
|
|
|
0 |
|
|
|
|
|
|
0.01 |
0.1 |
1 |
10 |
100 |
1000 |
10000 |
Frequency (Hz)
FIGURE 7.5. Bubble current threshold for varying concentrations of NaCl solution as a function of frequency.
Beyond 1 kHz, no magnetic field was observed. For the same driving voltage, the magnetic field strength has a maximum at 60 Hz, where commercially available electromagnets are optimized. Because higher frequencies allow for higher currents in the channel, 1 kHz was chosen to be the operating frequency for our micropump. However, because the electromagnet is not optimized for operation at 1 kHz, the electromagnet consumes high power, up to 2W amplitude. All measurements are done using the Edmund Scientific minielectromagnet.
Other electromagnetic cores are being investigated to allow for operation at higher frequencies with minimal power. At present, the best candidates for an electromagnetic core are ferrite materials or metallic glass (METGLAS). In addition, the magnetic field strength in the channel can be dramatically increased if a second electromagnet is situated above the channel. This configuration was not used in this experiment since the second electromagnet would obscure the view of the channel necessary for flow measurement using the video-capture method.
7.2.3.2. Measurements in AC Magnetohydrodynamic Micropump There are two ways to vary the flow speed in the AC MHD micropump using the maximum current possible in the channel. One is by varying the magnetic field and another is by varying the relative phase between the channel current and the magnetic field. The maximum speed with opposite direction is seen at 0◦ and 180◦ relative phase and no flow is observed at 90◦ relative phase. These are characteristic of any conducting solution with the only difference being the amplitude of the maximum flow speeds. Various concentrations of electrolytic solutions were also tried using the same AC MHD micropump, including solutions at near neutral pH and DNA solutions. These results are summarized in Table 7.1.

142 ABRAHAM P. LEE, JOHN COLLINS, AND ASUNCION V. LEMOFF
TABLE 7.1. Flow velocity and calculated flow rates for other conducting solutions with the same magnetic field of 187 gauss underneath the device and 74 gauss above the device.
|
Flow velocity |
Channel current |
Calculated Flow |
Solution |
(mm/s) |
(mA) |
Rate (µL/min) |
|
|
|
|
1 M NaCl |
1.51 |
140 |
18.3 |
0.1 M NaCl |
0.51 |
100 |
6.1 |
0.01 M NaCl |
0.34 |
36 |
4.1 |
0.01 M NaOH |
0.30 |
24 |
3.6 |
PBS ph = 7.2 |
0.16 |
12 |
1.9 |
Lambda DNA |
0.11 |
10 |
1.3 |
in 5 mM NaCl |
|
|
|
|
|
|
|
7.2.4. MHD Microfluidic Switch
The MHD [17] microfluidic switch is a basic microfluidic logic element that can be implemented by a combination of 2 independently controlled AC MHD micropumps. One microfluidic switch configuration is shown in Fig. 7.6. In this configuration, there are three arms arranged in a “Y” pattern. Arms 1 and 2, the “branches”, each have an identical electrode pair for pumping. Arm 3, the “trunk”, can be switched to either arm 1, arm 2, or some combination. Flow can be in either direction, depending upon the application. When only the pump in arm 1 is actuated (for example in the direction towards arm 3), the flow that is produced divides into both arm 2 and arm 3. In this case, the flow in arm 2 will be in the direction opposite to the flow in arm 1, but with a lower flow rate (since the flow in arm 1 is divided between arms 2 and 3). In order to stop the flow in arm 2, while flow continues from arm 1 to arm 3, the pump in arm 2 must be actuated to produce the necessary pressure to cancel the pressures in that arm. This pressure will in general be smaller than the pumping pressure in arm 1. If the same electromagnet is used to actuate both pumps, then one can switch flow by either tuning the relative electrode current between arms 1 and 2 or by adjusting the phase differences. The latter method was chosen since change in current amplitude may have undesirable effects on the temperature and pH of the solution, and therefore the current amplitude in each branch was fixed throughout the phase switching process.
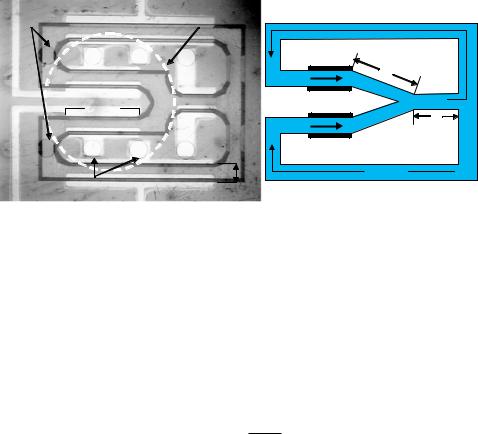
A photograph of a fluidic circuit in which liquid is switched between two flow loops is shown in Fig. 7.7. Although there are additional MHD electrode pairs patterned in arm 3, the upper loop and the lower loop, only the two inner MHD electrode pairs in arms 1 and 2,
Arm 1 |
|
|
P1 |
|
|
|
|
|
Arm 3 |
||||
|
|
|
|
||||||||||
|
|
|
|
|
|
|
|
|
|||||
|
|
|
|
|
|
|
|
|
|
||||
|
|
|
|
|
|
|
|
|
|
||||
|
|
|
|
|
|
|
|
|
|||||
|
|
|
|
|
|
|
|
|
|
|
|||
MHD electrode |
|
pairs |
|
|
Flow |
||||||||
|
|
|
|||||||||||
|
|||||||||||||
|
|
|
|
|
|
|
|
||||||
Arm 2 |
|
|
|
|
|
|
|
|
|
||||
|
|
|
|
|
|
|
|
|
|
|
|
||
|
|
|
|
|
|
|
|
|
|
|
|
||
|
|
|
P2 |
|
|
|
|
|
|
|
|||
|
|
|
|
|
|
|
|||||||
FIGURE 7.6. Conceptual diagram of an MHD microfluidic switch.
A MULTI-FUNCTIONAL MICRO TOTAL ANALYSIS SYSTEM (µTAS) PLATFORM |
|
143 |
||
holes for fluidic |
electromagnet area |
|
|
|
contact |
underneath device |
|
|
|
|
|
|
Q1 |
|
|
|
∆P1 |
L1 |
|
|
|
|
|
|
|
arm 1 |
|
|
R2,Q3 |
|
|
R1 |
|
|
|
arm3 |
Pj |
P3 |
|
|
4 mm |
∆P2 |
||
|
arm 2 |
|
|
L2 |
|
|
|
|
|
holes for electrical |
1 mm |
|
Q2 |
|
contact |
(a) |
(b) |
|
|
|
|
|
||
FIGURE 7.7. (a) Photograph of fluidic switch connecting two flow loops. Only two MHD electrode pairs (arms 1 and 2) are actuated. Channels are 1 mm wide and 300 µm deep and electrode lengths in arms 1 and 2 are 4 mm.
(b) Diagram illustrating the microfluidic switch circuitry.
which are enclosed in the diameter of the electromagnet core, were actuated and switched. The other MHD electrode pairs could be actuated with a larger diameter electromagnet core to cover the entire fluidic circuit layout. As depicted in Fig. 7.7b, the simplified microfluidic circuitry of Fig. 7.7 can be modelled as a linear network. As MHD pump 1 is turned on to exert a pressure P1, flow will be induced in both the upper channel (Q1) and the lower channel (Q2). However, if a counter pressure P2 from MHD pump 2 is gradually increased from zero, it will eventually reach equilibrium resulting in Q2 = 0. The linear fluidic network can be solved using Amphere’s Law and Kirchoff’s Law:
R2
cos φ2 = (7.9)
Ruloop
where φ2 is the phase difference between pumps 2 and 1, R2 the resistance between point j and point 3, and Ruloop the total resistance in the upper loop.
The experimental set up is similar to the AC MHD micropump except that two function generators are phase-locked to drive the two MHD micropumps. Ideally, with the same electromagnet and the same applied electrode current, both arms should produce the same flow. In reality, the flow can differ due to variations in magnetic field strength between the two arms. To compensate for this, a potentiometer was added in series with one of the arms. The potentiometer can be adjusted to ensure that identical flow is produced in each arm for a given input voltage.
Arms 1 and 2 of the microfluidic switch were actuated with the same electrode current of 189 mA and the same magnetic field of 0.024 Tesla underneath the microfluidic switch. Flow could be switched between the two flow arms at a velocity of 0.3mm/sec. While arm 1 was kept at 0◦ relative phase with respect to the electromagnet, the phase of arm 2 was varied to determine the phase required to cancel the flow in that arm. This was found to be approximately 45◦ relative phase. With this phase, flow in arm 2 is completely blocked. This is far off from the calculated 78◦ based on Eq. 7.9, which assumes a linear, sequential resistance circuit diagram. The discrepancy is largely due to the pressure drops along the
144 |
ABRAHAM P. LEE, JOHN COLLINS, AND ASUNCION V. LEMOFF |
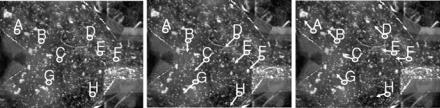
FIGURE 7.8. Tracking 8 particles in 3 consecutive frames 0.033 seconds apart. Arrows show direction of displacement from the previous frame.
cross-sections of the junction that results in viscous swirling. There was also observable leakage at the junctions that may further contribute to the unaccounted pressure drops in channel L2 of Fig. 7.7.
Within the resolution of the measurement system, the switching of flow between the two arms is instantaneous. Fig. 7.8 shows three consecutive video frames, captured at the moment of switching, each separated by 0.033 seconds. Between the first two frames, each of the tracked particles moves in the direction of the second arm, as indicated by the arrows in the diagram. Between the second and third frames, all of the particles have moved in the direction of the first arm, indicating that flow switching has already occurred.
7.2.5. Other MHD Micropumps and Future Work
The Lorentz force can be produced using either a DC or an AC set-up. In a DC configuration, a DC current is applied across the channel in the presence of a uniform magnetic field from a permanent magnet. There have been several DC MHD micropumps presented in the literature. Professor Haim Bau and his group at the University of Pennsylvania have been developing DC MHD micropumps fabricated by low temperature co-fired ceramic tapes [5, 11]. The electrodes pairs were patterned on the bottom of the fluidic channels to drive both mercury and saline solutions. Professor Seung Lee and his group at the Pohang University of Technology in Korea have demonstrated a DC MHD pump in silicon where the electrodes faced each other in the vertical direction while the magnetic field was parallel to the substrate (across the channels) [12]. Practical issues of a DC set-up were reported due to gas bubbles generated by electrolysis at the electrodes that impede fluid [12] flow and cause electrode degradation. Recently, both Manz’ group at the Imperial College in London [9] and van den Berg’s group at the University of Twente [26] have presented µTAS devices using the MHD pumping principle.
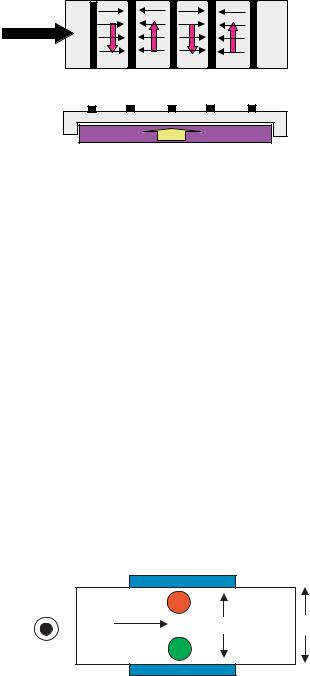
Many other microfluidic devices can be easily implemented on an integrated platform once a microfabrication process is established. Examples of other MHD devices include microfluidic droplet generators, droplet mixers, sample loaders, and various versions of combinatorial mixers. Researchers at the University of Pennsylvania have developed an innovative microfluidic mixer by patterning electrode stripes on the bottom of the flow channel (perpendicular to flow direction) to induce cellular convection [6] (see Fig. 7.9).
There are several challenges that need to be addressed to make MHD microfluidics a viable microTAS platform. First of all, it is critical to understand whether heat generation
A MULTI-FUNCTIONAL MICRO TOTAL ANALYSIS SYSTEM (µTAS) PLATFORM |
145 |
|
|
|
|
Top section |
Flow direction |
|
|
|
|
+ |
- |
+ |
- |
+ |
|
|
|
|
Cross-section |
magnet
B
FIGURE 7.9. Microfluidic mixer in [6] where electrode stripes (black arrows) on the bottom of the flow channel induce flow patterns (red arrows) that split the flow perpendicular to flow direction.
by the electrical current would be detrimental to biological samples. Initial tests on DNA show no effect on the biological viability since subsequent amplification by PCR verified the original sequence. However, heat may degenerate proteins, cells, and other biological constituents. Another challenge is to develop a microfabrication process that can integrate high density MHD microfluidic components on chip-scale platforms. As different length scales are required for different applications, it is important to carry out a parametric study to understand the scaling effects of different parameters (channel dimensions, electrode sizes). Our group is also looking to develop devices with local flow rate feedback control with the integration of MHD micropumps and flow sensors. For AC MHD devices, it is critical to identify high frequency AC magnets at a reasonable cost.
7.3. MICROCHANNEL PARALLEL ELECTRODES FOR SENSING BIOLOGICAL FLUIDS
7.3.1. MHD Based Flow Sensing
Moving charges in the presence of a perpendicular magnetic field are subjected to a force that is both perpendicular to the direction of motion and the magnetic field. The movement of charges due to the magnetic field results in a charge separation as shown in Fig. 7.10.
|
|
a |
|
|
|
-q |
F |
|
v |
|
|
|
|
w |
|
|
|
|
|
B |
|
+q |
F |
|
|
||
|
|
b |
|
FIGURE 7.10. Top view of flow meter. Magnetic field is pointed out of the page. Positive and negative are deflected away from each other due to the Lorentz force.