

Biomolecular Sensing Processing and Analysis - Rashid Bashir and Steve Wereley
.pdf64 |
CENGIZ S. OZKAN ET AL. |
the work presented herein, the requirements are for acute studies only (those where cells are cultured for less than one week). All materials that are in contact with the cellular system (comprising the cells and culture media) must be biocompatible as described above. This includes the substrate, electrodes, chamber housing, adhesives, sealants, tubing, valves, and pumps. Biocompatibility was determined for most materials by culturing the cells of interest with the cells themselves or the culture media in direct contact with the material to be tested. If the cells appeared “normal” under optical inspection and proliferated as expected, the material was deemed biocompatible for the acute studies.
4.3.2. Cell Manipulation Techniques
There are three cell patterning methods that are currently in use. The first is a topographical method, which is based on the various microfabrication schemes involved in developing microstructures that enable the isolation and long-term containment of cells over the substrates [8, 52]. Other fabrication techniques used for cell patterning and the formation of ordered networks involves the development of bio-microelectronic circuits, where the cell positioning sites function as field effect transistors (FET). This provides a non invasive interface between the cell and the microelectronic circuit [42, 59, 107]. These multi-electrode designs incorporating the topographical method have become increasingly complex, as the efficiency of cell patterning, has improved and hence fabrication has become more challenging and the devices are unsuitable for large-scale production. The other drawback is the need for an additional measurement electrode for determining the electrical activity from the electrically excitable cells. The second method is based on micro-contact printing (µCP) where simple photolithography techniques are coupled with the use of some growth permissive molecules (e.g. an aminosilane, laminin-derived synthetic peptide, Methacrylate and acrylamide polymers or poly-L-Lysine) that favor cell adhesion and growth and anti permissive molecules like fluorosilanes to form ordered cell networks [71, 72, 75, 98, 101]. The disadvantage of this technique is the presence of multiple cells on a single patterned site that results in formation of a dense network of cell processes along the patterned areas. This in turn results in difficulties in measurement as well as determination of the electrical activity associated with a specific cell. The third method is based on using biocompatible silane elastomers like polydimethylsiloxane (PDMS). Cell arrays are formed using microfluidic patterning and cell growth is achieved through confinement within the PDMS structure. This technique is hybrid in the sense that it also incorporates µCP for promoting cell adhesion [27, 89]. The drawback of this technique is its complexity. As of today no single technique has been developed that (1) efficiently isolates and patterns individual cells onto single electrodes (2) provides simultaneous electrical and optical monitoring (3) achieves reliable on-site and non-invasive recordings using the same electrode array for both positioning as well as recording.
4.3.3. Principles of Dielectrophoresis (DEP)
Dielectrophoresis, the force experienced by a polarized object in an electric field gradient, has been shown to manipulate and trap submicron particles. When particles are subjected to an electric field, a dipole moment is induced in them. In a nonuniform electric field, a polarized particle experiences a net force, which can translate the particle to high or

CELL BASED SENSING TECHNOLOGIES |
65 |
low field regions termed positive and negative DEP, respectively. This movement depends on the polarizability of the particle relative to that of the medium. In an AC field, positive and negative DEP can be achieved by choosing the appropriate frequencies. The frequency at which there is no force acting on the particle is called the “crossover frequency”.
The dieletrophoretic force acting on a spherical particle of radius r is given by
FDEP = 2πr 3εm Re( fCM) E 2 |
(4.1) |
where εm is the absolute permittivity of the suspending medium, E is the local (rms) electric field, is the del vector operator, and Re(fCM) is the real part of the polarization factor (Clausius-Mossotti factor), defined as
f |
CM = |
(εP − εm ) |
|
(4.2) |
||
|
||||||
|
(ε |
+ |
2ε ) |
|
||
|
|
P |
m |
|
||
In the above equation, εP and εm are the complex permittivity of the particle and the medium respectively, where ε = ε − j σ/ω and ε is the permittivity, σ is the conductivity, ω is the angular frequency of the applied field and j = (−1)1/2 .
At the crossover frequency, fcrossover, Equation (4.1) should be equal to zero. Therefore, the crossover frequency is given by
fcrossover = |
1 |
|
(2σm |
+ |
σP )(σm |
− |
σP ) |
(4.3) |
2π |
(2εm |
+ |
εP )(εm |
− |
εP ) |
|||
|
|
|
|
|
|
|
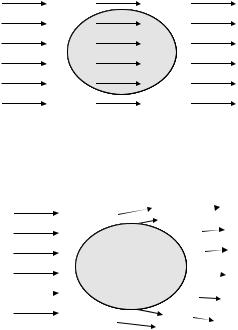
The principle is illustrated schematically in Figure 4.4. If a polarizable object is placed in an electric field, there will be an induced positive charge on one side of the object and an induced positive charge and an induced negative charge (of the same magnitude as the induced positive charge) on the other side of the object. The positive charge will experience a pulling force; the negative charge will experience a pushing force. In a non-uniform field, as depicted in figure 4.4B, the electric field will be stronger on one side of the object and weaker on the other side of the object. Hence, the pulling and pushing forces will not cancel, and there will be a net force on the object.
Biological cells consist of structures of materials which have different electrical properties and will be polarized in a nonuniform electrical field. The suspending medium, usually water or a dilute electrolyte is already a highly polar material. It will itself be strongly pulled toward the region of highest field intensity by the nonuniform electrical field. If the cell is to move to the region of highest field intensity, it must therefore exhibit an even higher specific polarizability. There are several ways the cellular systems can attain the higher polariazabiliy [66]. First, the cell itself is largely composed of water. Second, there are numerous polar molecules dissolved in the intracellular regions including proteins, sugars, DNA, RNA, etc., all of which can contribute to the polarization. Third, there are structured regions which can act as capacitive regions, e.g. lipid across which the electrolytes can act to produce charge distributions. Fourth, there are structured areas in the surface where ionic double layers can produce enormous polarizations. Of all the possible mechanisms, the fourth one is perhaps the most important, especially at frequencies below 10 MHz.
66 |
|
|
|
CENGIZ S. OZKAN ET AL. |
A |
|
Uniform field |
|
|
|
|
Net force = 0 |
|
|
--- |
- |
+ |
+ |
|
|
|
++ |
||
- |
|
|
|
+ |
- |
|
|
|
+ |
-- |
|
++ |
||
B |
Non Uniform field |
||
|
|
|
Net force ≠ 0 |
--- |
- |
+ + |
|
|
++ |
||
- |
|
|
+ |
- |
|
|
+ |
-- |
|
++ |
|
FIGURE 4.4. Schematic description of dielectrophoresis. A In a uniform field, the net force is zero. B In a nonuniform field, the net force is not zero. The direction of the arrows represent the direction of the electric field; and the length of the arrow represents the magnitude of the electric field. Poul, H.A., Dielectrophoresis: The behavior of neutral matter in nonuniform electric fields. 7, Cambridge University Press.
4.3.4. Cell Manipulation Using Dielectrophoresis (DEP)
The first application of dielectrophoresis to living cells was described by Pohl and Hawk [67]. They described what appears to have been the first purely physical means of separating live and dead cells. After that, nonuniform field effects have been shown useful in a variety of biological systems, including algae, bacteria, yeasts, mammalian blood cells, chloroplasts, mitochondria and viruses. DEP is particularly useful in the manipulation and separation of microorganisms and has been employed successfully in isolation and detection of sparse cancer cells, concentration of cells from dilute suspensions, separation of cells according to specific dielectric properties, and trapping and positioning of individual cells for characterization [97], for example, for separations of viable and nonviable yeast cells [40, 53], leukemia and breast-cancer cells from blood, and the concentration of CD34+ cells from peripheral-stem-cell harvests [82], live and dead cells of the same species of small bacteria as Listeria [49]. Previous research in the field of DEP has already shown that small particles and living cells can be manipulated by DEP [25, 54, 57].

CELL BASED SENSING TECHNOLOGIES |
67 |
TABLE 4.1. Parameters for positive and negative DEP for neurons and osteoblasts [68, 104].
|
|
Conductivity of |
Positive |
Negative |
Cross |
|
|
Separation |
buffer solution |
DEP |
DEP |
over |
Vpp |
Cell type |
buffer for DEP |
(mS/cm) |
frequency |
frequency |
frequency |
(Volts) |
|
|
|
|
|
|
|
Neurons |
250 mM |
1.2 |
4.6 MHz |
300 kHz |
500 kHz |
8 |
|
Sucrose/1640 |
|
|
|
|
|
|
RPMI |
|
|
|
|
|
Osteoblasts |
250 mM |
6.07 |
1.2 MHz |
75 kHz |
120 kHz |
2 |
|
Sucrose/ |
|
|
|
|
|
|
Dubecco’s |
|
|
|
|
|
|
modified Eagle |
|
|
|
|
|
|
Medium |
|
|
|
|
|
|
|
|
|
|
|
|
4.3.5. Cell Types and Parameters for Dielectrophoretic Patterning
Mammalian cells that have electrically excitable cell membranes are suitable for cell based sensing. Prasad et al. [68] and Yang et al. [104] used rat hippocampal cells from a H19-7 cell line (ATCC, Inc.) and cells from a primary rat osteoblast culture. Their parameters for DEP isolation and positioning are summarized in Table 4.1. They have established a gradient AC field among electrodes on a microarray device and swept the applied frequency, the peak-to-peak voltage and varied the conductivity of the separation buffer to determine the optimum parameters. Cells under the absence of an electric field have a uniformly distributed negative charge along the membrane surface; on applying a gradient AC field, a dipole is induced based on the cell’s dielectric properties and due to the nonuniform electric field distribution, the electrically excitable cells experience a positive dielectrophoretic force that causes their migration to the electrodes, which are the regions of high electric fields [68, 104]. This constitutes the technique for isolating and positioning the cells over the electrodes.
4.3.6. Biosensing System
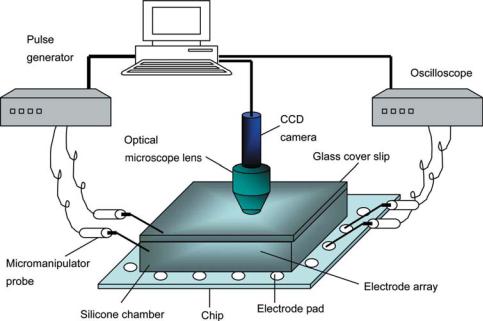
The biosensing system comprises of a chip assembly and an environmental chamber to maintain a stable local environment for accurate data acquisition. The biosensing system is schematically represented in Figure 4.5.
4.3.6.1. Chip Assembly A 4 × 4 microelectrode array comprising of platinum electrodes (diameter: 80 µm, center-to-center spacing: 200 µm) spanning a surface area of 0.88 × 0.88 mm2 on a silicon/silicon nitride substrate with electrode leads (6 µm thick) terminating at electrode pads (100 µm × 120 µm) has been fabricated using standard microlithography techniques [102]. To achieve a stable local microenvironment for sensing, the microelectrode array has been integrated to a silicone chamber (16 × 16 × 2.5 mm3) with a microfluidic channel (50 µm, wide); to pump in the testing agent and pump out the test buffer once the sensing process has been completed. The flow rate of the buffer was 40 µL/min. The silicone chamber was provided with an opening (8 × 8 × 2.5 mm3) and covered by a glass cover slip for in-situ monitoring. Simultaneous electrical and optical monitoring has been achieved by using a MicrozoomTM(Nyoptics Inc, Danville, CA)
68 |
CENGIZ S. OZKAN ET AL. |
FIGURE 4.5. Schematic representation of the measurement system. It provides simultaneous electrical and optical monitoring capability [105].
optical probe station under 8 × and 25 × magnification. The electrical stimulation and measurements were achieved by using micromanipulators (Signatone, Gilroy, CA).
4.3.6.2.Environmental Chamber The optical probe station along with the chip as-
sembly was enclosed by an acrylic chamber (S&W Plastics, Riverside, CA). The environment in the chamber is controlled so as to maintain a constant temperature of 37◦C. A heat gun (McMaster, Santa Fe Springs, CA) inside the chamber heats the air in the chamber and this is linked to a temperature controller (Cole Parmer, Vernon Hills, Illinois) that stops the heat gun from functioning above the desired temperature. A 6” fan (McMaster, Santa Fe Springs, CA) inside the chamber circulates the hot air to maintain temperature uniformity throughout the chamber and is monitored by a J-type thermocouple probe attached to the temperature controller. The carbon dioxide concentration inside the chamber is maintained at 5% and is humidified to prevent excessive evaporation of the medium. This chamber with all of its components will ensure cell viability over long periods of time and stable cell physiology in the absence of the chemical agents.
4.3.7.Cell Culture
4.3.7.1.Neuron Culture The H19-7 cell line is derived from hippocampi dissected from embryonic day 17 (E17) Holtzman rat embryos and immortalized by retroviral trans-
duction of temperature sensitive tsA58 SV40 large T antigen. H19-7 cells grow at the permissive temperature (34◦C) in epidermal growth factor or serum. They differentiate to a neuronal phenotype at the non-permissive temperature (39C) when induced by basic
CELL BASED SENSING TECHNOLOGIES |
69 |
fibroblast growth factor (bFGF) in N2 medium (DMEM-high glucose medium with supplements). H19-7/IGF-IR cells are established by infecting H19-7 cells with a retroviral vector expressing the human type I insulin-like growth factor receptor (IGF-IR). The cells are selected in medium containing puromycin.H19-7/IGF-IR cells express the IGF-IR protein. IGF-IR is known to send two seemingly contradictory signals inducing either cell proliferation or cell differentiation, depending on cell type and/or conditions. At 39◦C, expression of the human IGF-IR in H19-7 cells induces an insulin-like growth factor (IGF) I dependent differentiation. The cells extend neuritis and show increased expression of NF68. This cell line does not express detectable levels of the SV40 T antigen. Following spin at 100 × g for 10 minutes at room temperature; cells were re-suspended in a separation buffer (see Table 4.1). The density of the re-suspended cells (2500 cell/mL) ensured single cell positioning over individual electrodes. Separation buffer used for neurons contained 250 mM sucrose/1640 RPMI (Roswell Park Memorial Institute), with a conductivity of 1.2 mS/cm and a pH of 7.48. The separation buffer was replaced by a buffer comprising of minimum essential medium/10% Fetal Bovine Serum (FBS)/5% Phosphate buffer saline (PBS) of conductivity 2.48 mS/cm and pH of 7.4 suitable for cell viability.
4.3.7.2. Primary Osteoblast Culture Primary rat osteoblast cells were cultured to a concentration of 10,000 cells in 1 mL for sensing experiments. To achieve the patterning of a single cell over a single electrode, a 10 µL of cell culture solution was mixed with 500 µL Dulbeco modified eagle medium (DMEM; Gibco, Grand Island NY) supplemented with 10% fetal bovine serum (FBS; Gibco, Grand Island NY), 100 µg/mL penicillin, and 100 µg/mL streptomycin (P/S; Gibco, Grand Island NY). The cells were centrifuged and re-suspended in 1 mL of separation buffer consisting of 1:9 dilutions of Phosphate Buffer Saline 250 mM Sucrose (Sigma, St Louis) and de-ionized water (weight/volume). The conductivity of the separation buffer was 4.09 mS/cm and with a pH of 8.69. The separation buffer was replaced with a test buffer ((DMEM)/Fetal Bovine Serum (FBS)/Phosphate Buffer Saline (PBS)) with conductivity of 2.5 mS/cm and a pH of 8.06.
4.3.8. Experimental Measurement System
Figure 4.5 shows a schematic representation of the measurement system. It comprises of extracellular positioning, stimulating and recording units. The cells were isolated and positioned over single electrodes by setting up a gradient AC field using an extracellular positioning system comprising of a pulse generator (HP 33120A) and micromanipulators (Signatone, Gilroy, CA). The signal from the pulse generator was fed to the electrode pads of the selected electrodes using the micromanipulators. The extracellular recordings from the individual osteoblasts obtained from the electrode pads were amplified and recorded on an oscilloscope (HP 54600B, 100 MHz). The supply and measurement systems were integrated using a general purpose interface bus (GPIB).
4.4. MEASUREMENTS
4.4.1. Long Term Signal Recording in vivo
In essence, signals can be obtained from the microelectrodes which are related to the action potentials (Figure 4.6). The extracellular electrodes record a current which provides
70 |
CENGIZ S. OZKAN ET AL. |
(A)
(B)
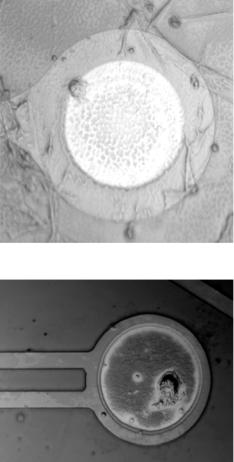
FIGURE 4.6. Single Neuron positioned on the surface of microelectrode. A. single neuron adhered to the edge of microelectrode due to dielectric potential trap (DEP); B. single neuron well spread over the surface of a microelectrode [106].
a voltage in the external load impedance. The magnitude and temporal characteristics of an action potential so recorded depends on local conditions, e.g. when axons cross the bare surface of an electrode, the resulting signal-to-noise ratios (SNR) are high. The electrodes produce signals that resemble action potentials in shape when the electrode sealing to the cell is good, i.e. impedance to earth is very high. The relative impedances of the electrode paths determined both the magnitude and the form of the signal.
The form of the extracellular signal changed with the condition of the sealing of cells over the electrodes. Poor sealing between cells and electrodes resulted in signals with low S/N ratios and the quality of the signal recorded from a neuron with a good sealing over the electrode improved due to an increase in the sealing (interfacial) impedance. Figure 4.7
CELL BASED SENSING TECHNOLOGIES |
71 |
Intracellular signal
20mv
Extracellular signal
50 v
(A)
Intracellular signal
20mv
Extracellular signal
1mv
(B)
Intracellular signal
20mv
Extracellular signal
1mv
(C)
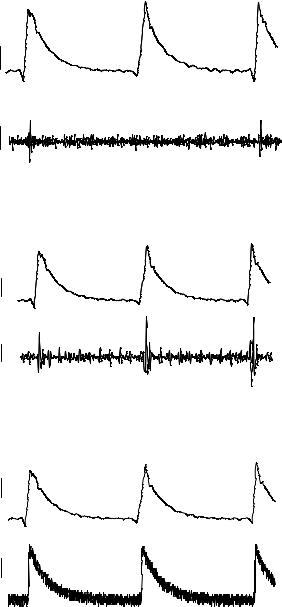
FIGURE 4.7. Effect of cell-electrode interfacial sealing conditions on the quality of signals recorded via the microfabricated electrodes. A. Poor sealing conditions. B. Better sealing conditions. C. Excellent sealing conditions. Cells were well spread over the surface of the microelectrodes, and the shape of the extracellular signal spectrum is similar to that of the intracellular signal [106].
72 |
CENGIZ S. OZKAN ET AL. |
illustrates three such examples in which the top traces are intracellular signals and the lower traces are the corresponding extracellular recordings. In the first example, the sealing condition was not good and the amplitude of the recorded extracellular signal was very small (50–80 µV). In the second and third examples, the cell had spread well over the electrode and a larger amplitude extracellular signal was recorded (2–5 mV). A clear relationship must exist between the amplitude of the signal and the degree of sealing over the electrode. The other feature to note is that as the sealing conditions become better, the signal shape becomes similar to that of the intracellularly recorded changes and not the differential signal (Figure 4.7 (c)).
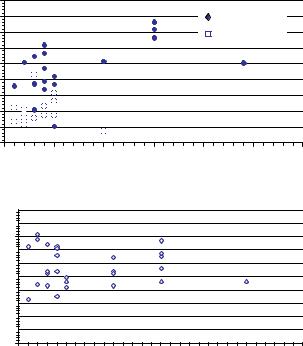
The capped microelectrode array is a highly stable recording environment primarily because the electrodes do not invade the cell membrane and do not vibrate or slip relative to the neural components. However, the number of active electrodes with sufficiently high SNRs can vary from culture to culture and are influenced by the neuronal cell density, glial density and the size of the adhesion island over the recording matrix. They don’t seem to be greatly affected by the age of the culture patterned on the electrodes. A statistical interpretation of the active electrodes with mean and maximum SNRs as a function of culture age are provided in Figure 4.8. The value of maximum and mean SNRs were around
|
18 |
|
|
|
|
|
|
SNR |
16 |
|
|
|
|
Max SNR |
|
14 |
|
|
|
|
MeanMax SNR |
|
|
12 |
|
|
|
|
|
|
|
-Max |
|
|
|
|
|
|
|
10 |
|
|
|
|
|
|
|
SNR |
8 |
|
|
|
|
|
|
6 |
|
|
|
|
|
|
|
Mean |
|
|
|
|
|
|
|
4 |
|
|
|
|
|
|
|
2 |
|
|
|
|
|
|
|
|
|
|
|
|
|
|
|
|
0 |
|
|
|
|
|
|
|
0 |
5 |
10 |
15 |
20 |
25 |
30 |
Hours in vitro
Percent Electrodes Active
100
90
80
70
60
50
40
30
20
10
0
0 |
5 |
10 |
15 |
20 |
25 |
30 |
Hours in vitro
FIGURE 4.8. Long term in vivo studies of signal-to-noise ratio (SNR) [106].
CELL BASED SENSING TECHNOLOGIES |
73 |
10 and 4 respectively. It was also observed that there was no obvious trend of a decrease in the value of the SNRs even after many hours of in vivo sensing.
4.4.2. Interpretation of Bioelectric Noise
The amplitude distribution of a biological noise signal usually yields little information about the membrane events that give rise to the observed noise. This difficulty arises for two reasons. First, the calculated shape of an amplitude distribution may be characteristic of noise generated by more than one mechanism. Second, the shape of the distribution may alter the frequency of the underlying membrane event itself. This means a single noise generating process can give rise to signals with widely differing amplitude distributions. In order to determine the probable membrane mechanisms underlying a biological noise signal, it is necessary to analyze the signal with respect to its frequency composition. This analysis is carried out using the methods of fluctuation statistics and fast Fourier transformation (FFT).
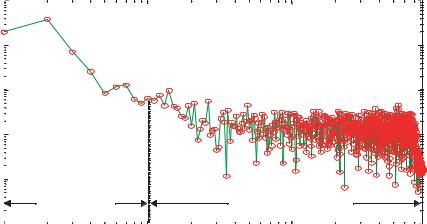
In the low frequency range (f = 1 10 Hz), the presence of Johnson noise in cell membranes is usually obscured by other forms of biological noise which display greater intensity (Figure 4.9). The shape of 1/f noise can be seen in this frequency band (1 10 Hz) which contributes more than the other noise sources. After the 100 Hz boundary, a steady “platform” is observed in the frequency spectra where Johnson noise is the dominating content of the biological noise which is independent of frequency and the amplitude of the 1/f noise becomes negligible with increasing the frequency. Actually, in the high frequency range (f > 100 Hz), Johnson noise is always shadowed by the appearance of a capacitative current noise signal which arises from voltage fluctuations in the recording apparatus.
|
10 - 2 |
|
|
|
10 - 3 |
|
|
Amplitude |
10 - 4 |
|
|
10 - 5 |
|
|
|
|
|
|
|
|
10 - 6 |
|
|
|
|
1/f noise |
Johoson noise |
|
10 - 7 |
101 |
10 2 |
|
10 0 |
||
|
|
Frequency |
(Hz) |
FIGURE 4.9. Frequency domain of noise signal from a single neuron coupled to a microelectrode [106].