

Biomolecular Sensing Processing and Analysis - Rashid Bashir and Steve Wereley
.pdf22 MIN YUE, ARUN MAJUMDAR, AND THOMAS THUNDAT
|
Target Molecule |
|
Probe Molecule |
|
Coating |
Substrate |
Cantilever |
|
Target Binding
Deflection, ∆h
Substrate
FIGURE 2.1. Specific biomolecular interactions between target and probe molecules alter intermolecular interactions within a self-assembled monolayer on one side of a cantilever beam. This can produce a sufficiently large surface stress to bend cantilever beam and generate motion.
similar to DNA microarrays based on fluorescence technology [2, 9, 10, 17, 22], chemiluminescence detection [2, 9, 13, 15, 16, 33] or radioisotope labeling [8, 39]. Despite the popularity of these protein microarrays, they share a major disadvantage in that labeling is necessary for detections. While the labeling process is itself costly and time-consuming, the issue is more acute since proteins are very labile and their activities can be readily affected by labeling [10]. Surface plasmon resonance (SPR) and the cantilever platform thus are very attractive as both of them are label-free technologies and are capable of yielding kinetic as well as equilibrium information of the biomolecuar interactions. However, multiplexing SPR remains challenging because binding in SPR is measured as an integrated effect over a relatively large area of the surface. Measuring binding of small molecules is another limitation of SPR. For example, it is difficult for SPR to detect phosphorylation of proteins, but it is possible to do so with cantilevers. Hence, the microcantilever platform offers an unparalleled opportunity for the development and mass production of extremely sensitive, low-cost sensors for real-time sensing of many chemical and biochemical species. A major advantage of using cantilevers is that it is a common platform for all reactions because it measures free energy change.
Microcantilevers have been demonstrated as chemical and biological sensors in past decade [4, 5, 6, 7, 12, 21, 28, 29, 32, 34, 35]. While all earlier work focused on studying individual reactions using single cantilever system similar to the one in Figure 2.2, a truly high-throughput technique was missing. Microcantilevers are readily adapted for fabricating multi-element sensor arrays, thus allowing high-throughput multi-analyte detection. In this chapter, we will discuss the principles of operations and the emergence of functional microcantilever arrays.
2.2. THEORY
As molecular reactions on a surface is ultimately driven by free energy reduction of the surface, the free energy reduction leads to a change in surface tension or surface stress.
CANTILEVER ARRAYS |
|
23 |
Position- |
|
|
sensitive |
Laser |
|
detector |
|
|
|
|
Micromechanical |
|
|
cantilever |
|
|
Liquid |
|
Fluid cell |
output |
Liquid |
|
|
input |
|
|
Glass slide |
|
|
|
|
O-ring |
Thermoelectric |
|
|
cooler |
|
|
Temperature |
Heat sink |
|
sensor |
|
|
|
|
FIGURE 2.2. Schematic diagram of the experimental setup used by Wu et al. [35]. A cantilever was mounted in a fluid cell which allows liquid exchange through I/O ports. A laser was reflected off the cantilever and focused onto a PSD.
While this produces no observable macroscopic change on the surface of a bulk solid, the adsorption-induced surface stresses are sufficient to bend a cantilever if the adsorption is confined to one surface of the beam. However, adsorption-induced forces should not be confused with bending due to dimensional changes such as swelling of thicker polymer films on cantilevers. The sensitivity of adsorption-induced stress sensors can be three orders of magnitude higher than those of frequency variation mass sensors (for resonance frequencies in the range of tens of kHz) [30]. Moreover, the static cantilever bending measurement is ideal for liquid-based applications where frequency-based cantilever sensors suffer from huge viscous damping.
Using Stoney’s formula, the deflection at the end of a cantilever, z, can be related to the differential surface stress, σ , as [20, 26]
z = |
3σ (1 − v) |
|
L |
2 |
(2.1) |
E |
|
||||
|
|
d |
|
||
where d and L are the cantilever beam thickness and length, respectively; E and v are the elastic modulus and the Poisson ratio of the cantilever material, respectively. Equation 2.1 shows a linear relation between cantilever bending and differential surface stress. For a silicon nitride cantilever of 200 µm long and 0.5 µm thick, with E = 8.5 × 10¹⁰ N/m2 and v = 0.27 [36], a surface stress of 0.2 mJ/m2 will result in a deflection of 1 nm at the end. Because a cantilever’s deflection strongly depends on geometry, the surface stress change, which is directly related to biomolecular reactions on the cantilever surface, is a more convenient quantity of the reactions for comparison of various measurements. Changes in free energy density in biomolecular reactions are usually in the range of 1 to 50 mJ/m2, or as high as 900 mJ/m2.
The ultimate noise of a cantilever sensor is the thermal vibrational motion of the cantilever. It can be shown from statistical physics [23] that for off-resonance frequencies, thermal vibrations produce a white noise spectrum such that the root-mean-square vibrational noise, hn , can be expressed as
hn = |
|
kπ f0 Q |
(2.2) |
|
|
|
|
2kB TB |
|
24 |
MIN YUE, ARUN MAJUMDAR, AND THOMAS THUNDAT |
Here, kB |
is the Boltzmann constant (1.38 × 10⁻²³ J/K), T is the absolute temperature |
(300 K at room temperature), B is the bandwidth of measurement (typically about 1000 Hz for dc measurement), f0 is the resonance frequency of the cantilever, k is the cantilever stiffness, and Q is the quality factor of the resonance with is related to damping (in liquid Q 1). Thermal vibration noise of silicon or silicon nitride cantilevers generally falls in the sub-nm range, which is negligible compared to noise from the detection system. The practical sensing limitation by noise will be discussed in the following for each detection technique.
2.3. READOUT TECHNIQUES
The most common readout technique for cantilever deflection is the optical beam deflection technique. Deflection of a cantilever is transduced into the change in the direction of a light beam reflected off the cantilever. Interferometry optics has also been adapted to read out cantilever motion, in which the deflection is detected by its relative movement to a reference cantilever or substrate. Another attractive readout technique is based on piezoresistivity, whereby the bulk electrical resistivity varies with applied stress. Here, we describe a few examples on how these techniques have been applied to develop cantilever microarrays.
2.3.1. Optical Beam Deflection of 1D Cantilever Array
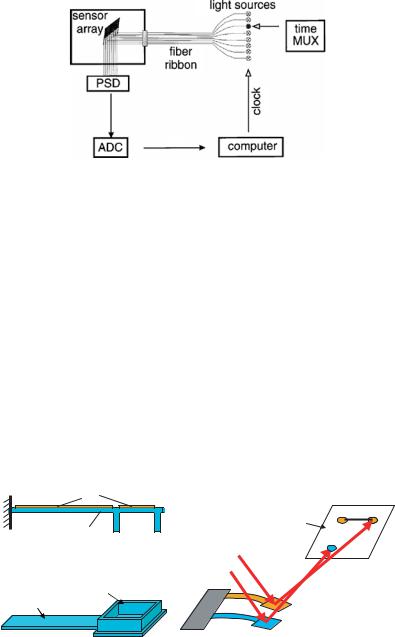
In an optical beam deflection readout system, a light beam from a laser is focused at the end of the cantilever and reflected to a position sensitive detector (PSD) [24]. The bending of the cantilever results in a large change in the direction of the reflected beam, which can be detected by the PSD signal. Direct multiplexing of such readout of N cantilevers requires the same number of light sources and detectors. Though it could be realized for a few cantilevers, it is far from practical to develop high-throughput cantilever arrays. Using a better approach of multiplexing, Lang et al. [14] demonstrated sequential position readout from an array of eight cantilevers for gas sensing (Figure 2.3). Light from eight individual light sources was coupled into an array of multimode fibers and guided onto the sensor array. Upon reflection, the light was collected by a PSD. The eight light sources were switched on and off individually and sequentially at 1.3Hz. Using a time-multiplexed vertical cavity surface-emitting laser (VCSEL) array and a single linear PSD, the same group further developed this technique for sensing of DNA hybridization and protein interactions [3, 7, 19]. The cantilever deflection is calculated with an accuracy of 0.1 nm [20]. However, scaling-up of this readout technique to thousands of cantilevers is very challenging. As one light source is used for each cantilever, it will be difficult to implement for arrays of thousands of cantilevers. On the other hand, linear PSD will not be suitable for detecting the deflections of cantilevers in 2D format.
2.3.2. Optical Beam Deflection of 2D Array
Yue et al. [36, 37] developed an innovative whole-field optical readout system for 2D cantilever array based on optical beam deflection technique. The cantilevers are specially
CANTILEVER ARRAYS |
25 |
FIGURE 2.3. Schematic setup of optical beam deflection readout system for 1D cantilever array. Quasisimultaneous readout of eight sensors is achieved by time-multiplexing (MUX) eight light sources which are guided by an optical fiber-ribbon onto the sensor array located in the analysis chamber. The reflected light from the sensors’ surface is collected by a PSD, then digitized by an analog-to-digital converter (ADC) and stored in a computer memory for further analysis. The computer also generates the clock pulse for time-multiplexing [14].
designed to enable multiplexed optical readout, as shown in Figure 2.4. Similar to traditional cantilevers, low-pressure chemical vapor deposited (LPCVD) low-stress silicon nitride (SiNx) was used as the structural material of the cantilevers. A thin gold film was deposited and patterned on one side of the cantilevers to allow immobilization of biomolecules through gold-thiol (Au-S) bonds, as well as to cause enough initial bending in the cantilever beam. However, the rigid paddle at the end of the cantilever, which could act as a flat mirror, made the cantilever different from other traditional ones. The high rigidity of the paddle, or its flatness, was achieved through a close square ridge structure on the paddle that produced a high moment of inertia in that region. The thin arm of the cantilever was usually curved due to the residue stress in and between the gold and silicon nitride layers. When a collimated light beam illuminated the whole area of a cantilever array, the initial curvature of each cantilever diverged the reflection from the thin beam so that only
Au |
SiNx
(A)
Ridge
Thin beam
CCD Image Screen
Collimated light beam
(B) |
(C) |
FIGURE 2.4. Innovative cantilever design for optical readout of 2D array. (A) Side view of a cantilever made of silican nitride. Top surface is coated with gold. (B) 3D illustration of the cantilever and the ridge structure on the paddle. (C) A collimated light beam illumination two cantilevers simultaneously. Only reflection from the paddles can be collected on an image screen.
26 |
MIN YUE, ARUN MAJUMDAR, AND THOMAS THUNDAT |
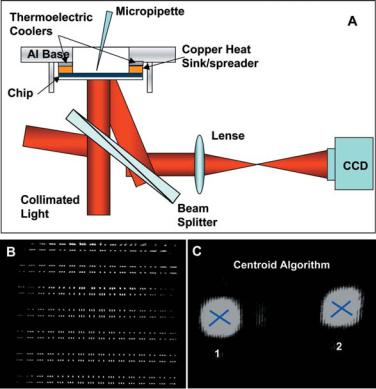
FIGURE 2.5. (A) Whole-field optical readout system; (B) A CCD snap shot of about 500 spots, each spot corresponding to the reflection of the laser beam from the paddle of a cantilever; (C) Individual spot tracking using a centroid algorithm in Matlab.
reflection from the flat paddles could be collected. The initial curvature of cantilevers also enabled the reflections from the flat paddles at the end of the cantilevers form collimated beams in a particular direction, which could then be separated from spurious reflections and directed towards a charged couple device (CCD) camera for imaging (Figure 2.5A). If a cantilever bends, the angle of its paddle and thereby the direction of the reflected light will change, causing the spot to move on the CCD screen. Figure 2.5B shows a CCD image of an entire cantilever array chip, where each spot corresponds to the reflection from the paddle of an individual cantilever. Any motion of a cantilever leads to corresponding motion of the CCD spot, which can be quantified using ray optics. Following acquisition by the CCD camera, images were transferred to a Matlab script, which tracks each cantilever paddle image “spot”, by calculating the intensity centroid of each spot (Figure 2.5C).
The thermal bimorph effect of the SiNx-Au cantilevers results in cantilever motion when temperature fluctuates. A 10 mK change in the temperature can cause 2.5 nm end deflection of a silicon nitride cantilever (200 nm long, 0.5 µm thick) with 25-nm thick gold coating. Another major source of the measurement noise is the photon shot noise of the CCD camera. With a typical optical setup, the measurement noise caused by CCD shot noise equals about 3-nm deflection of the same kind of cantilever [38]. The total system
CANTILEVER ARRAYS |
27 |
noise is the superposition of major noises and can be equivalent to change in surface stress of 0.5 mJ/m2.
2.3.3. Piezoresistive Cantilever Array
Besides optical approaches, cantilever motion can also be read out electronically. Doped silicon exhibits a strong piezoresistive effect [31]. The resistance of a doped region on a cantilever can change reliably when the cantilever is stressed with deflection. Thaysen et al. [27] developed piezoresistive cantilever sensors with integrated differential readout. Each cantilever had a thin fully encapsulated resistor made of doped Si fabricated on top, of which the resistance would change due to any load on the cantilever. Each sensor was comprised of a measurement cantilever and a built-in reference cantilever, which enabled differential signal readout. The two cantilevers were connected in a Wheatstone bridge and the surface-stress change on the measurement cantilever was detected as the output voltage from the Wheatstone bridge. The researchers later applied the sensor for DNA sensing [18]. The typical signal-to-noise ratio of the resistance measurement was 26 during the experiments. For cantilevers which were 150 µm long, 40 µm wide and 1.3 µm thick, the surface stress sensitivity was R/Rσ −1 = 0.44 mJ/m2, where R/R was the relative change in the resistance of integrated piezoresistor. The sensor was determined to have a minimum detectable surface-stress change of approximately 5 mJ/m2.
Electro-readout technique has several advantages over optical leverage. As electronics for detection is integrated, the sensors can be operated in any solutions, even non-transparent liquids, since the refractive indices of the liquids do not influence the detection. Because no external optics components are required, the sensors integrated with readout electronics can be made very portable suitable for field detections. It is also easy to realize an array of cantilevers with integrated readout, as both cantilevers and readout circuits can be fabricated simultaneously. However, the piezoresistive cantilever sensors developed so far are one order of magnitude less sensitive than those using optical readout techniques. One has to overcome the challenges of improving the sensitivity to develop piezoresistive cantilever arrays for high-throughput biomolecular sensing.
2.4. MICROFLUIDICS
One of the challenges in multiplexing is how to functionalize individual cantilevers. Some researchers have achieved this by inserting cantilevers to microcapillary arrays separately [3, 19]. While this is acceptable for 1D arrays, such an approach is difficult to implement for 2D arrays. Integrating microfluidic chambers with cantilevers provides physical separation for cantilevers thus a direct means for multiplexed experiments. Figure 2.6 illustrates a microfluidic reaction chamber comprised cantilevers, silicon substrate and glass cap [37]. Each such reaction well contains a large fluidic inlet (called big I/O) and two small fluidic outlets (called small I/O). The small I/O is designed to prevent vapor bubbles to be trapped, such that when a fluid sample is injected into the big I/O the gas was ejected through the small I/O’s. To effectively combat the inaccuracies arising from sensor drift and fabrication variations between sensors, the design also includes multiple cantilevers per reaction chamber, each of which received the same analytes at all stages of an experiment. The response from all the sensors in a given reaction well

28 |
MIN YUE, ARUN MAJUMDAR, AND THOMAS THUNDAT |
FIGURE 2.6. Schematic diagrams of fluidic design (side view of a bonded reaction well and top view of the Si chip). A single reaction well containing fluidic inlets and outlets in the silicon chip, multiple cantilevers, and the transparent glass/PDMS cover for the laser beam to be used for measuring cantilever deflection.
could then be used to obtain a more statistically relevant response for each well. In order to use the cantilever array chip as a multiplexed sensor array, each reaction well must be physically separated from the neighboring wells. This is achieved using a pyrex substrate that is patterned and etched to produce the reaction well, and bonded to the silicon chip. The bonding is accomplished using an adhesive stamping technique [25]. The fabrication process for the cantilever array chip utilizes conventional microelectromechanical systems (MEMS) fabrication including bulk and surface micromachining, which are described in detail by Yue et al. [36, 37]. The yield (percent of cantilevers on each chip surviving the fabrication process) achieved from this fabrication process ranged from 95–98%. Figure 2.7 shows optical and electron micrographs of the cantilever array chip.
2.5. BIOMOLECULAR REACTION ASSAYS
The microcantilever arrays enable multiplexed label-free analysis for various biomolecular reactions. In this section, we describe recent work on detecting specific biomolecular interactions such as DNA hybridization and antibody-antigen bindings [7, 36, 37].
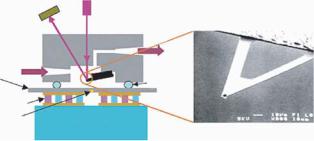
FIGURE 2.7. (A) A cantilever array chip containing a 2-D array of reaction wells, each well containing multiple cantilevers. The array is roughly the size of a penny; (B) Electron micrograph of a single reaction well showing 7 cantilever beams, a big inlet/outlet (I/O) port and two small I/O ports.
CANTILEVER ARRAYS |
|
|
|
|
|
|
|
|
|
|
29 |
||
|
10 |
|
|
A |
|
10 |
|
|
|
B |
|
|
|
|
|
|
|
WELL #1 |
|
|
|
|
|
WELL #1 |
|
||
|
|
|
|
|
|
|
|
|
|
|
|
||
|
0 |
|
|
|
|
0 |
|
|
|
|
|
|
|
|
|
|
|
|
|
|
|
|
|
|
|
|
|
2) |
|
|
|
|
|
-10 |
|
|
|
|
|
|
|
-10 |
|
|
|
|
|
|
|
|
|
|
|
|
|
(mJ/m |
|
|
|
|
|
|
|
|
|
|
|
|
|
|
1-1 |
|
|
|
-20 |
|
|
|
|
|
|
|
|
-20 |
|
|
|
|
|
1-1 |
|
|
|
|
|
||
1-2 |
|
|
|
-30 |
|
|
|
|
|
|
|||
|
|
|
|
|
1-2 |
|
|
|
|
|
|||
stress |
|
|
|
|
|
|
|
|
|
|
|||
|
1-3 |
|
|
|
|
|
|
|
|
|
|||
|
|
|
|
|
|
|
|
|
|
|
|||
|
|
|
|
|
|
1-3 |
|
|
|
|
|
||
-30 |
1-4 |
|
|
|
|
|
|
|
|
|
|
||
|
|
|
-40 |
|
1-4 |
|
|
|
|
|
|||
|
|
|
|
|
|
|
|
|
|
|
|||
|
|
|
|
|
|
|
Non-complementary |
Complementary |
|||||
surface |
-40 |
|
|
|
|
-50 |
|
||||||
|
Thiolated ssDNA injected |
|
|
DNA injected |
90 |
DNA injected |
|
||||||
10 |
0 |
40 |
6 |
|
10 |
|
0 |
60 |
120 |
150 |
|
||
|
|
|
WELL #2 |
|
|
|
|
|
WELL #2 |
|
|||
|
|
|
|
|
|
|
|
|
|
|
|||
0 |
|
|
|
|
0 |
|
|
|
|
|
|
|
|
in |
|
|
|
|
|
|
|
|
|
|
|
||
|
|
|
|
|
|
|
|
|
|
|
|
||
|
|
|
|
|
|
|
|
|
|
|
|
|
|
Change |
-10 |
|
|
|
|
-10 |
|
|
|
|
|
|
|
|
|
|
|
|
|
|
|
|
|
|
|
||
|
|
|
|
|
-20 |
|
|
|
|
|
|
|
|
-20 |
2-1 |
|
|
|
|
|
2-1 |
|
|
|
|
|
|
|
|
2-2 |
|
|
|
-30 |
|
|
|
|
|
|
|
|
|
|
|
|
|
2-2 |
|
|
|
|
|
||
|
|
2-3 |
|
|
|
|
|
|
|
|
|
|
|
|
-30 |
|
|
|
|
|
2-3 |
|
|
|
|
|
|
|
2-4 |
|
|
|
-40 |
|
|
|
|
|
|
||
|
|
|
|
|
|
2-4 |
|
|
|
|
|
||
|
|
|
|
|
|
|
|
|
|
|
|
|
|
|
-40 |
|
|
|
|
-50 |
|
|
|
|
|
|
|
|
0 |
20 |
40 |
60 |
80 |
100 |
0 |
30 |
60 |
90 |
120 |
150 |
180 |
|
|
|
|
|
|
Time (min) |
|
|
|
|
|
||
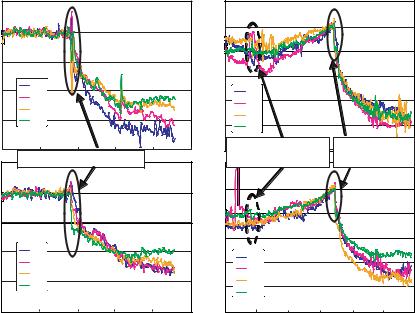
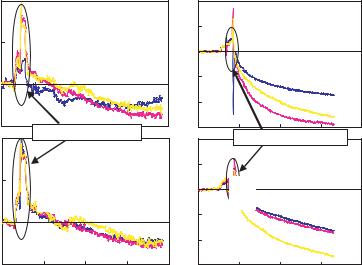
FIGURE 2.8. Deflections of eight cantilevers plotted as a function of time for: (A) DNA immobilization in wells 1 and 2, each well containing four cantilevers; (B) DNA hybridization in the two wells. Dashed circles represent the injection of non-complementary DNA. Solid circles represent the injection of complementary DNA.
2.5.1. Detection of DNA
Single-stranded DNA (ssDNA) can be immobilized using gold-thiol strong bonding on one side of a cantilever by coating that side with gold and using a thiol linker at one end of ssDNA. Single-stranded DNA bound to the cantilever acts as the probe (or receptor) molecule for the target complementary strands. Figure 2.8A shows surface stress change in the cantilevers as a function of time when ssDNA was bound to the cantilevers, a.k.a. probe immobilization. In this case, thiolated ssDNA (25-mer oligonucleotide) was injected into two different wells, each of which contained 4 cantilevers respectively. The motion of the cantilevers in multiple wells was monitored simultaneously. Such immobilization resulted in a surface stress change of approximately 25 ± 5 mJ/m2. The cantilevers were washed several times and re-equilibrated in phosphate buffer after the immobilization was complete. Afterwards, 8µM non-complementary DNA was first injected into the wells in which the cantilevers were functionalized with the thiolated-ssDNA. Only marginal deflection was observed for the non-specific binding (Figure 2.8B). The 5µM complementary DNA was injected to these wells after an hour or so. The specific binding between the DNA strands caused significant deflection of all the cantilevers, corresponding to the surface stress change of 35 ± 5 mJ/m2. These experiments clearly demonstrated that ssDNA immobilization and DNA hybridization on the gold surface induced significant cantilever deflection while
30 |
MIN YUE, ARUN MAJUMDAR, AND THOMAS THUNDAT |
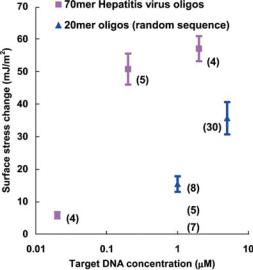
FIGURE 2.9. Summary of quantitative cantilever response to DNA hybridization plotted as a function of target DNA concentration. The numbers in the parenthesis denotes the number of reaction used for statistical analysis.
the deflection from non-specific binding was almost negligible. As evident in Figure 2.8, both reaction steps produced repeatable deflections from the four cantilevers within the same well. Furthermore, the cantilevers in different wells also showed the same degree of deflections, indicating the well-to-well consistency. Figure 2.9 summarizes the quantitative experimental results obtained for DNA hybridization, with DNA of different length and for different target concentrations. Each point represents the average value of the hybridization signals obtained from multiple cantilevers and the error bar is the standard deviation of the signals. The number in the parenthesis next to each point is the number of the cantilevers from which the signals were obtained. It is very clear that the hybridization at lower target DNA concentration caused smaller deflection of the cantilevers, which indicates the equilibrium of the DNA hybridization reaction depended on the DNA concentrations. Figure 2.9 also shows that the hybridization between longer DNA single-strands resulted in larger deflection of the cantilevers, which suggests the total free energy reduction in longer DNA’s hybridization is more than that of the shorter ones.
These experiments clearly demonstrate the capability of the multiplexed cantilever chip to quantitatively detect DNA immobilization and hybridization. The platform allows one to rapidly search the parameter space of DNA hybridization, and thus help to understand the origin of nanomechanical forces that lead to cantilever deflection, as well as the dependence of such deflection on the identity and concentration of the target molecules.
2.5.2. Detection of PSA
Antibody-antigen interactions are a class of highly specific protein-protein bindings that play a critical role in molecular biology. When antibody molecules were immobilized to one surface of a cantilever, specific binding between antigens and antibodies produced surface
CANTILEVER ARRAYS |
31 |
Change in surface stress (mJ//m2)
10 |
|
30 |
|
|
|
A |
Well #3 |
|
|
B |
Well #1 |
|
15 |
|
|
||
5 |
|
0 |
|
|
|
|
|
|
|
|
|
0 |
|
-15 |
|
|
|
|
|
|
|
|
|
|
|
-30 |
|
|
|
-5 |
|
-45 |
|
|
|
Injection of 1 mg/ml HSA |
30 |
Injection of 20 |
g/ml fPSA |
||
10 |
|
0 |
60 |
9 |
|
|
|
|
Well #4 |
|
|
|
|
Well #2 |
|
|
|
|
|
|
15 |
|
|
|
|
5 |
|
|
|
|
0 |
|
|
|
|
|
A |
|
|
|
B |
|
|
|
|
|
|
|
|
|
|
|
|
||
0 |
|
|
|
|
-15 |
|
|
|
|
|
|
|
|
|
|
|
|
|
|
|
|
|
|
|
-30 |
|
|
|
|
-5 |
|
|
|
|
-45 |
|
|
|
|
0 |
30 |
60 |
90 |
120 |
0 |
30 |
60 |
90 |
120 |
Time (min)
FIGURE 2.10. Deflections of 12 cantilevers in 4 wells plotted as a function of time for protein binding. (A) Non-specific binding of HSA to the MAH-PSA on cantilever surface; (B) Specific binding between injected PSA and the MAH-PSA on cantilever surface.
stress change in the cantilever. Figure 2.10 shows surface stress change in cantilevers as a function of time for quantitative detection of prostate-specific antigen (PSA) using human serum albumin (HSA) as controls. The antibody specific to PSA, mouse anti-human antibody (MAH-PSA), was immobilized to the gold surface of cantilevers using a cross-linker, 3,3 - Dithiobis [sulfo-succinimidylpropionate] (DTSSP). 2-[Methoxy(polyethylenoxy)propyl] trimethoxysilane (PEG-silane) was immobilized on the nitride surface of the cantilevers to block the non-specific absorption of proteins [37]. As HSA only non-specifically binds to MAH-PSA, the cantilevers deflected negligibly upon injection of HSA to the chambers which contained cantilevers functionalized with MAH-PSA. Injection of PSA to other two similar wells resulted in surface stress change of 30 ± 10 mJ/m2 due to the specific binding between the antigens and antibodies on the cantilever surface. These experiments clearly demonstrated multiplexed protein interaction assay using the microcantilever array.
2.6. CONCLUSIONS
Experimental and theoretical research has shown that when reactions on one surface a cantilever beam, they induce cantilever bending. This occurs increase the free energy reduction of the reaction even at the cost of increase free energy of the cantilever by bending it. Since the cantilever strain energy can be easily calculated, its value provides a quantitative measure of the free energy density of a surface reaction. Since free energy reduction is the common driving force for all reactions in nature, cantilevers form a universal platform