

Biomolecular Sensing Processing and Analysis - Rashid Bashir and Steve Wereley
.pdfAN ON-CHIP ARTIFICIAL PORE FOR MOLECULAR SENSING |
43 |
FIGURE 3.8. Histogram of the normalized pulse heights( R/R) measured for a solution containing four different sizes of latex colloids (of diameters 370, 460, 560, and 640 nm as labeled); each peak corresponds to the colloids of a given size. The dotted line represents the raw data while the solid line shows the same data after correcting for the effects of off-axis particles, as described by Eq. (3.6). The distribution of measured pulse heights for each type of colloid is both sharpened and more symmetric after applying the correction. For example, the application of the adjustment caused a decrease in the coefficient of variation of the pulses measured from the 560 nm colloids from 7.1% to 3.5%. [From Ref. 16.]
= τ0/c1 is the minimum transit time measured. We thus use Eq. 3.6 as an algorithm to calculate the pulse height each colloid would have caused had it traveled on the pore’s central axis.
To illustrate the increase in resolution that results from employing Eq. 3.6, we have measured a polydisperse solution containing four different sizes of latex colloids (of diameters 370 nm, 460 nm, 560 nm and 640 nm). In Fig. 3.8, we plot the distribution of measuredR values both before and after applying Eq. 3.6. As shown, the correction clearly sharpens the distribution for each type of colloid. For example, the coefficient of variation (standard deviation divided by mean) for pulses produced by 560 nm diameter colloids is reduced from 7.1% to 3.5%.
Previously [12], we utilized an electrophoretic driving force and found relatively little correlation between the measured pulse heights and widths. In that data, we measured linear correlation coefficients R ranging from 0.1 and 0.2 between the pulse heights and widths; this is in contrast to typical values of R 0.5 for data obtained using pressuredriven flow. Since we expect that the electrical off-axis effect must have been present in the electrophoretically-driven data, we conclude that the electrophoretic velocity of the measured colloids does not vary significantly with the off-axis coordinate. This agrees with the fact that, in the absence of a colloid, the electric field across the pore is constant. It is possible that either inhomogenieties in the electric field due to the presence of the particle or hydrodynamic interactions between the particle and pore wall can lead to an off-axis effect on the velocity of a particle subjected to only an electrophoretic force. However, we conclude that these possibilities are insignificant when compared to the noise in our measurement.
The absence of an observable hydrodynamic off-axis effect while using electrophoretic flow means that we are unable to apply an algorithm similar to Eq. 3.6 to remove the electrical off-axis effect from the electrophoretic data. Distributions of pulse heights of a given colloid population measured using an electrophoretic driving force are therefore reduced in accuracy
44 |
O. A. SALEH AND L. L. SOHN |
since they contain an intractable systematic source of error: the electrical off-axis effect. Devices using pressure driven flow, where we are able to apply the correction described in Eq. 3.6, are thus more accurate than those that use electrophoretic flow.
3.3. APPLICATIONS
3.3.1. An All-Electronic Immunoassay
Antibodies can be powerful and flexible tools because of their natural ability to bind to virtually any molecule and because of the modern ability to produce specific types in large quantities. These traits have led to the development of a number of important immunosensing techniques in which antibodies of a desired specificity are used to test for the presence of a given antigen [19–22]. For example, radioimmunoassays (RIA) have been employed in clinical settings to screen for such viruses as hepatitis [23]. An integral part of all immunosensing technologies is the ability to detect the binding of antibody to antigen. To accomplish this, most common immunoassays require the labeling of the antibody using fluorescence, radioactivity, or enzyme activity. However, the need to bind chemically a label to the antibody adds to the time and cost of developing and employing these technologies.
In this section, we show how we can use our PDMS-based pore as a new, all-electronic technique for detecting the binding of unlabeled antibody-antigen pairs [24]. As we discussed Section 3.2.2, our pore measurement is based on a particle passing through the pore and displacing conducting fluid. This, in turn, causes a transient increase, or pulse, in the pore’s electrical resistance that is subsequently measured as a decrease in current. Because the magnitude of the pulse is directly related to the diameter of the particle that produced it [10, 25], we can use the pore to detect the increase in diameter of a latex colloid upon binding to an unlabeled specific antibody. We have employed this novel technique to perform two important types of immunoassays: an inhibition assay, in which we detect the presence of an antigen by its ability to disrupt the binding of antibody to the colloid; and a sandwich assay, in which we successively detect the binding of each antibody in a two-site configuration.
Previous particle-counting based immunoassays have used optical or electronic methods to detect the aggregates formed when the antibody crosslinks antigen-coated colloids [26–29]. However, relying on crosslinking as a general binding probe is limiting since it requires a free ligand with at least two binding sites. In contrast, our method is more general, since it relies only on the added volume of bound ligand and does not place any limitations on the ligand’s functionality. While it cannot as of yet perform the kinetic analyses that surface plasmon resonance (SPR) techniques [30] are capable of, our device already represents an alternative to SPR for end-point analysis of biological reactions in that it is more rapid, inexpensive, and compact.
We perform our measurements on a chip-based microfluidic device that confers three additional advantages upon our system when compared to traditional immunoassays. First, because we have miniaturized the reservoirs leading to the pore, each measurement uses sub-microliter quantities of sample and can be performed within minutes. Second, we utilize common microfabrication and micro-molding techniques [15] to make the pore, reservoirs,
AN ON-CHIP ARTIFICIAL PORE FOR MOLECULAR SENSING |
45 |
and electrodes. This allows for quick and inexpensive device construction. Third, using chip-based fabrication can extend the device’s capabilities by permitting either future integration of our measurement with other microfluidic components [31, 32] such as separation units or mixers, or construction of arrays of sensors on a single chip for performing many measurements or assays in parallel.
3.3.1.1. Sample Preparation and Measurement All solutions are mixed in 0.5x PBS, pH 7.3, and contain 0.05% Pluronics F127 surfactant (a non-ionic surfactant) and 0.2 µg/mL Bovine Serum Albumen (BSA). The BSA and surfactant are added to decrease both sticking of colloids to the device walls, and non-specific adhesion of antibodies to the particles. We prepare a stock colloidal solution by mixing and twice centrifugally rinsing the colloids in the above buffer. This stock solution is then diluted by a factor of ten and mixed with the relevant antibodies and/or antigens prior to each measurement. For the sandwich assay, we attach biotinylated antibody to streptavidin colloids by incubating a high concentration of the biotinylated antibody with the stock solution, then centrifugally rinsing to remove unbound molecules. Some solutions are passed through a 0.8 µm pore size filter immediately prior to measuring so as to remove aggregates caused by the crosslinking of the colloids by the antibody.
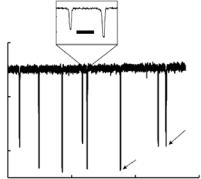
Once each device is loaded with the solution to be analyzed, we measure the current through the pore at constant applied DC voltage (0.2–0.5 V). Figure 3.9 shows a typical measurement of the current: each downward pulse corresponds to a single colloid passing through the pore. Particle transit times are typically 200 µs when a pressure of 7 kPa ( 1 psi) is applied. Such transit times are long enough to establish a stable square pulse shape (see inset, Fig. 3.9). We measure several hundred colloids in a given solution during a single experimental run, after which the device is either cleaned appropriately and reused or
Current (nA)
|
42 |
|
|
|
42 |
41 |
2 ms |
|
|
|
|
|
||
|
|
|
|
|
41.5 |
|
|
|
|
|
|
|
|
Reference |
|
|
|
|
colloid |
41 |
|
|
Streptavidin |
|
|
|
|
||
|
|
|
colloid |
|
0 |
|
50 |
100 |
150 |
Time (ms)
FIGURE 3.9. A typical measurement of the current across a pore as different colloids pass through it. Each downward pulse corresponds to a single colloid transiting the pore. There is a clear difference in pulse magnitude as a result of the difference in size of the streptavidin colloids as compared to the reference colloids. This difference allows us to separate the pulses for pore calibration (see text). The inset shows an expanded view of two pulses. As shown, they are well resolved in time and consequently allow an unambiguous measurement of the pulse height. The data shown was taken with an applied voltage of 0.4 V and a pressure of 6.9 kPa. [From Ref. 24.]
46 |
O. A. SALEH AND L. L. SOHN |
discarded. Custom written software is used to extract both the height and width of each pulse in a trace. As we described in the Section 3.2.3, the accuracy of the measurement is increased by correcting for off-axis particles flowing through the microfluidic channel [17, 33].
3.3.1.2. Analysis Our goal is to detect an increase in the magnitude of the pulses due to the volume increase when 510 nm diameter streptavidin-coated latex colloids specifically bind to antibodies. As shown in Eq. 3.2, the relative height of the pulse depends on the relation of the diameter d of each colloid ( 510 nm) to the diameter D( 900 nm) and length L of the pore. We can determine d for each streptavidin colloid measured if we know the dimensions of the pore. We directly measure L with an optical microscope. However, we cannot directly measure the pore’s diameter D; instead, we perform a calibration by adding a reference colloid of known diameter (a 470 nm diameter sulfate-coated latex colloid) to each solution of streptavidin colloids. The absolute difference in diameter (470 nm to 510 nm) between the two types of colloids results in a clear difference in the pulse heights (see Fig. 3.9); consequently, we can determine easily which size colloid produced each pulse. We use the values of δ I /I arising from the reference colloids, along with the known values of L and d, to invert numerically Eq. 3.2 to thus determine the pore diameter D. Once this is accomplished, we use Eq. 3.2 once again to correlate the magnitude of each pulse to the diameter of the streptavidin colloid that produced it.
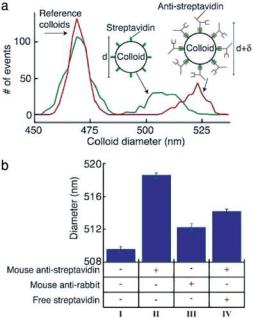
Figure 3.10a shows a histogram comparing the distribution of measured colloid diameters obtained from two different solutions: one containing only the streptavidin and the reference colloids, and one containing both types of colloids and 0.1 mg/mL of monoclonal mouse anti-streptavidin antibody (with an affinity for streptavidin >1010). As shown, there is a clear increase of 9 nm in the diameter of the streptavidin colloids in the solution containing the antibody (see also Fig. 3.10b). We attribute this increase to the volume added to the colloid upon the specific binding to the anti-streptavidin. Specificity is demonstrated by the much smaller increase in diameter ( 2.5 nm) when mixing the colloids with 0.1 mg/mL of a monoclonal isotype matched irrelevant antibody (mouse anti-rabbit; see Fig. 3.10b). This smaller increase is a result of non-specific binding of the irrelevant antibody to the colloids.
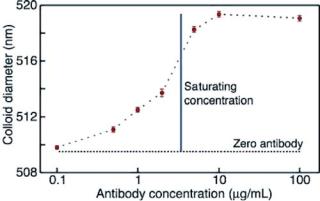
In Fig. 3.11, we show the measured change in colloid diameter as the concentration of the specific, high affinity antibody (monoclonal anti-streptavidin) is varied from 0.1 µg/mL to 100 µg/mL. As shown, the colloid diameter reaches its maximum value when the colloids are mixed with ≥5µg/mL of antibody. Using a Bradford protein assay [34], we determined the minimum saturating concentration of antibody for the colloid concentration in our experiment (1.2 × 10⁹ particles/mL) to be 3.5 µg/mL, which is in good agreement with the results of our electronic pore-based immunoassay. Furthermore, the manufacturer-quoted binding capacity of the colloids indicates that each colloid has approximately 9800 streptavidin molecules on its surface. If each colloid binds to an equivalent number of antibodies, the minimum saturating concentration for a solution containing 1.2 × 10⁹ colloids/mL will be 3.0 µg/mL; again, this is in good agreement with our results. As shown in Fig. 3.11, the dynamic range of our assay corresponds to antibody concentrations from 0.5 µg/mL to the saturating concentration of 5 µg/mL. By decreasing the colloid concentration, we can decrease the binding capacity of the solution, thus decreasing the saturating concentration of antibody. In this manner, we can expect the range of sensitivity of the device to decrease to antibody concentrations as low as 10–50 ng/mL.
AN ON-CHIP ARTIFICIAL PORE FOR MOLECULAR SENSING |
47 |
FIGURE 3.10. A: A histogram showing the distribution of colloid diameters measured from a solution that contains only the reference and streptavidin colloids (green line), and a solution that contains both types of colloids and 0.1 mg/mL of monoclonal anti-streptavidin antibody (red line). The specific binding of anti-streptavidin to the streptavidin colloids produces a clear increase in the diameter of the colloids. B: A summary of the measurements of the mean diameter of the streptavidin colloids when mixed in different solutions. A single experimental run consists of measuring several hundred colloids of each type in one solution; the plotted bars represent the mean diameter extracted from 3–5 such runs on the same solution, but using different devices. All solutions contained the streptavidin colloids and the reference colloids in a 0.5 × PBS buffer (pH 7.3). The presence of additional components in each solution is indicated by a ‘+’ in the column beneath the plotted bar. Column I shows the mean diameter measured without any protein added to the solution. A 9 nm increase in colloid diameter is seen in the presence of the specific antibody to streptavidin (0.1 mg/mL mouse anti-streptavidin, column II); we attribute this to the volume added to the colloid due to the specific binding of the antibody. The specificity of the probe is shown by the lack of a similar diameter increase in the presence of isotype matched irrelevant antibody (0.1 mg/mL mouse anti-rabbit, column III); the small diameter increase in this solution can be attributed to non-specific adhesion. We also perform an inhibition assay, where the specific binding of the anti-streptavidin to the colloid is disrupted by the presence of 0.2 mg/mL free streptavidin (column IV)- the presence of free antigen is shown by the decrease in diameter compared with the antigen-free solution (column II). The error bars in this figure, and in all other figures, represent the uncertainty in determining the mean diameter based on one standard deviation of the measured distributions. The dominant source of error in our measurements is the intrinsic distribution in the streptavidin colloids’ diameter, with smaller contributions from the spread in diameter of the reference colloids and the electrical noise in the current measurement. [From Ref. 24.]
We use our technique’s ability to detect successfully the specific binding of unlabeled antibodies to the colloids to perform an inhibition immunoassay. We measure a 4.5 nm increase (see column IV of Fig. 3.10b) in the diameter of the streptavidin colloids when mixed with 0.1 mg/mL anti-streptavidin that had been preincubated with 0.2 mg/mL of free streptavidin. This smaller increase (relative to the solution containing only antistreptavidin) indicates a decrease in the number of antibodies binding to each colloid. We
48 |
O. A. SALEH AND L. L. SOHN |
FIGURE 3.11. Measurements of the mean colloid diameter when mixed in solutions of varying monoclonal mouse anti-streptavidin concentrations. The vertical line marks the binding capacity of the colloids as determined by a Bradford protein assay. The diameter of the colloids in the absence of antibody is shown as the black dashed line. [From Ref. 24.]
primarily attribute this to the free streptavidin blocking the antibody binding sites. The measured diameter of the streptavidin-coated colloid therefore indicates the presence of free streptavidin in the solution. In general, this inhibition method can be extended to detect any antigen that can be immobilized on the colloid surface.
The 4.5 nm increase seen in column IV of Fig. 3.10b shows that some binding of antibody to the colloid does in fact occur. Based on the control measurement with an irrelevant antibody (column III of Fig. 3.10b), we attribute this increase to a combination of non-specific binding of blocked antibodies, and incomplete inhibition of the antibody by the free streptavidin. The possibility of non-specific binding does decrease the dynamic range of the measurement. However, because of the very small uncertainty in the measured mean colloid diameter, the dynamic range necessary to determine the amount of ligand bound to the colloid is still quite large.
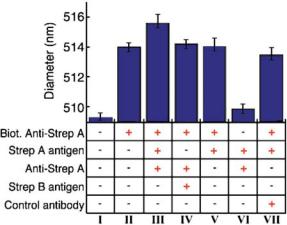
As a second demonstration of our technique’s high sensitivity to the volume added by molecules bound to a streptavidin colloid, we perform an immunoassay (summarized in Fig. 3.12) using a sandwich configuration. Here, a primary antibody that is immobilized on the colloid surface binds to a free antigen, which in turn is bound to a secondary antibody. We immobilize the primary antibody by mixing streptavidin colloids with a biotinylated antibody (Rabbit anti-Streptococcus Group A) to thus create a colloid-antibody conjugate through the streptavidin-biotin bond. As shown in Fig. 3.12, the measured conjugated colloids are 514 nm in diameter, a 5 nm increase over the ’bare’ streptavidin colloids. Next, we mix the colloid-antibody conjugates with both the specific antigen to the primary antibody (extract from a culture of Streptococcus Group A), and 0.1 mg/mL of a secondary antibody (unlabeled rabbit anti-Streptococcus Group A). Measurements of this solution show the colloids further increase in diameter by 1.6 nm. This 1.6 nm increase is not seen when the colloids are mixed with the antigen alone, indicating that the binding of the secondary antibody is the principal reason for the diameter increase. The specificity of this arrangement is demonstrated by the absence of a diameter increase in the control measurements we perform
AN ON-CHIP ARTIFICIAL PORE FOR MOLECULAR SENSING |
49 |
FIGURE 3.12. Summary of the mean colloid diameters measured when forming an antibody-antigen-antibody ‘sandwich’ on the colloid surface. All solutions contain the reference and streptavidin colloids in a 0.5 × PBS buffer (pH 7.3), along with additional components as indicated by the ‘+’ in the column below the plotted bar. Column I indicates the measured diameter of the ’bare’ streptavidin colloid. We measure a 5 nm increase (column II) in diameter after conjugating a biotinylated antibody (biotinylated anti-Streptococcus Group A) to the streptavidin coated colloids. A further increase of 1.6 nm is seen (column III) when adding both extract from a culture of Streptococcus Group A and a secondary antibody specific to that antigen (unlabeled anti-Streptococcus Group A); this increase indicates the formation of the sandwich on the colloid surface. The specificity of the configuration is shown by the lack of an increase in diameter when adding extract from a culture of Streptococcus Group B (which is not bound by either antibody) in place of the Group A extract (column IV), or an irrelevant antibody in place of the specific secondary antibody (column VII). When adding the specific antigen and secondary antibody to unconjugated colloids (column VI), we measure no significant diameter increase, indicating that non-specific adhesion of antigen-secondary antibody complexes are not the cause of the diameter increase seen in column III. Finally, when adding the specific antigen alone to the conjugated colloids (column V), we see no increase in diameter, indicating that the diameter increase in column III is primarily due to the binding of the secondary antibody. [From Ref. 24.]
in which either the antigen or the secondary antibody is replaced by non-specific counterparts (see Fig. 3.12).
It is intriguing that the measured 5 nm increase after attachment of the biotinylated antibody is less then the maximum 9 nm increase seen when utilizing the antibody-antigen bond (Fig. 3.10 and 12) to attach antibody to the colloid. This surprising difference is most likely due to the differing conformations of the antibody in each case; however, further work is needed to clarify this. Nonetheless, despite the smaller size increase, the ability of the device to perform the sandwich assay is still clearly demonstrated.
While we have used an antibody/antigen reaction to demonstrate the power of our technique, we emphasize that its true strength is its generality: it does not rely on any functional properties of the free ligand. Thus, it can be applied to any ligand/receptor pair, provided the free ligand is large enough to produce a discernible change in the size of the colloid.
Future work on the device will focus on optimizing its sensitivity in terms of both ligand size (mass) and concentration. The sensitivity is dependent on four factors: the amount of
50 |
O. A. SALEH AND L. L. SOHN |
ligand bound to each colloid, the intrinsic dispersion in colloid size, the colloid geometry, and the colloid concentration. First, increasing the number of binding sites will lead to more ligands bound per colloid, and consequently a larger change in size. For the colloids used here, the parking area for each binding site is 80 nm2; while this is close to the steric limit for antibody molecules, the use of a smaller ligand would permit more binding sites per colloid. Second, the intrinsic spread in the sizes of the streptavidin colloids is the largest source of error in our measurement. The device’s sensitivity would be enhanced by using a more monodisperse population of colloids (one with a coefficient of variation in diameter of less than 2%), or even a solution of highly monodisperse nanocrystals [35]. Third, at constant binding density, the measured change in pulse height upon binding to free ligand is proportional to the surface-to-volume ratio of the colloid. Thus, we could increase the sensitivity and dynamic range of the assay by employing a smaller colloid. For example, we estimate that using a colloid 250 nm in diameter would increase the sensitivity of the assay by a factor of four in either ligand size or concentration. Thus, based on the data shown in Fig. 3.11, using a 250 nm colloid at the same particle concentration employed in this paper would make the assay sensitive to either 38 kDa ligand molecules at concentrations of 0.5 µg/mL, or antibody concentrations near 0.1 µg/mL. We mention that an even more effective strategy to increase the surface-to-volume ratio would be to use a non-spherical or porous colloid (assuming the pore size is large enough to admit the free ligand) as the substrate for the immobilized receptor. Fourth, as previously mentioned, decreasing the concentration of colloids would further increase the sensitivity since it would decrease the minimum saturating concentration of free ligand. Overall, a combination of these four strategies should result in the increased sensitivity of our assay to ligand concentrations at or below 1 ng/mL.
3.3.2. Summary
In conclusion, we have demonstrated our ability to use an electronic measurement to detect the binding of unlabeled antibodies to the surface of latex colloids. This ability is generally applicable to determining rapidly and precisely the thickness of a layer of any kind of biological macromolecule bound to a colloid. Here, we specifically showed that our technique can be employed to perform two widely used and important immunoassays—an inhibition assay and sandwich assay—in which either the antigen or antibody is immobilized on the colloid. In contrast to how these assays are performed today, ours requires no labeling of analytes, uses only sub-microliter volumes of sample, and can be performed rapidly and inexpensively. For instance, we have compared our technique’s ability (using a sandwich configuration) to detect the presence of Streptoccocus Group A to that of a standard latex agglutination assay. We have found our method to be an order of magnitude more sensitive and over four times as fast as the agglutination assay. Overall, our device can be used to detect many different kinds of analytes, since the colloids can be easily modified to have almost any specificity (through, for example, the biotin-streptavidin interaction used here). Furthermore, our technique can be extended to multi-analyte detection not only by utilizing several microparticles with different chemical sensitivities and different mean diameter but also by employing devices consisting of arrays of pores [36]. Finally, in addition to a host of biosensing
AN ON-CHIP ARTIFICIAL PORE FOR MOLECULAR SENSING |
51 |
applications, this technique can be used as a diagnostic test of the surface chemistry of colloids.
3.3.3. Single Molecule Detection
We have pushed the length scale of our PDMS-based pore so that the pore is able to sense single molecules of unlabeled lambda-phage DNA [37]. Our success provides many opportunities for diverse single molecule detection applications.
To measure single molecules of DNA, we require pores that have dimensions 200 nm in diameter and a length of a few microns (here we used a length of 3 µm). The 200 nm diameter is achieved using electron-beam lithography. Soft lithography [15], as described in Section 3.2.2, is used to embed the pore and reservoirs into PDMS.
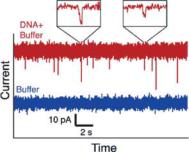
To demonstrate the sensing capabilities of our nanopore, we have measured solutions of 2.5 µg/mL lambda-phage DNA in a 0.1 M KCl, 2 mM Tris (pH 8.4) buffer. Typical traces of measured current are shown in Figure 3.13. The striking downward peaks, of height 10–30 pA and width 2–10 ms, correspond to individual molecules of DNA passing through the pore. In contrast, such peaks are absent when measuring only buffer. We further note that peaks are only present when using pores with diameters of 300 nm or less.
Previous work on colloids [10, 12] has shown that, for particles of diameter much smaller than that of the pore, the ratio of peak height to baseline current is approximately equal to the volume ratio of particle to pore: δ I /I Vparticle/ Vpore. We can estimate the volume of a single lambda DNA molecule by approximating it as a cylinder with a 2 nm radius (which includes a 1 nm ionic, or Debye, layer), and a height equal to the contour length of the molecule ( 16 µm). Given the known pore volume and a total current I = 15 nA, we can expect a decrease in current δ I 30 pA when a DNA molecule fully inhabits the pore. This estimate agrees well with the upper range of measured peak heights. Further corroboration for this model comes from the fact that no peaks are observed when using larger pores (pores >300 nm in diameter). When a molecule inhabits a pore with a diameter >300 nm, the expected response in current is less than 40% of that for a 200 nm diameter pore. Therefore, at 15 nA total current, the maximum peak heights for a lambda DNA molecule will be less than 12 pA, a value not well resolvable above the noise. Our results
FIGURE 3.13. Typical traces of current vs. time for solutions of buffer (lower trace), and buffer with lambda phage DNA molecules (upper trace), when 0.4 V is applied across the pore. The traces are offset for clarity; the total current in each case is 15 nA. Each downward spike in the lower trace represents a DNA molecule passing through the pore. The spikes are typically 2–10 ms in duration, and are well resolved, as shown in the insets. The variations in peak height most likely correspond to the different conformation of each molecule. [From Ref. 37.]
52 |
O. A. SALEH AND L. L. SOHN |
suggest that the measured variation in δ I is most likely due to differences in molecular conformation: maximum peak heights arise when an entire molecule inhabits the pore, while smaller peak heights occur when only a portion of a molecule resides within the pore. Future experiments will focus on controlling the conformation of each molecule in order to relate the measured peak height to the length of each DNA molecule. Thus, our nanopore device may provide a simple and quick method for the coarse sizing of large DNA molecules.
The results described here represent a first step towards a host of single-molecule sensing applications. By relying on common micro-fabrication techniques, we can easily create arrays of pores for the simultaneous measurement of many different molecules [36]. Decreasing the pore size will allow us detect and size smaller molecule such as proteins or viruses. The minimum achievable pore diameter for the PDMS used here (Sylgard 184) is150 nm, but recent work has shown that other PDMS formulations can maintain features as small as 80 nm [37]. Finally, we can add chemically specificity in two ways: first, by covalently attaching molecules of interest to the pore wall, we expect to see changes in the transit times of molecules in solution that interact with the immobilized molecules. Second, we can measure changes in the diameter of chemically-functionalized colloids upon binding of molecules in the solution, as we have already done using our electronic immunoassay described in the previous section [24]. The ease and reproducibility of micro-molding and the simplicity of our device greatly enhances the capabilities of artificial nanopores for molecular sensing.
3.4. CONCLUSIONS
We have described the fabrication and measurement of a fully-integrated on-chip artificial pore. Because we employ standard integrated circuit fabrication techniques, including photoand electron-beam lithographies, reactive ion etching, and metal deposition, as well as employ soft-lithography, we can reproducibly fabricate a stable pore that is inexpensive and easy to use. Furthermore, we are able to scale the pore to include arrays on a chip for massively-parallel screening. We have demonstrated two applications to our pore: a labelfree immunoassay and coarse-sizing of single molecules of DNA. These are only two of the many molecular-sensing applications we forsee with our artificial on-chip pore.
REFERENCES
[1]S. Howorka, S. Cheley, and H. Bayley. Sequence-specific detection of individual DNA strands using engineered nanopores. Nature Biotech., 19:636–639, 2001.
[2]H. Bayley and P.S. Cremer. Stochastic sensors inspired by biology. Nature, 413:226–230, 2001 and references therein.
[3]J. Li, M. Gershow, D. Stein, E. Brandin, and J. Golovchenko. DNA molecules and configurations in a solid-state nanopore microscope. Nat. Mater., 2:611–615, 2003.
[4]J. Li, D. Stein, C. McMullan, D. Branton, M.J. Aziz, and J.A. Golovchenko. Ion-beam sculpting at nanometer length scales. Nature, 412:166–169, 2001.
[5]P. Kohli, C.C. Harrell, Z. Cao, R. Gasparac, W. Tan, and C.R. Martin. DNA-functionalized nanotube membranes with single-base mismatch selectivity. Science, 305:984–986, 2004.
[6]R.R. Henriquez, T. Ito, L. Sun, and R.M. Crooks. The resurgence of Coulter counting for analyzing nanoscale objects. Analyst, 129:478–482, 2004.
[7]W.H. Coulter. U. S. Patent No. 2,656,508, issued 20 Oct. 1953.
[8]H.E. Kubitschek. Electronic counting and sizing of bacteria. Nature, 182:234–235, 1958.