

Biomolecular Sensing Processing and Analysis - Rashid Bashir and Steve Wereley
.pdf248 |
MARIN SIGURDSON ET AL. |
2 × 10⁻⁵
1 × 10⁻⁵
0
0 |
2 × 10⁻⁵ |
4 × 10⁻⁵ |
6 × 10⁻⁵ |
FIGURE 12.2. Streamlines of the cellular flow used in the model. |
|
||
A simple model that captures these ideas was described in [20]. For an interdigitated array of electrodes a cellular flow is produced, and is depicted in Fig. 12.2.
One possible stream function is
ψsteady = u0 · y2e−y/β cos(π x), |
(12.15) |
where the flow velocity naturally satisfies the incompressibility condition. The parameter β determines the position of the center of the rolls.
Inertia in micron-size devices can be neglected, and the velocity of the particles can be obtained directly from the DEP force, buoyancy, drag force and Brownian motion, and can be described by the following stochastic ordinary differential equation.
dq |
= |
(u(q) |
+ |
Fdep (q) |
|
(ρ |
|
ρ |
) |
|
2r 2 |
|
g)dt |
|
d W |
|
(12.16) |
6π ηr |
+ |
p − |
· |
9η · |
+ |
|
|||||||||||
|
|
|
f |
|
|
|
t |
|
|||||||||
where u(q) is the fluid velocity at q and Wt is the Brownian motion of variance 2D = kT /3π ηr , where k is the Boltzmann constant, η is the viscosity of the fluid and T is the temperature. The relative importance of the first three (deterministic force) terms, given the particle and fluid physical properties, depends basically on three parameters: the applied voltage V, the radius of the particle r, and the size of the electrode device d. The relative influence of fluid flow and Brownian motion gets progressively larger for smaller particles, and the buoyancy term becomes important only far from the electrodes where both the flow and DEP force are small.
For particles larger than a few microns, Brownian motion becomes less important and under certain circumstanced may be neglected [20]. The discussion in Tuval et al. [20] is in the context of dynamical systems methods. Two effects of different nature must be noted. Far from the electrodes, where the fluid velocity is smaller, the flow acts only as a small perturbation of the no-flow state. Therefore, the fixed points that exist due to the balance between negative DEP force and positive buoyancy, persist under the perturbation. The basic change is the accumulation of most of the particles in a small trapping area above the electrodes. This main effect has been pointed in several experiments [8, 13]. Under positive DEP, particles tend to accumulate at the edges of the electrodes. But fluid flow, that
AC ELECTROKINETIC STIRRING AND FOCUSING OF NANOPARTICLES |
249 |
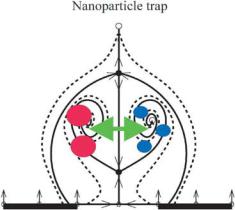
FIGURE 12.3. Sketch of the dynamical behavior of particles in the trapping zone.
is also stronger in that region, can influence the dynamics and move the particles across the electrode surface, finally collecting them above the center of the electrodes [15, 18].
A second effect that takes place close to the electrode surfaces is the creation of a closed zone from which particles can not escape There are two qualitatively different behaviors; some particles are trapped in a closed area above the electrodes or in the gap between electrodes depending on the sense of rotation of the flow, whereas others escape from the flow influence under negative DEP. A sketch of its dynamical structure of the trapping zone is depicted in Fig. 12.3.
Particles in the trapping zone are attracted towards two foci. Particles outside the trapping zone escape from the flow influence and finally reach and equilibrium position due to positive buoyancy, as in the absence of flow. One problem of interest that can be addressed using control theory methods is stabilization of the trapping zone.
12.5. ELECTROTHERMAL STIRRING
The finite element simulation software Femlab (Comsol; Stokholm, Sweden) is used for analysis of electrothermally-induced flow and subsequent enhanced binding in the cavity. First, the two-dimensional quasi-static potential field for two electrodes along the cavity wall is calculated, according to Laplace’s Equation, 2V = 0. The resulting base electric
= −
field, given by E V gives rise to a non-uniform temperature field through Joule heating. Ignoring unsteady effects and convection (low Peclet number), and balancing thermal diffusion with Joule heating yields
k 2 T + σ E 2 = 0, |
(12.17) |
where T is temperature, E is the magnitude of the electric field, and k and σ are the thermal and electrical conductivities. Thermal boundary conditions are insulating on the channel surfaces. The metal electrodes are isothermal. The treatment of the electrodes
250 |
MARIN SIGURDSON ET AL. |
(a)Temperature rise (K)
0.51.0 1.5 2.0 K
40 m channel
electrode |
|
|
electrode |
||
|
|
||||
60 m |
|
|
20 |
m gap |
|
|
|||||
|
|
|
|||
(b) Velocity Field; center section |
400 |
m/s |
|
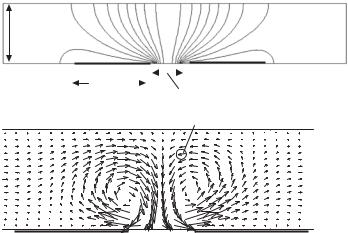
FIGURE 12.4. Simulation of electrothermally-driven flow in a 40 µm channel using Femlab software. (a) Nonuniform temperature distribution created by Joule heating, and (b) Electrothermally-driven fluid motion. The pressure driven channel flow is moving from left to right at an average velocity of 100 µm/s. The velocity of the electrothermally-driven flow is of order 400 µm/s and is characterized by a pair of counter rotating vortices.
as isothermal is appropriate for electrodes of sufficient thickness relative to length. The resulting temperature field is shown in Fig. 12.4a.
Gradients in temperature produce gradients in permittivity and conductivity in the fluid. For water (1/σ )(∂σ/∂ T ) = +2%and (1 /ε) (∂ε/∂ T ) = −0.4%per degree Kelvin. These variations in electric properties produce gradients in charge density and perturb the electric field. Assuming the perturbed electric field is much smaller than the applied electric field, and that advection of electric charge is small compared to conduction, the time-averaged electrothermal force per unit volume for a non-dispersive fluid can be written as [18]
E T = − |
|
σ |
− |
ε |
r ms |
1 + (ωτ )2 + |
|
| r ms | |
|
|
|
||
F |
0.5 |
σ |
|
ε |
E |
ε Er ms |
|
0.5 |
E |
2 |
|
ε , |
(12.18) |
|
|
|
|
|
|
||||||||
where τ = ε/σ is the charge relaxation time of the fluid medium and the incremental temperature-dependent changes are
ε = |
∂ T |
T , |
σ = |
∂ T |
T . |
(12.19) |
||
|
|
∂ε |
|
|
|
∂σ |
|
|
The first term on the right hand side of Eq. (12.18) is the Coulomb force, and is dominant at low frequencies. The second term is the dielectric force, and is dominant at high frequencies. The crossover frequency scales inversely with the charge relaxation time of the fluid; an aqueous solution with conductivity 10−2 S/m has a crossover frequency around 14 MHz.
AC ELECTROKINETIC STIRRING AND FOCUSING OF NANOPARTICLES |
251 |
The electrothermal force shown in Eq. (12.18) is a body force on the fluid. The motion of the fluid can determined by solving the Stokes’ equation for zero Reynolds number fluid flow, such that
0 |
= − |
ρ |
+ |
µ |
+ |
FE T , |
(12.20) |
|
|
2u |
where u is the fluid velocity, p is the pressure in the fluid, and µ is the dynamic viscosity of the fluid. Figure 12.4b shows the resulting velocity field. The velocity of the ETF is of order 400 µm/s, and characterized by a pair of counter rotating vortices, which may circulate the fluid effectively. The velocity field is similar to the streamlines shown in Fig. 12.2.
12.6. ENHANCEMENT OF HETEROGENEOUS REACTIONS
The effect of electrothermally-driven motion upon heterogeneous binding rates is examined in the following section. The convective scalar equation is solved to predict the suspended concentration C(x,y) of antigen within the microchannel:
∂C |
+ u · C = D 2C, |
(12.21) |
∂t |
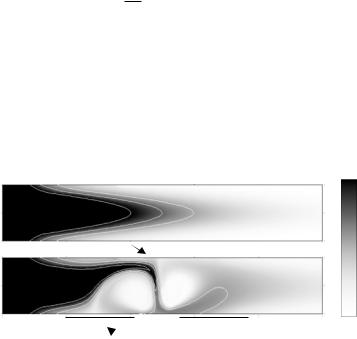
where u is the fluid velocity and D = 2 × 10⁻¹¹ m2 s−1 is the diffusivity of an antigen. An antigen concentration of C0 = 0.1 nM is introduced into the left hand side of the channel, for time t > 0. Since the base flow is parabolic, analyte will be transported downstream most rapidly at the channel center (see Fig. 12.5a). After 1 second, the highest analyte concentration extends into the center of the channel, but no analyte concentration has yet reached the sensor binding site. When an alternating electrical potential of 7Vrms is applied
Concentration at t = 1 s |
c/cin |
|
1.0 |
0V |
|
7V
0
 Electrodes
FIGURE 12.5. Concentration plots of electrothermally modified channel flow with applied voltages of 0V and 7V. With optimal size and placement of electrodes, the electrothermal eddies can be engineered to span width of the channel, as is the case here, for a 40 micron channel. High concentration gradients and therefore an increase in diffusive flux in the vertical direction near the top channel wall indicate a favorable alternative location for the sensor here.
252 |
MARIN SIGURDSON ET AL. |
to the electrodes, the electrothermally-induced motion transports the analyte close to the upper surface of the channel (Fig. 12.5b). This suggests that for these flow conditions and electrode configurations, an excellent sensor location is opposite the electrode gap.
Assuming a 1st order heterogeneous reaction, the rate of binding is kon Cw (RT − B), where kon = 1e8 M−1 s−1 is the on-rate constant. The quantity, RT − B, is the available antibody concentration, and Cw (x ) is the suspended concentration of antigen along the wall [14]. The off-rate is koff B, where koff = .02 s−1 is the off-rate constant, and B is the concentration of bound antigen. The time rate of change of antigen bound to the immobilized antibodies is equal to the rate of association minus the rate of dissociation
∂ B
kon Cw (RT − B) − Koff B. (12.22)
∂t
The rate of antigen binding to immobilized antigen, ∂ B/∂, must be balanced by the diffusive flux of antigen at the binding surface, y = 0, such that
∂t |
= D ∂Y |
y |
|
0. |
(12.23) |
|
∂ B |
∂C |
= |
|
|
||
|
|
|
|
|
|
|
|
|
|
|
|
|
|
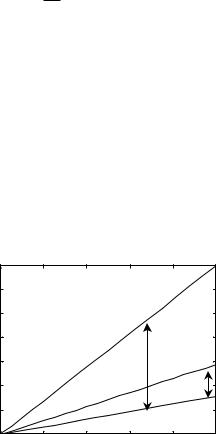
Equations (12.21), (12.22) & (12.23) are solved with an immobilized antibody concentration RT = 1.7 nM cm (i.e. one molecule per 100 nm2). The binding rates for three conditions, 0, 7 and 14 Vrms, are shown in Fig. 12.6. The 0 Vrms case corresponds to the passive case, which is the result of pure diffusion. This is the standard mode of most immobilized assays. The 7 and 14 Vrms curves correspond to the result of electrothermally-driven flow enhancing the transport of antigen to the immobilized antibodies. The curves in
0.14 |
|
|
|
|
|
0.12 |
|
|
|
|
|
0.10 |
|
|
|
|
|
0.08 |
|
|
14 V |
|
|
|
|
|
4.5X binding |
||
B/RT |
|
|
|
||
|
|
|
rate increase |
||
0.06 |
|
|
|
|
|
0.04 |
|
|
7 V |
|
1.9X binding |
|
|
|
rate increase |
||
|
|
|
|
||
0.02 |
|
|
|
|
|
0 0 |
|
|
0 V |
|
|
20 |
40 |
60 |
80 |
100 |
|
t (s)
FIGURE 12.6. Numerical simulation of normalized bound concentration for a microchannel assay. The binding rate is increased by a factor of 2, when 7 Vrms is applied to the electrodes. The binding rate is increased by a factor of 4.5, when 14 Vrms is applied to the electrodes. These results suggest that electrothermally induced flow can significantly improve immunoassay performance by increasing binding rates. Parameters: Diffusivity, D =
2 × 10⁻¹¹ m2s−1 (corresponding to 20 nm spherical particle); inlet velocity is parabolic with average 100 µm s−1; inlet concentration c0 = 0.1 nM; σw = .00575 Sm−1; kon = 1e8 M−1 s−1; koff = .02 s−1; Rt = 1.67e-11 Mm.
AC ELECTROKINETIC STIRRING AND FOCUSING OF NANOPARTICLES |
253 |
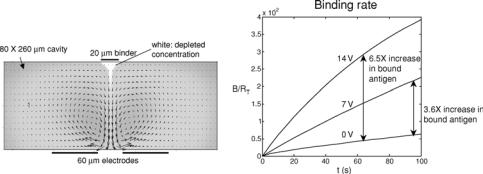
FIGURE 12.7. Microcavity (i.e. no flow-through) simulations (a) Velocity and concentration fields. The binder is centered above the electrodes; depleted concentration (white) is drawn down into the cavity. (b) Binding curves for non-enhanced (0 V) and enhanced (7V, 14V) transport. The differences in the two curves show an increase in binding rate which yields a factor of 3.6 higher binding for 7 V and a factor of 6.5 higher binding after 60 seconds for 14 V applied root-mean square potential. Paramters: Diffusivity, 10−11 m2s−1; zero net flow; all other parameters identical to those in Fig. 12.3. Initial condition: C(x , y) = C0 at t = 0.
Fig. 12.6 show that a factor of 4.5 improvement in binding rate is obtained using ac electrokinetics in combination with a flowing microchannel.
Electrothermally-driven stirring can be used to improve assays for ELISA tests, microarray assays, and microtitre plates, where there is zero net flow. In these assays, the sample is often pre-mixed with a fluorescent or a chemiluminescent reporter, which increases the effective size of the analyte thereby decreasing its diffusivity. We simulate this effect by reducing the diffusivity by a factor of two, such that D = 10−11 m2 s−1.
The numerical simulation results are shown in Figure 12.7. The recirculating velocity field, which is characteristic of electrothermally-driven flow, is shown in Fig. 12.7a. This corresponds approximately to the streamlines shown in Fig. 12.2. For an applied voltage of 7 and 14 Vrms, the binding rate is increased by a factor of 3.6 and 6.5, respectively (see Fig. 12.7b). In the current simulation, the ac frequency is f = 100 kHz. In this range, the electrothermal velocity is not sensitive to changes in electrical frequency. At much lower frequencies ( 100 Hz), ac electroosmosis and electrode polarization typically dominate. At much higher frequencies ( MHz), the dielectric component of the electrothermal force (last term in Eq. 12.18) dominates [17].
12.7. CONCLUSIONS
An analytical theory is presented that suggests that the combination of positive DEP and electrothermal fluid motion can produce non-localize trapping zones away from electrodes. The results suggest that this phenomenon could be used to focus bio-molecules in microfluidic sensors, when molecular diffusivity is low.
Numerical simulations are used to show how electrothermally-generated forces can be used to stir fluids in microchannels. Fluid velocities of approximately 400 µm/s are generated by applying potentials of V = 14 Vrms at f = 100 kHz. Precision stirring can
254 |
MARIN SIGURDSON ET AL. |
be used to enhance the transport molecules towards functionalized surfaces. The results indicate that the binding rates of heterogeneous diffusion-limited reactions can be improved by a factor of 2–6, by applying 7–14 Vrms electrical potentials.
ACKNOWLEDGMENTS
This work has been supported by DARPA/ARMY DAAD19-00-1-0400, DARPA/Air Force F30602-00-2-0609, NSF CTS-9874839 and NSF ACI-0086061, and through the Institute for Collaborative Biotechnologies through grant DAAD19-03-D-0004 from the U.S. Army Research Office.
REFERENCES
[1]L. Bousse, C. Cohen, T. Nikiforov, A. Chow, A.R. Kopf-Sill, R. Dubrow, and J.W. Parce. Electrokinetically controlled microfluidic analysis systems [Review]. Ann. Rev. Biophys. Biomol. Struct., 29:155–181, 2000.
[2]D.-E. Chang, S. Loire, and I. Mezic. Closed-Form Solutions in the Electrical Field Analysis for Dielectrophoretic and Travelling Wave Inter-Digitated Electrode Arrays. Proceedings of the Conference on Decision and Control. Maui, HI, 2003.
[3]C.H. Chen and J.G. Santiago. A planar electroosmotic micropump. J. MEMS., 11(6):672–683, 2002.
[4]L.X. Chen, J.P. Ma, F. Tan, and Y.F. Guan. Generating high-pressure sub-microliter flow rate in packed microchannel by electroosmotic force: potential application in microfluidic systems. Sens. Actu. B-Chem., 88(3):260–265, 2003.
[5]C. Ring-Ling et al. Simultaneous hydrodynamic and electrokinetic flowcontrol. Micro Total Analysis Systems 2002, 1:386–388, Nov. 2002.
[6]V.V. Daniel. Dielectric relaxation. Academic Press, New York, 1967.
[7]P.R.C. Gascoyne and J. Vykoukal. Particle separation by dielectrophoresis [Review]. Electrophoresis, 23(13):1973–1983, 2002.
[8]N.G. Green, A. Ramos, and H. Morgan. AC electrokinetics: a survey of sub-micrometre particle dynamics, J. Phys. D, 33:632–641, 2000.
[9]M.P. Hughes. Electrophoresis, 23(16):2569, 2002.
[10]T.B. Jones. Electromechanics of Particles, Cambridge University Press, 1995.
[11]C.D. Meinhart, D. Wang, and K. Turner. Measurement of AC electrokinetic flows. J. Biomed. Microdev., 5(2):139–145, 2003.
[12]R. Miles, P. Belgrader, K. Bettencourt, J. Hamilton, and S. Nasarabadi. Dielectrophoretic manipulation of particles for use in microfluidic devices, MEMS-Vol. 1, Microelectromechanical Systems (MEMS). Proceedings of the ASME International Mechanical Engineering Congress and Exposition, Nashville, TN, Nov. 14–19, 1999.
[13]T. Muller, A. Gerardino, T. Schnelle, S.G. Shirley, F. Bordoni, G. DeGasperis, R. Leoni, and G. Fuhr. Trapping of micrometre and sub-micrometre particles by high-frequency electric fields and hydrodynamic forces. J. Phys. D.: Appl. Phys., 29, 340–349, 1996.
[14]D.G. Myszka. Survey of the 1998 optical biosensor literature. J. Mol. Recognit., 12:390–408, 1998.
[15]R. Pethig, Y. Huang, X.B. Wang, and J.P.H. Burt. Positive and negative dielectrophoretic collection of colloidal particles using interdigitated castellated microelectrodes. J. Phys. D.: App. Phys., 25:881–888, 1992.
[16]H.A. PohL. Dielectrophoresis. Cambridge University Press, 1978.
[17]A. Ramos, A. Castellanos, A. Gonzales, H. Morgan, and N. Green. Manipulation of Bio-Particles in Microelectrode Structures by means of Non-Uniform AC Electric Fields. Proceedings of ASME International Mechanical Engineering Conngress & Exposition. New Orleans, LA Nov. 17–22, 2002.
[18]A. Ramos, H. Morgan, N.G. Green, and A. Castellanos. AC electrokinetics: a review of forces in microelectrode structures. J. Phys. D: Appl. Phys., 31:2338–2353, 1998.
AC ELECTROKINETIC STIRRING AND FOCUSING OF NANOPARTICLES |
255 |
[19]W. Thormann, I. Lurie, B. McCord, U. Mareti, B. Cenni, and N. Malik. Advances of capillary electrophoresis in clinical and forensic analysis (1999–2000). Electrophoresis, 22:4216–4243, 2001.
[20]I. Tuval, I. Mezic, and O. Piro. Control of particles in micro-electrode devices. UCSB preprint 2004.
[21]X-B. Wang, J. Vykoukal, F. Becker, and P. Gascoyne. Separation of polystyrene microbeads using dielectrophoretic/gravitational field-flow-fractionation. Biophys. J., 74:2689–2701, 1998.
[22]D. Wang, M. Sigurdson, and C. Meinhart. Experimental analysis of particle and fluid motion in AC electrokinetics. Accepted in Exp. in Fluids. 2004.
[23]M. Washizu, O. Kurosawa, I. Arai, S. Suzuki, and N. Shimamoto. Applications of electrostatic stretch and positioning of DNA. IEEE Trans. Ind. Appl., 32(3):447–445, 1995.
[24]J. Yang, Y. Huang, X. Wang, X.-B. Wang, F. Becker, and P. Gascoyne. Dielectric properties of human leukocyte subpopulations determined by electrorotation as a cell separation criterion. Biophys. J., 76:3307– 3314, 1999.
III
Micro-fluidics and Characterization
13
Particle Dynamics in a
Dielectrophoretic Microdevice
S.T. Wereley and I. Whitacre
Purdue University, School of Mechanical Engineering, West Lafayette,
IN 47907-2088, USA
13.1. INTRODUCTION AND SET UP
13.1.1. DEP Device
A dielectrophoretic device has been designed to trap, separate, and concentrate biological components carried in solution. The operating principle of the device is the dielectrophoretic interaction between the spheres and the fluid. The device was designed and manufactured by at Purdue University [6]. The device consists of a microchannel with a depth of 11.6 µm, width of 350 µm, and length of 3.3 mm. The channel was anisotropically etched in silicon to produce a trapezoidal cross-section. The channel was covered by a piece of anodically bonded glass. A schematic view and digital photo of the device are shown in Figure 13.1. Bright regions represent platinum electrodes and the dark regions represent the electrode gaps. The electrodes are covered by a 0.3 µm thick layer of PECVD silicon dioxide, which insulates the electrodes from the liquid medium, suppressing electrolysis. The electrodes are arranged in interdigitated pairs so that the first and third electrodes from Figure 13.1 are always at the same potential. The second and fourth electrodes are also at the same potential, but can be at a different potential than the first and third electrodes. An alternating electric potential is applied to the interdigitated electrodes to create an electromagnetic field with steep spatial gradients. Particle motion through the resulting electric field gradients causes polarization of the suspended components, resulting in a body force that repels particle motion into increasing field gradients. In the experiments, sample solutions were injected into the chamber using a syringe pump (World Precision Instruments Inc., SP200i) and a 250µl gas-tight luer-lock syringe (ILS250TLL, World Precision