

Biomolecular Sensing Processing and Analysis - Rashid Bashir and Steve Wereley
.pdf RO1 9
RO1 9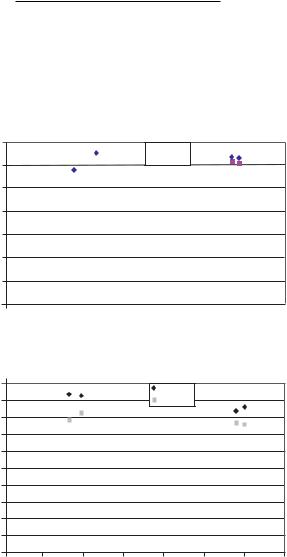
 exp
exp  numerical
322 A.T. CONLISK AND SHERWIN SINGER
TABLE 15.2. Results for the mobility and dimensional ζ potential for the indicated in the 83nm channels of ORNL. Both numerical and asymptotic values of the mobility and ζ potential are shown. The subscript e stands for experiemental, a for asymptotic and the units of the mobility µ are
|
|
cm2 |
. The units of surface charge density are |
C |
and ζ is in volts. |
|
|||
|
|
V sec |
2 |
|
|||||
|
|
|
|
|
m |
|
|
||
mM |
µe × 104 |
µ × 104 |
µa × 104 |
σ |
|
ζe |
ζ |
ζa |
|
0.2 |
3.23 |
|
3.52 |
7.53 |
−0.0154 |
|
−0.138 |
−0.141 |
−0.185 |
2 |
2.85 |
|
2.97 |
3.28 |
−0.0154 |
|
−0.098 |
−0.114 |
−0.125 |
20 |
1.89 |
|
1.44 |
1.21 |
−0.0154 |
|
−0.054 |
−0.049 |
−0.050 |
150 |
0.80 |
|
0.58 |
0.59 |
−0.0154 |
|
−0.017 |
−0.019 |
−0.019 |
electrochemical effects are present in the model. Note that the model yields a true prediction; there are no adjustable parameters with which to match the data.
It is useful to point out that the ζ potential can be defined by setting the potential
ψ = φ + ζ
equal to zero in the core. This yields in dimensionless form
ζ = − |
1 |
ln |
g0 |
2 |
f 0 |
and note that this implies a theoretical relationship between the ζ potential and the surface charge density. On Table 15.2 are the results at various molarities for the 83nm channel. Note the good agreement between the experimental data and the model. Clearly the prediction of the ζ potential by the model is extremely good. The differences in the numerically computed ζ potential(ζ ) and the asymptotic value (ζa ) valid for 1 on Table 15.2 indicates that the double layers on the channel walls may be overlapping.
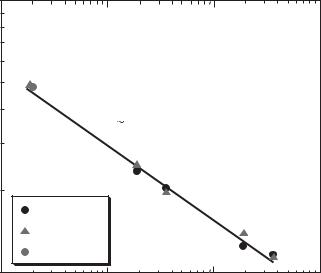
A similar set of results have been produced by Yoda’s group at Georgia Institute of Technology [25]. Figure 15.13 compares the experimentally measured mobility µex with the dimensional electroosmotic mobility µeo predicted by an asymptotic model described in Section 15.4 which is
µeo = |
εeφo |
ln |
g0 |
. |
(15.49) |
2µ |
f 0 |
Here, εe and µ are the electrical permittivity and absolute viscosity, respectively, of the fluid aφo ≡ RT /F (R is the universal ideal gas constant, T the absolute temperature of the fluid and F is Faraday’s constant) is the characteristic scale for the potential, and (g0, f 0) are the wall mole fractions of the cationic and anionic species, respectively. The wall mole fractions are predicted by the method described in the previous section. The experimental and model values for mobility agree within 10% over a 200-fold change in molar concentration, suggesting that the particle tracers follow the flow with good fidelity over the range of E studied.
The linear result on Figure 15.13 suggests that the mobility scales as a power of the concentration:
µ = µo |
C |
|
−N |
|
(15.50) |
||
1m M |
MODELING ELECTROOSMOTIC FLOW IN NANOCHANNELS |
323 |
mobilities comparison
10 |
|
|
|
|
s)] |
|
|
|
|
/(V |
|
C |
--0.28 |
|
|
|
|||
2 |
|
|
||
cm |
|
|
|
|
4 |
|
|
|
|
[x 10 |
|
|
|
|
|
nPIV |
|
|
|
|
Model |
|
|
|
|
ORNL |
|
|
|
1 |
|
|
|
|
0.1 |
1 |
|
10 |
100 |
|
|
|
C [mM] |
|
FIGURE 15.13. Graph of mobility values µex() and µeo(×) as a function of molar concentration of EOF of sodium tetraborate buffer. The solid line shows Equation 50 with µ0 = 3.00 × 10⁻⁴ cm2/(V · sec) and N = 0.277.
A curve-fit of the experimental data points gives µo = 2.94 × 10⁻⁴ cm2/(V · sec) and N = 0.278. These are the first results suggesting this correlation.
We have compared the model with another data set taken by iMEDD, Inc. of Columbus, Ohio. Using techniques developed by Hansford. et al. [21], they fabricate a variety of silicon membranes consisting of a series of nanochannels and measure electroosmotic flow rate across those membranes. The membranes are 3.5mm long, 1.5mm wide, and 3.5 (m thick. In their configuration, there are 47,500 nanochannels on each of these membranes. The nanochannels themselves are 3.5 (m in length and 44 (m in width. iMEDD inc. fabricate and made tests to channels with different heights: 4nm, 7nm, 13nm, 20nm, 27nm and 49nm in particular. The geometry of the iMEDD nanochannel membrane and the testing apparatus are shown in Figure 15.2(b).
The two reservoirs are filled with buffer solution. The buffer used in iMEDD’s experiments are PBS, 10 times diluted PBS, and 100 times diluted PBS. 17 Volts DC is applied on the two electrodes at the far ends of the two reservoirs. It should be noted that the voltage drop across the membrane is much less than 17 Volts, because most of the 17 Volts is dissipated outside the nanopore membrane, due to the resistance of the buffer in the reservoir. In addition to those experimental parameters mentioned in the ORNL comparison section, the voltage drop across the membrane is required and this value is calculated from a resistance model for each channel height.
Using membrane resistance data determined by iMEDD, we can calculate the volume flow rates based on the calculated voltage drops. The comparison of the calculated flow
MODELING ELECTROOSMOTIC FLOW IN NANOCHANNELS |
325 |
walls has not been characterized well experimentally. Therefore, currently MD studies of EOF have used, to varying extent, schematic models, particularly with respect to the channel walls. A further consideration is the model used to describe how frictional heating is dissipated. Despite the simplifying assumptions that, at this stage of our understanding, have to be made, simulation studies have helped determine the extent to which continuum theories will apply at the nanoscale and have identified important issues that need further study.
The issues involved in comparing with continuum theory can be divided into two groups. First, the driving force for EOF is determined by the charge distribution within the fluid. In the linear response regime, the charge distribution governing EOF is the equilibrium ionic distribution within the electrolyte. Therefore, one important issue concerning EOF is essentially static in nature: how well continuum methods like Poisson-Boltzmann theory predict the equilibrium ion distribution. Secondly, there is a group of issues in setting up continuum equations for fluid flow. The type of boundary conditions, i.e. no-slip or partial slip, and where to place the boundary surface are crucial issues. There is also a question of whether a linear constitutive relation between shear stress and strain exists, and whether this relation can be taken as fixed throughout the channel.
15.6.2. Statics: the Charge Distribution in a Nanochannel
In nanochannels, the width of the channel is typically between 10 and 100 solvent molecular diameters. Under many experimental conditions this is less than a Debye length. Since PoissonBoltzmann theory (PBT) neglects the molecular nature of solvent and ions, it is not surprising that simulation studies of nanochannel flow indicate that PBT is a poor starting point for description of the charge distribution in very small channels [26–28]. Here we identify and discuss several shortcomings of Poisson-Boltzmann theory—neglect of specific ion-wall interactions, molecular nature of the solvent, ion correlations, and finitesize corrections to the solvent dielectric response.
PBT theory is a mean field theory in which the instantaneous, fluctuating interactions of ions with other fluid particles and the walls are replaced by an average potential. PBT has been solved analytically for ions between uniform charged surfaces [29, 30]. Classical PBT neglects any specific interactions between ions and the wall, other than incorporating very strong binding of some ions in the Stern layer through a modified wall charge. Simulations show that specific ion-wall interactions significantly affect the ion density and need to be incorporated to predict EOF flow characteristics.
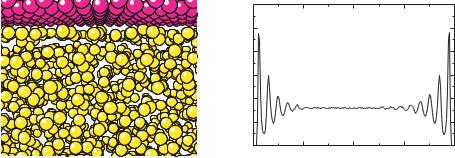
Liquids tend to order near walls, an effect which arises form the molecular nature of the solvent. The effect has been elegantly confirmed by the oscillatory dependence of the force on distance as solvent is squeezed out between mica sheets. To illustrate this effect, the density profile of a fluid of spherical particles interacting via a Lennard-Jones interaction is shown in Fig. 15.15, where layering is clearly visible in the snapshot and density profile. The ion distribution is consequently modified by the structured environment near the channel walls in a complex fashion. Spherical ions in a solvent of spherical particles of the same size tend to lie within the solvent layers [28]. However, in simulations of ions in water using the SPC [31] or SPC/E [32] water models, the ions tend to fit between solvent layers [26, 27].
326 |
A.T. CONLISK AND SHERWIN SINGER |
|
|
3 |
|
|
|
|
|
|
2.5 |
|
|
|
|
|
|
2 |
|
|
|
|
|
ρ |
1.5 |
|
|
|
|
|
|
1 |
|
|
|
|
|
|
0.5 |
|
|
|
|
(a) |
(b) |
0 |
|
|
|
|
-10 |
-5 |
0 |
5 |
10 |
||
|
|
|
|
y/σ |
|
|
FIGURE 15.15. An illustration of fluid layering near a wall. Panel (a) is a snapshot of the region near the wall from a simulation of particles interacting via pairwise Lennard-Jones potentials, 4 ( σr )12 − ( σr )6 . The overall density of the fluid is ρσ 3 = 0.8. Fluid layers are visible next to the wall, near the top of the figure. Panel (b) is the equilibrium density profile across the channel.
Since PBT is a mean field theory, it neglects correlations between ions. Recently, the problem of ion correlation has received much attention. While PBT predicts that the effective interaction between like-charged walls, rods or spheres will always be repulsion, correcting for ion correlations predicts an effective attraction at high ionic strength. It remains to be seen whether correlation effects are significant under typical EOF conditions.
Finally, in classical PBT the solvent dielectric response is captured by modifying Coulomb interactions with a dielectric constant. This procedure is only correct for a dielectric medium of infinite size. The well-known correction when ions approach an interface with a medium of differing dielectric constant takes the form of image charges. For example, Onsager and Samaras showed that ions in a medium with a high dielectric constant, such as water, will be repelled from an interface with a medium of low dielectric constant [33]. What the fictitious image charge repulsion describes is the actual lessened dielectric solvation when the ion is near the interface. This is the likely situation for aqueous electrolyte flow in nanochannel fabricated in low silicon or polymeric materials. Image charge effects are included in molecular dynamics simulations. In simulations of a model electrolyte, decreased solvation near the wall results in complete exclusion of ions from the solvent layer adjacent to the wall [28].
15.6.3. Fluid Dynamics in Nanochannels
As discussed in the previous section, we know that classical PBT does not give sufficient accuracy to understand EOF in nanochannels [26–28]. Now we consider whether, with an accurate ion distribution, linear hydrodynamics can predict EOF in nanochannels. There are two studies of this issue, one by Qiao and Aluru [27] (QA) and the other by Zhu, Singer, Zheng and Conlisk [28] (ZSZC). In both studies simulations are compared with continuum fluid mechanics using an ion density that agreed with simulations (and not from PBT). The conclusions reached concerning the applicability of linear hydrodynamics are somewhat different.
MODELING ELECTROOSMOTIC FLOW IN NANOCHANNELS |
327 |
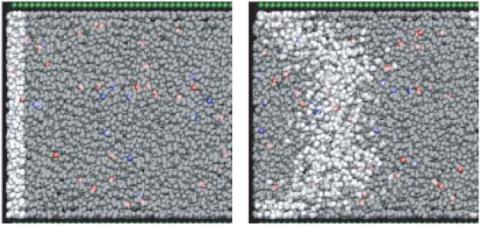
FIGURE 15.16. Snapshots from a simulation of EOF by Zhu, Singer, Zheng and Conlisk [28]. Cations are red, anions are blue, wall particles are green. In the left-hand frame the solvent particles within a slab are colored white, and the other solvent particles are left as gray. The right-hand frame, from a later time, shows the evolution of the slab of white-colored particles.
QA compared continuum theory with simulations in simulations of aqueous chloride ions confined by walls of Lennard-Jones particles. The width of their nanochannel is 3.49nm. They enforce no-slip boundary conditions at the positions of the outermost wall particles, and find that continuum theory predicts a velocity profile more than double that of simulations. They attribute this disagreement to a steep rise of solvent viscosity near the channel walls, and advocate incorporation of position-dependent viscosity into the Navier-Stokes equations.
ZSZC simulate EOF in a model fluid composed of spherical Lennard-Jones solvent and ions, as pictured in Fig. 15.16. Reflecting the exclusion of ions from the wall layer because of solvation forces discussed in the previous region, ZSZC find that solving the PBT equations within a region excluding the fluid near the walls gives a qualitatively accurate description of the charge density, and also yields analytic expressions for the velocity profile. In their comparison with continuum theory, ZSZC enforce no-slip boundary conditions at a surface that represents the furthest penetration of solvent against the walls. This surface is closer to the channel center than that of QA. In contrast to QA, ZSZC find that continuum hydrodynamics gives a good account of the velocity profile.
Differing points of view about the placement of the no-slip surface led QA and ZSZC to different conclusion about the applicability of standard hydrodynamics with a constant viscosity throughout the channel. By placing their continuum fluid up to the position of wall particles, QA neglect excluded volume interactions which keep solvent and walls atoms separated by the sum of their radii. To correct this picture, they invoke position dependent viscosity. ZSZC estimates a surface of closest penetration of solvent against the wall, which can be done in several ways. One method ZSZC uses is to fit the velocity profile from Poiseuille flow to the well-known analytical formula and set the no-slip surface at the point where the Poiseuille flow profile went to zero. They find that this procedure set the no-slip surface very close to the simple estimate of Travis and Gubbins [34], which
328 |
A.T. CONLISK AND SHERWIN SINGER |
is half a Lennard-Jones particle diameter from the centers of the wall particles. Using a better estimate of the no-slip surface for the system simulated by QA, ZSZC recalculate the velocity profile and found much better agreement between continuum theory and MD simulation without having to invoke position-dependent viscosity.
To obtain a completely analytical expression that matches simulation results, ZSZC solve PBT and corresponding hydrodynamic equations for fluid flow with adjustable volume available to the ions. The original intent is to describe the exclusion of ions from the wall region found in their simulations. However, the theory also brings to light a qualitative relationship between ion distribution and velocity profile: When ions are excluded from the wall region, the flow increases. Conversely, attraction of the ions to the walls decreases the flow rate. This trend exists because the greatest flow response occurs when the driving force is in the center of the channel, away from the no-slip boundaries.
15.7. SUMMARY
In this chapter we have described modeling of electroosmotic flow in microand nanochannels. We have reviewed the structure of the electric double layer and its role in the transport of ions and solvent in channels. The flow is driven by the difference in cation/anion concentrations at the walls of the channel. At small cation, anion concentration differences the Debye-Huckel picture of the electric double layer is appropriate; at larger concentration differences, the Gouy-Chapman picture of the electric double emerges naturally. We show how analytical solutions for the velocity and concentrations or mole fractions may be derived for electric double layer thicknesses small compared with the channel height.
Analytical results are compared with several sets of experimental data and the model compares well. In addition, the comparisons with experiments suggest that the continuum approximation may break down for channel hieghts on the order of 5nm and so the mechanics and results of molecular dynamics simulations are also described. It is shown that MD simulations allow preferential solvation near the wall in contrast to the continuum PoissonBoltzmann approach, resulting in significant differences in the magnitude of bulk solution and ionic transport.
The persistence of the validity of continuum theory down to under about 5nm in height, at first glance seems surprising. However, on further reflection, since liquid molecules are so close together an effective Knudsen number defined as the ratio of a molecular diameter to the smallest dimension of the channel remains small down to under 10nm. For water, the molecular diameter is about 0.3nm and so using the well-developed gas phase theory, an effective Knudsen number of 0.1 corresponds to a channel height of 3nm. Indeed it has often been mentioned that continuum theory in liquids persists to about 10 molecular diameters.
Most of the devices being fabricated today have channels greater than 2 or 3 nanometers. Continuum or near continuum behavior should obtain down to these scales. Thus despite the well-known lack of a well-defined theory of liquids, modeling of liquid flows at nanoscale seems to be relatively straightforward when compared to gases, even though there is a well-developed kinetic theory for gases. Indeed, for air a Knudsen number of around 1 corresponds to a channel height of about 60nm which is in the transition regime where continuum theory breaks down and expensive and time consuming molecular simulations are required.
MODELING ELECTROOSMOTIC FLOW IN NANOCHANNELS |
329 |
ACKNOWLEDGEMENTS
Much of the work described in this chapter was begun under funding from DARPA under agreement number F30602–00–2–0613. ATC is grateful to the contract monitors Dr. Anantha Krishnan (DARPA), Mr. Clare Thiem and Mr. Duane Gilmour of Air Force Research Lab (IFTC) for their support. ATC is also grateful to Dr. Mauro Ferrari and Professor Derek Hansford for getting him involved in this work. SJS gratefully acknowledges support from NSF grant CHE-0109243.
REFERENCES
[1]R.A. Robinson and R.H. Stokes. Electrolyte Solutions, Academic Press: New York, p. 284, 1959.
[2]J.S. Newman. Electrochemical Systems, Prentice-Hall, Englewood Cliffs, NJ, p. 138, 1973.
[3]R.J. Hunter. Zeta Potential in Colloid Science, Academic Press: London, p. 59, 1981.
[4]R.F. Probstein. Physicochemical Hydrodynamics, Butterworths: Boston, p. 161, 1989.
[5]Paul Delahay. Double Layer and Electrode Kinetics, Wiley Interscience, New York, 1965.
[6]John O’M. Bockris and Amulya K.N. Reddy. Modern Electrochemistry, Volume 1 Ionics, (2 Ed.), Plenum Press, New York, London, pp. 273f, 1998.
[7]J. Israelachvili. Intermolecular and Surface Forces, (2 Ed.), Academic Press, London, 1991.
[8]Private communication by Tony Boiarski, 2002.
[9]D. Hansford, T. Desai, and M. Ferrari. Nanoscale size-based biomoleculart separation technology, In J. Cheng, and L.J. Kricka (eds.), Biochip Technology, Harwood Academic Publishers, 341, 2001.
[10]E.J.W. Verwey and J.Th. G. Overbeek. Theory of Stability of Lyophobic Colloids, Elsevier: Amsterdam, 1948.
[11]W. Qu and D. Li. A model for overlapped EDL fields. J. Coll. Interface Sci., 224:397, 2000.
[12]D. Burgeen and F.R. Nakache. Electrokinetic flow in ultrafine capillary slits. J. Phys. Chem., 68:1084, 1964.
[13]S. Levine, John R. Marriott, and Kenneth Robinson. Theory of electrokinetic flow in a narrow parallel-plate channel. Farad. Trans., II, 71:1, 1975.
[14]C.L. Rice and R. Whitehead. Electrokinetic flow in a narrow capillary. J. Phys. Chem., 69(11):4017, 1965.
[15]S. Levine, J.R. Marriott, G. Neale, and N. Epstein, N. Theory of electrokinetic flow in fine cylindrical capillaries at high zeta potentials. J. Coll. Int. Sci., 52(1):136, 1975.
[16]A.T. Conlisk, Jennifer McFerran, Zhi Zheng, and Derek Hansford. Mass transfer and flow in electrically charged microand nano-channels. Anal. Chem., 74(9):2139, 2002.
[17]Zhi Zheng, Derek J, Hansford, and A.T. Conlisk. Effect of multivalent ions on electroosmotic flow in micro and nanochannels. Electrophoresis, 24:3006, August 2003.
[18]H.L.F. Helmholtz. Ann. Physik., 7(3):337, 1879.
[19]P. Debye, and E. Huckel. The interionic attraction theory of deviations from ideal behavior in solution. Z. Phys., 24:185, 1923.
[20]G. Gouy. About the electric charge on the surface of an electrolyte. J. Physics A, 9:457, 1910.
[21]D.L. Chapman. A contribution to the theory of electrocapillarity. Phil. Mag., 25:475, 1913.
[22]O. Stern. The theory of the electrolytic double layer. Z. Elektrochem., 30:508, 1924.
[23]J. Kevorkian, and J.D. Cole. Perturbation Methods in Applied Mathematics, Springer-Verlag, New York, 1981.
[24]S.C. Jacobson, S.V. Ermakov, and J.M. Ramsey. Minimizing the number of voltage sources and fluid reservoirs for electrokinetic valving in microfluidic devices. Anal. Chem., 71:3273, 1999.
[25]R. Sadr, M. Yoda, Z. Zheng, and A.T. Conlisk. An experimental study of electroosmotic flow in rectangular microchannels. J. Fluid Mech., 506:357, 2004.
[26]J.B. Freund. Electro-osmosis in a Nanometer-scale Channel Studied by Atomistic Simulation. J. Chem. Phys., 116(5):2194, 2002.
[27]R. Qiao and N.R. Aluru. Ion Concentrations and Velocity Profiles in Nanochannel Electroosmotic Flows. J. Chem. Phys., 118(10):4692, 2003.