

Biomolecular Sensing Processing and Analysis - Rashid Bashir and Steve Wereley
.pdf380 |
JENNIFER A. McCANN, THOMAS J. WEBSTER, AND KAREN M. HABERSTROH |
Note: Drawing not to scale
|
Cover Slide Recess |
|
|
|
|
|
Through Hole |
|
38.1 mm |
for PIV Access |
|
|
50.8 mm |
|
|
|
|
Screw Hole (X10) |
Top Plate |
|
|
|
|
Cover Slide
Gasket |
330 m Channel |
Injection |
Ejection |
Port |
Port |
Gas Purge Port
Gasket |
Cover Slide Recess |
35.2 mm |
75.3 mm |
Flow Channel |
Injection Port |
Ejection Port |
FIGURE 18.5. Schematic diagram of a parallel plate flow chamber. (Reprinted from Annals of Biomedical Engineering, Vol 3, McCann, Peterson, Plesniak, Webster, and Haberstroh, Non-uniform flow behavior in a parallel plate flow chamber alters endothelial cell responses, 327–335, Copyright 2005, with permission from Springer Science)
For example, such flow properties have been studied in vitro by Nauman et al. [55], Chung et al. [18], and [48]. Nauman et al. [55] used a variant of µ-PIV to measure the velocity field in a parallel plate flow chamber. Their technique was not a true PIV technique, however, in that the particles did not faithfully follow the local flow field. The mean flow streamlines
VASCULAR CELL RESPONSES TO FLUID SHEAR STRESS |
381 |
||||
|
Gas Purge |
|
|
|
|
38 mm |
|
|
|
|
|
Region 6 |
Region 5 |
Region 4 |
|||
|
|||||
19 mm
0 mm |
|
|
Region 1 |
|
|
|
|
|
|
|
|
Region 2 |
|
|
|
|
|
|
|
|
|
Region 3 |
||||||||||||||
|
|
|
|
|
|
|
25 mm |
|
|
|
|
|
|
|
|
|
50 mm |
|
|
|
|
|
|
|
|
|
|
|
||||||||
Inflow |
Velocity |
|
|
|
|
|
|
|
|
|
|
|
|
|
|
|
|
|
|
|
|
|
|
|
|
|
|
|
|
|
|
|
|
Outflow |
||
|
|
|
|
|
|
|
|
|
|
|
|
|
|
|
|
|
|
|
|
|
|
|
|
|
|
|
|
|
|
|
|
|||||
(mm/s) |
|
|
|
|
|
|
|
|
|
|
|
|
|
|
|
|
|
|
|
|
|
|
|
|
|
|
|
|
|
|
|
|
||||
55 |
57 |
|
59 |
61 |
63 |
65 |
67 |
69 |
71 |
73 |
75 |
|||||||||||||||||||||||||
|
|
|
|
|
|
|||||||||||||||||||||||||||||||
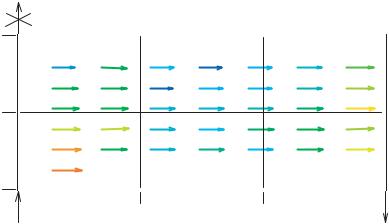
FIGURE 18.6. Velocity vector variations across the modified parallel plate flow chamber. The velocity was not uniform over the plate area, as determined using µ-PIV and DaVis software. The color scheme is such that the lowest velocities are represented in blue tones and the highest velocities are represented in red tones. Thus, the regions which experienced the overall lowest velocities were regions 5 and 2 (the two regions in the center of the slide), while region 1 (nearest the inlet) experienced the overall highest velocity. (Reprinted from Annals of Biomedical Engineering, Vol 3, McCann, Peterson, Plesniak, Webster, and Haberstroh, Non-uniform flow behavior in a parallel plate flow chamber alters endothelial cell responses, 327–335, Copyright 2005, with permission from Springer Science)
were determined with particles which had diameters of roughly 1/3 the channel height; these particles, while likely following the general flow path (assuming changes in flow velocity were very slow), can not accurately determine the local flow velocity due to their very large size [23, 63, 69b]. Therefore, McCann et al. [48] combined true micro-Particle Image Velocimetry (µ-PIV) flow measurements and gene expression studies to elucidate flow irregularities and corresponding cell response variations in their modified parallel plate flow chamber. Results from this study indicated that flow was laminar and parabolic, though not uniform over the chamber area (Figure 18.6) as could be assumed in perfectly smooth parallel plates. Specifically, channel height variations resulting from standard machining tolerances caused altered velocities across the parallel plate. The resulting shear stress distribution across the plate is presented in Table 18.1; these values demonstrated that the fluid shear stress in each of the six regions was not equal, as would be expected in parallel plate flow chamber models. The regional shear stress deviated from the average shear stress on the plate by as much as 11%. This change in shear stress was significant, as indicated by the non-uniformity of the endothelial cell gene expression across the parallel plate. In particular, results indicated non uniform up-regulation of COX-2 and ecNOS across the parallel plate chamber area [48]. These variations in gene expression corresponded with velocity values in the same region. For example, the regions with the overall lowest velocities (and shear stresses) also demonstrated the lowest level of gene up-regulation.
Regardless of machining accuracy, entrance, exit, and wall effects need to be considered when determining cell placement and responses [18]. Specifically, the center of the slide is

382 |
JENNIFER A. McCANN, THOMAS J. WEBSTER, AND KAREN M. HABERSTROH |
TABLE 18.1. Normalized shear stress values varied by parallel plate location. Shear stress values in each region were normalized by the measured average shear stress (7.6 dynes/cm2) over the entire plate. The shear stress values deviated from the average shear stress by as much as 11% across the channel area, ranging from 6.76 dynes/cm2 in region 5 to 8.43 dynes/cm2 in region 1. The uncertainty associated with the shear stress data is approximately +/− 0.01 dynes/cm2. (Reprinted from Annals of Biomedical Engineering, Vol 3, McCann, Peterson, Plesniak, Webster, and Haberstroh, Non-uniform flow behavior in a parallel plate flow chamber alters endothelial cell responses, 327–335, Copyright 2005, with permission from Springer Science.)
Region |
Normalized Shear Stress (dynes/cm2) |
1 |
1.11 |
2 |
0.92 |
3 |
1.05 |
4 |
1.05 |
5 |
0.89 |
6 |
1.07 |
|
|
typically the best place from which to obtain data; however, chamber inconsistencies are indiscriminant and can be a factor at any chamber location. Therefore, the most trusted cell responses are those averaged over the entire plate.
18.4. MODIFICATIONS TO TRADITIONAL FLOW CHAMBERS
Altered flow patterns occur in diseased vessels and can be simulated in vitro by modifying the traditional cone and plate viscometer and parallel plate flow chambers. For example, Freyberg et al. [26] studied laminar flow in a typical cone and plate viscometer and also inserted a triangular sheet of silicone into a parallel plate flow chamber to create a flow disturbance pattern. In addition, Holme et al. [33] placed a cosine shaped eccentric stenosis into a parallel plate perfusion chamber to mimic a coronary artery with advanced single eccentric stenosis. The protrusion of the stenosis into the flow channel determined the wall shear rate at the apex.
In addition to such geometrical changes, alterations to the flow profile can be created. For instance, Bao et al. [9] used a parallel plate flow chamber to study the effects of impulse, step, and ramp flow profiles (generated by a computer-controlled syringe pump) to study endothelial cell responses to steady shear stress as well as to temporal gradients, which are often present in areas of disturbed flow.
18.5. NONTRADITIONAL FLOW DEVICES
In addition to the more traditional cone and plate viscometer and parallel plate flow chambers, several other novel devices have been used to study shear stress effects on cells. In one example, plastic wells were mounted onto a horizontal rotator which moved the samples in a circular pattern (circumference = 3.5 cm); as the height of media on the cells was changed, cells located on the bottom of the wells were exposed to pulsatile turbulent
VASCULAR CELL RESPONSES TO FLUID SHEAR STRESS |
383 |
flow [71]. Similar to this approach, Kraiss et al. [37] applied shear stress to cell cultures via an orbital shaker, though this system did not subject cells to a well-defined and uniform laminar flow pattern. Another type of apparatus involves the use of a tube as opposed to a plate, which more accurately mimics the natural geometry of an artery or vein. For example, cells have been seeded onto polystyrene tubes and then exposed to laminar flow; the shear stress experienced by the cells was changed by controlling the flow velocity through the system [77]. Similarly, Ziegler et al. [93, 94] designed a unique system, which places elastic silicone tubes into a perfusion loop. The advantage of this strategy is that cells may be simultaneously exposed to both shear stress and mechanical strain.
18.6. LAMINAR SHEAR STRESS EFFECTS ON ENDOTHELIAL CELLS
Shear stress is studied with respect to endothelial cells because of their anatomical location in the vasculature (i.e., they are directly exposed to blood flow). Furthermore, endothelial cells are transducers of hemodynamic forces: they “feel” these forces via cellsurface receptors and respond appropriately to modulate vessel homeostasis. For example, it has been well-documented that following exposure to laminar shear stress, endothelial cells elongate and align in a direction parallel to the flow [21, 82]. Associated with this cell elongation is cytoskeletal (e.g., F-actin) realignment [19] in the direction of flow.
Exposure to steady laminar shear stress also results in altered endothelial cell proliferation. Akimoto et al. [1] exposed confluent layers of bovine aortic endothelial cells and human umbilical vein endothelial cells to laminar shear stresses of 5 and 30 dynes/cm2 and observed significantly decreased cell proliferation rates (as measured by DNA synthesis) after just 4 hours. However, at a shear stress of 1 dyne/cm2, only the human cell line showed decreased cell proliferation [1]. These results suggest that each cell type has its own threshold value at which proliferation is inhibited.
Flow-exposed endothelial cells also produce many bioactive agents which participate in the maintenance of vessel homeostasis; the expression of such mediators is determined by the cell’s gene expression. For example, laminar shear stress induces an atheroprotective phenotype in endothelial cells, leading to the expression of many vasodilating agents as well as mitogenic factors; three example molecules will be discussed in detail and Table 18.2 demonstrates a wide range of molecules whose expression are controlled at least in part by shear stress. First, a study by Noris et al. [57] demonstrated significantly increased levels of nitric oxide (NO) in human umbilical vein endothelial cells exposed to a laminar shear stress of 8 dynes/cm2 for 6 hours. This is important because the production of nitric oxide by endothelial cells is mediated by endothelial cell derived nitric oxide synthase (ecNOS), whose expression is also shear stress dependent. ecNOS is important for its role in catalyzing the reaction of arginine to citrulline, with NO as a by-product. This synthase is activated by exposure to shear stress, acetylcholine, and thrombin [44]. In support of this pathway, ecNOS gene expression was also significantly up regulated after 6 hours of shear exposure; this finding has been confirmed by numerous investigators [29, 81]. Moreover, the addition of an ecNOS inhibitor (Nω -nitro-L-arginine, L-NNA) to the culture abolished the shear induced nitric oxide production. Therefore, the response of ecNOS to various stimuli may well determine a cascade of atheroprotective events within the vessel environment. NO itself also possesses significant biological functions, acting as a vasodilator, inhibiting

384 |
JENNIFER A. McCANN, THOMAS J. WEBSTER, AND KAREN M. HABERSTROH |
TABLE 18.2. Laminar shear stress effects on endothelial cells.
Molecule |
Function |
Effect |
Reference |
|
|
|
|
ecNOS |
Synthesis of NO |
Sustained up regulation |
[81] |
COX-2 |
Synthesis of PGI2 |
Sustained up regulation |
[81] |
TGF-β |
Regulation of cell growth |
Sustained up regulation |
[58] |
MnSOD |
Antioxidant |
Sustained up regulation |
[81] |
PDGF-β |
Growth factor |
Sustained up regulation |
[65] |
c-jun, c-fos |
Growth response genes |
Sustained up regulation |
[35] |
ICAM-1 |
Intracellular adhesion molecule |
Transient up regulation |
[54] |
MCP-1 |
Chemokine |
Transient up regulation |
[74] |
Egr-1 |
Transcrition factor |
Transient up regulation |
[36] |
LOX-1 |
Endothelial receptor for Ox-LDL |
Transient up regulation |
[53] |
VCAM-1 |
Vascular cell adhesion molecule |
Down regulation |
[5] |
Endothelin-1 |
Vasoconstrictor |
Down regulation |
[46, 49] |
ACE |
Angiotensin converting enzyme |
Down regulation |
[67] |
MCP-1 |
Chemokine |
Down regulation |
[49] |
|
|
|
|
platelet and leukocyte adhesion to the endothelial cell layer, and inhibiting smooth muscle cell proliferation [44]. Each of these activities is directly related to atherosclerosis; for instance, without biologically active amounts of NO, smooth muscle cell proliferation would significantly increase, resulting in a situation where thrombus formation is likely.
Another atheroprotective molecule is prostacyclin (PGI2); prostacyclin is a vasodilator, an inhibitor of platelet and leukocyte aggregation at the vessel wall, and an inhibitor of smooth muscle cell contraction, migration, as well as cholesterol accumulation [81]. Research has demonstrated that atherosclerotic vessels possess less PGI2 than normal vessels, further suggesting its role as an atheroprotective molecule [88]. Moreover, laminar shear stress (over a range from 0.016 to 24 dynes/cm2) resulted in increased PGI2 production [25]. The gene responsible for the production of prostacyclin by endothelial cells is cyclooxygenase (COX)-2, which regulates the synthesis of prostanoids from arachidonic acid, with PGI2 as the main product. This molecule is also responsive to laminar shear stress [81]; COX-2 mRNA expression was significantly up regulated after 1 and 6 hours of exposure to a shear stress of 10 dynes/cm2.
Finally, the platelet derived growth factor family represents mitogenic factors which are released by endothelial cells; particularly, platelet derived growth factor (PDGF)-α and -β are involved in the progression of atherosclerosis. PDGF-α is a potent vasoconstrictor and smooth muscle cell mitogen. A report by Khachigian et al. [36] demonstrated significant induction of PDGF-α gene expression following exposure to a physiological level of steady laminar shear stress (10 dynes/cm2); this response was correlated with the expression of and interaction with the immediate-early gene (erg-1). However, results of Bao et al. [9] contradict this finding; their study suggested that NO release by endothelial cells in response to steady laminar shear stress inhibited the expression of PDGF-α. Similar to PDGF-α, PDGF-β is a potent mitogen for vascular smooth muscle cells, inducing smooth muscle cell growth, proliferation, and migration. The effect of shear stress on endothelial cell expression of PDGF-β has been studied by Resnick et al. [65]. Their study exposed bovine aortic endothelial cells to laminar shear stresses of 10 dynes/cm2 for four hours and demonstrated elevated levels of PDGF-β mRNA. Moreover, they reported that a shear stress responsive
VASCULAR CELL RESPONSES TO FLUID SHEAR STRESS |
385 |
element located in the PDGF-β gene was responsible for such induction. These results were important clinically since PDGF-β expression by vascular endothelial cells may constitute a pathogenic risk factor.
Shear induced up regulation of each of these genes suggests that endothelial cells constantly adjust to flow patterns in vivo to maintain homeostasis. Furthermore, these studies demonstrate that the overall cellular response to shear stress is a combination of both proatherogenic and atheroprotective mediators.
18.7. ENDOTHELIAL CELL RESPONSE TO ALTERED FLOWS
Healthy blood vessels generally experience laminar fluid flow; however, flow alterations (including lower than physiological shear stresses, turbulent flows, oscillatory flow patterns, temporal and spatial gradients in flow, etc.) exist in diseased vessels and often compound further disease development.
For instance, shear stresses at lower than physiological values mimic in vivo stagnation points, where inflammatory cells may attach to and act on the endothelial layer. This is supported by the finding that exposure to steady shear stresses of 2 dynes/cm2 resulted in increased endothelial cell expression of ET-1 (endothelin-1, a vasoconstricting agent and smooth muscle cell mitogen), VCAM-1, MCP-1 (monocyte chemoattractant protein-1, a potent chemotactic agent for monocytes), and the translation factor NF-κB [38, 50, 75]. In addition, turbulent flow profiles are found in diseased vessels; in contrast to laminar flow, such patterns have a range of shear stress frequencies and flow directions. Davies et al. [20] therefore characterized endothelial cell responses to both laminar and turbulent flow. Results indicated that following exposure to laminar flow (τ = 8 dynes/cm2) for 24 hours, cells became ellipsoidal shaped and aligned in the direction of flow. However, applying low shear stresses (τ = 1.5 dynes/cm2) in a turbulent flow profile for 16 hours resulted in randomly oriented cells; in addition, many of these cells were rounded yet still attached. After exposure to higher levels (τ = 14 dynes/cm2) of turbulent flow for 24 hours, cell retraction and cell loss became evident, as holes appeared in the monolayer. Furthermore, when the authors investigated cell cycle activity (via [3H]thymidine-labeled nuclei) following 24 hours of exposure to each flow pattern, it became evident that cells maintained under either low or high turbulent shear stresses exhibited higher turnover rates compared to cells maintained under laminar flow profiles.
Besides the adverse effects of stagnation regions, oscillatory flow patterns, described by a low mean component and flow reversals, have also been implicated in regions of atherosclerosis initiation. Ziegler et al. [93, 94] therefore studied the effects of this type of flow behavior (mean τ = 0.3 dynes/cm2, ranging from −3 to +3 dynes/cm2) on endothelial cells and demonstrated decreased ecNOS expression when compared to static cell cultures and cells exposed to unidirectional flow. Furthermore, exposure of endothelial cells to oscillatory flow patterns resulted in up regulation of ET-1 mRNA after only four hours; while ET-1 was also up regulated following exposure to low steady shear stresses (τ = 0.08 − 0.3 dynes/cm2) and pulsatile shear stress (τ = 6 dynes/cm2), its maximum expression occurred following oscillatory flow exposure.
In addition to these patterns, both temporal (an increase or decrease of shear stress over a certain time at a given location) and spatial (the difference in shear stress between two
386 |
JENNIFER A. McCANN, THOMAS J. WEBSTER, AND KAREN M. HABERSTROH |
points of a vessel or individual cell at the same time) gradients have also been implicated in atherosclerosis development. To better understand this theory, White et al. [92] studied temporal gradients (attained with a 0.5 second flow impulse at 10 dynes/cm2 followed by 20 minutes of no flow) in shear stress on endothelial cell responses and found increased endothelial cell proliferation. In contrast, this same group found that four hours of exposure to spatial gradients (attained with a smooth ramped flow model with flow beginning at 0 mL/s and reaching 3.5 mL/s within 15 seconds; the shear stress in this system was 10 dynes/cm2) had the same effect as steady laminar shear stress. Furthermore, specific genes were more responsive to temporal and spatial shear stresses. For example, while steady shear stress induced expression of MCP-1 and PDGF-α in endothelial cells, ramp flow caused a slightly greater increase and step and impulse flow models resulted in significant increases in these same genes [9]. Specifially, for MCP-1, a 2 fold increase over ramp flow occurred due to step flow while a 7 fold increase occurred for impulse flow. Similarly, for PDGF-α, a 3 fold increase occurred with step flow and a 6 fold increase occurred in response to impulse flow when compared to the results obtained for ramp flow.
Finally, to mimic flow patterns found in stenotic vessels, an object is often introduced into the flow models discussed previously. For instance, Freybery et al. [26] introduced flow disturbances in a flow chamber with the addition of a triangular piece of silicon to create proatherogenic flow profiles; the mean shear stress created in this system was 5 dynes/cm2. This study demonstrated increased endothelial cell apoptosis in response to such flow conditions. The authors used this finding to predict an atherosclerosis initiation mechanism. Specifically, their model suggests that endothelial cell injury and apoptosis is hemodynamically induced, causing increased endothelial cell proliferation and ultimately yielding a dysfunctional endothelial cell layer.
18.8. LAMINAR SHEAR STRESS EFFECTS ON VASCULAR SMOOTH MUSCLE CELLS
Shear stress over smooth muscle cells occurs in vivo via transmural flow [78, 79, 90]. A 2-D analysis (assuming that smooth muscle cells reside as cylindrical vessels in a uniform matrix) of the medial layer of the arterial wall suggested that, under normal transmural interstitial flow conditions, smooth muscle cells can be subjected to shear stresses on the order of 1 dyne/cm2 [90]. This model was later extended by Tada and Tarbell [78] to include the more complex flow conditions that are present at the entrance of fenestral pores. Their study modeled the medial layer of the vessel wall as a heterogeneous medium with square arrays of cylindrical smooth muscle cells, which were assumed to be impermeable to flow. The interstitial fluid (assumed to be Newtonian) was modeled as a continuous phase with a uniform matrix, and the internal elastic lamina was taken to be impermeable except for the openings in the fenestral pores. Further assumptions used in their study included the following: steady and uniform flow perpendicular to the smooth muscle cell axis, fenestral pores distributed in a periodic array, no-slip at the smooth muscle cells and the internal elastic lamina, and a uniform velocity profile. Results of this 2-D study suggested that smooth muscle cells immediately below the internal elastic lamina experienced shear stresses 10– 100 times higher than those located further away from the internal elastic lamina; the exact shear level depended on the parameters used to describe the size of the fenestral pores [78].
VASCULAR CELL RESPONSES TO FLUID SHEAR STRESS |
387 |
These findings imply that smooth muscle cells nearest the internal elastic lamina may be the most active due to the elevated shear stresses that they experience.
To more fully characterize the flow on smooth muscle cells located directly under the internal elastic lamina, their 2-D model was further developed into a 3-D model. Results from the 3-D model suggested that smooth muscle cells adjacent to the internal elastic lamina may experience shear stresses 3–14 times higher than smooth muscle cells located further away, a value much lower than predicted by the previous 2-D model [79]. However, the average shear stress experienced by smooth muscle cells remained at 1 dyne/cm2, suggesting that spatial gradients exist throughout the medial wall.
In addition to transmural flow, the effect of shear stress on vascular smooth muscle cells is also important in pathological situations when endothelial cells are removed from the luminal surface. In this case, smooth muscle cells experience direct shear exposure. As with endothelial cells, smooth muscle cells have been shown to respond to shear stress with altered cell morphology, function, and gene expression.
For example, in one study Lee et al. [39] exposed canine vascular smooth muscle cells to laminar shear stress (τ = 20 dynes/cm2) for 48 hours. This group found that the cells and their F-actin cytoskeleton aligned in a direction perpendicular to the flow; this realignment occurred in a magnitude and shear dependent manner. In contrast, a study by Sterpetti et al. [76] found that bovine aortic smooth muscle cells aligned slightly in the flow direction at a laminar shear stress of 6 dynes/cm2, while Papadaki et al. [60] observed no alignment of human abdominal aortic smooth muscle cells exposed to shear stresses up to 25 dynes/cm2. These contrasting results suggest that cell alignment may be dependent on factors including cell origin (species and vessel wall layer), cell conditions at the time of shear exposure (state of confluency), shear level, and duration of flow exposure [39, 60, 76].
In addition to morphology changes, smooth muscle cell proliferation was also inhibited in response to laminar shear stress exposure [39, 76, 85]. For example, in a study by Ueba et al. [85], human vascular smooth muscle cell numbers were significantly decreased after exposure to shear stresses of 14 and 28 dynes/cm2 for 24 hours. The higher shear level resulted in even further suppression of cell proliferation rates. This implicates shear stress as an inhibitor of smooth muscle cell proliferation at lesion sites, thus higher shear levels may play a role in preventing atherogenesis.
As with endothelial cells, shear stress also elicits a wide range of biochemical changes in vascular smooth muscle cells. Though it is likely that numerous molecules are affected by shear stress, only a few examples are provided. Specifically, an important atheroprotective mediator is PGI2, which is an inhibitor of smooth muscle cell proliferation and is also shear responsive in smooth muscle cells. When rat aortic smooth muscle cells were exposed to laminar shear levels of 1 and 20 dynes/cm2, enhanced production of PGI2 resulted [3]. The level of 1 dyne/cm2 was chosen to represent transmural flow; these findings therefore suggest that normal transmural flow may play a role in vessel remodeling.
In addition to the production of vasodilators such as PGI2, the release of mitogenic factors by smooth muscle cells is also controlled by fluid shear stress. For example, platelet derived growth factor (PDGF) and basic fibroblast growth factor (bFGF) are potent mitogens for smooth muscle cells [66, 77] and are likely involved in the proliferative response of smooth muscle cells to vascular injuries. Sterpetti et al. [77] applied laminar shear stresses of 3, 6, and 9 dynes/cm2 to bovine thoracic smooth muscle cells and found that with increasing shear levels, the release of both PDGF and bFGF into the circulating medium
388 |
JENNIFER A. McCANN, THOMAS J. WEBSTER, AND KAREN M. HABERSTROH |
was significantly increased. Rhoads et al. [66] exposed human aortic smooth muscle cells to laminar shear stresses of 1, 5, and 25 dynes/cm2 and found significant increases in fibroblast growth factor (FGF)-2 release at each shear level. However, no specific relationship was found between shear level and FGF-2 release, suggesting that its expression was flow rather than shear stress mediated. Interestingly, the FGF-2 release was not sustained over the course of the experiment and returned to near control levels after 24 hours of flow exposure. This finding was attributed to the 4 hour half-life of FGF-2, where the decline was due to FGF-2 absorption onto the surfaces within the flow loop. In combination, these studies provided evidence that smooth muscle cells are capable of secreting growth factors to sustain their own growth. In pathological conditions, the release of such mitogens could also affect the proliferation rates of cells in areas of plaque formation.
18.9. MECHANOTRANSDUCTION
18.9.1. Shear Stress Receptors
The precise mechanisms by which cells recognize and respond to shear stress (and other mechanical forces) are unclear. Potential mechanoreceptors include but are not limited to ion channels, G-proteins, and integrins.
For example, ion channels are responsible for transferring specific ions across the cell membrane; these channels play a critical role in maintaining intracellular solute concentrations. Several channels have shown shear stress responsiveness, including the K+ channel. Endothelial cell exposure to physiological shear stresses resulted in activated K+ channels after only seconds of exposure [2]; the magnitude of activation was dependent on the shear magnitude. Once the channel was activated, K+ influx was linked to hyperpolarization, which participated in increased Ca+ and altered signaling mechanisms [59]. Moreover, blockage of K+ channels has been shown to inhibit shear-stimulated gene expression (e.g., TGF-β1 when τ = 20 dynes/cm2 [58] and ecNOS when τ = 15 dynes/cm2 [86]).
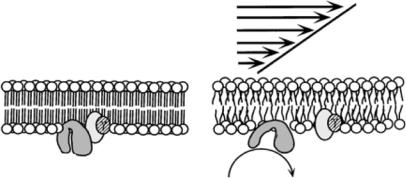
A second class of mechanoreceptors is the membrane-bound G protein family, which includes heterotrimeric G proteins, Ras and its homolog, and translation elongation factors. Heterotrimeric G proteins (composed of α, β, and γ subunits) are located on the phospholipid bilayer membrane of cells and are activated by cell-surface receptor interactions. When G proteins are associated with an activated receptor, the α subunit separates from the βγ unit (Figure 18.7) and each acts separately to affect signal transduction. These G-protein linked receptors are activated directly by fluid shear stress; Gudi et al. [30] demonstrated that this activation can occur just seconds after the onset of shear exposure. Moreover, this activation was followed by intracellular calcium release, which plays a role in many transduction pathways.
Finally, integrins are heterodimeric transmembrane receptors which connect the extracellular matrix and cell cytoskeleton; these molecules can also transmit signals across the cell membrane. Different combinations of α and β integrin subunits have unique binding characteristics and may therefore result in distinct intracellular effects. For example, Urbich et al. [87] demonstrated α5 and β1 mRNA and protein up regulation in endothelial cells following exposure to laminar shear stress. Such integrin activation can be linked to downstream effects; for instance, fluid shear stress experiments have shown that αvβ3 is
VASCULAR CELL RESPONSES TO FLUID SHEAR STRESS |
389 |
Shear Stress
β |
β |
α |
α |
|
GDP
A |
GTP |
GDP |
B
FIGURE 18.7. Schematic diagram depicting the mechanism by which G proteins can be directly activated by shear stress. (Reprinted from Proceedings of the National Academy of Sciences, Vol 95, Gudi, Nolan, and Frangos, Modulation of GTPase activity of G proteins by fluid shear stress and phospholipid composition, 2515–2519, Copyright 1998, with permission from the National Academy of Sciences, U.S.A.)
involved in the activation of IκB [11, 17], while β2 activation is involved in ERK1/2 activation [81]. In addition to affecting protein kinases, integrin activation also plays a role in gene expression (e.g. α5β1 integrin is linked to ecNOS expression in endothelial cells [22]) and other cell functions like adhesion and migration [6, 52].
Finally, evidence has suggested that there may be significant interaction among these membrane receptors. For instance, Gα activation has been linked to both Ca2+ and K+ ion channel activation [31].
18.10. TRANSDUCTION PATHWAYS
Following activation of shear stress receptors, nonlinear, complex signaling cascades begin and ultimately result in the transduction of an external mechanical force into a chemical signal received by the nucleus. As such, signal transduction cascades are an area of significant scientific effort. For example, a wide range of molecules participating in these complex cascades have been identified, including G proteins (e.g., Rho and Ras), tyrosine kinases (Src, FAK, MAPKs), and many others. In general, these pathways involve a complex set of reactions which occur in the cell cytoplasm, followed by activation of a transcription factor which can move into the nucleus to affect cell functions. Two potential shear-induced signaling mechanisms are outlined below.
18.10.1. Ras-MAPK Pathways
p21ras, a small G protein, is activated by laminar shear stress and triggers the MAPKJNK/ERK pathways (Figure 18.8; [41]). Upstream of p21ras, several potential mechanisms exist. For instance, integrins or G proteins can activate p60src [34] via a Shc-Grb2-Sos